
The process
The basis of the process
Human activities can be managed. Indeed, this approach is the basis of Scotland’s National Marine Plan (NMP). Determining the top five pressures that result from the range of human activities that occur in any given sea area was undertaken in the three-stage process:
- Determine activities and associated pressures per region (what takes place and where). This requires an understanding of the human activities taking place in any Scottish Marine Region (SMR) or Offshore Marine Region (OMR) and knowing the pressures associated with the individual human activities.
- Identify, scope and rank pressures. This requires a method for determining the impact of the pressure(s) on the marine environment associated with a specific human activity and that such impacts can be ranked within/for each marine region.
- Consensus building workshop.
Stage 1: Determine activities associated pressures per region
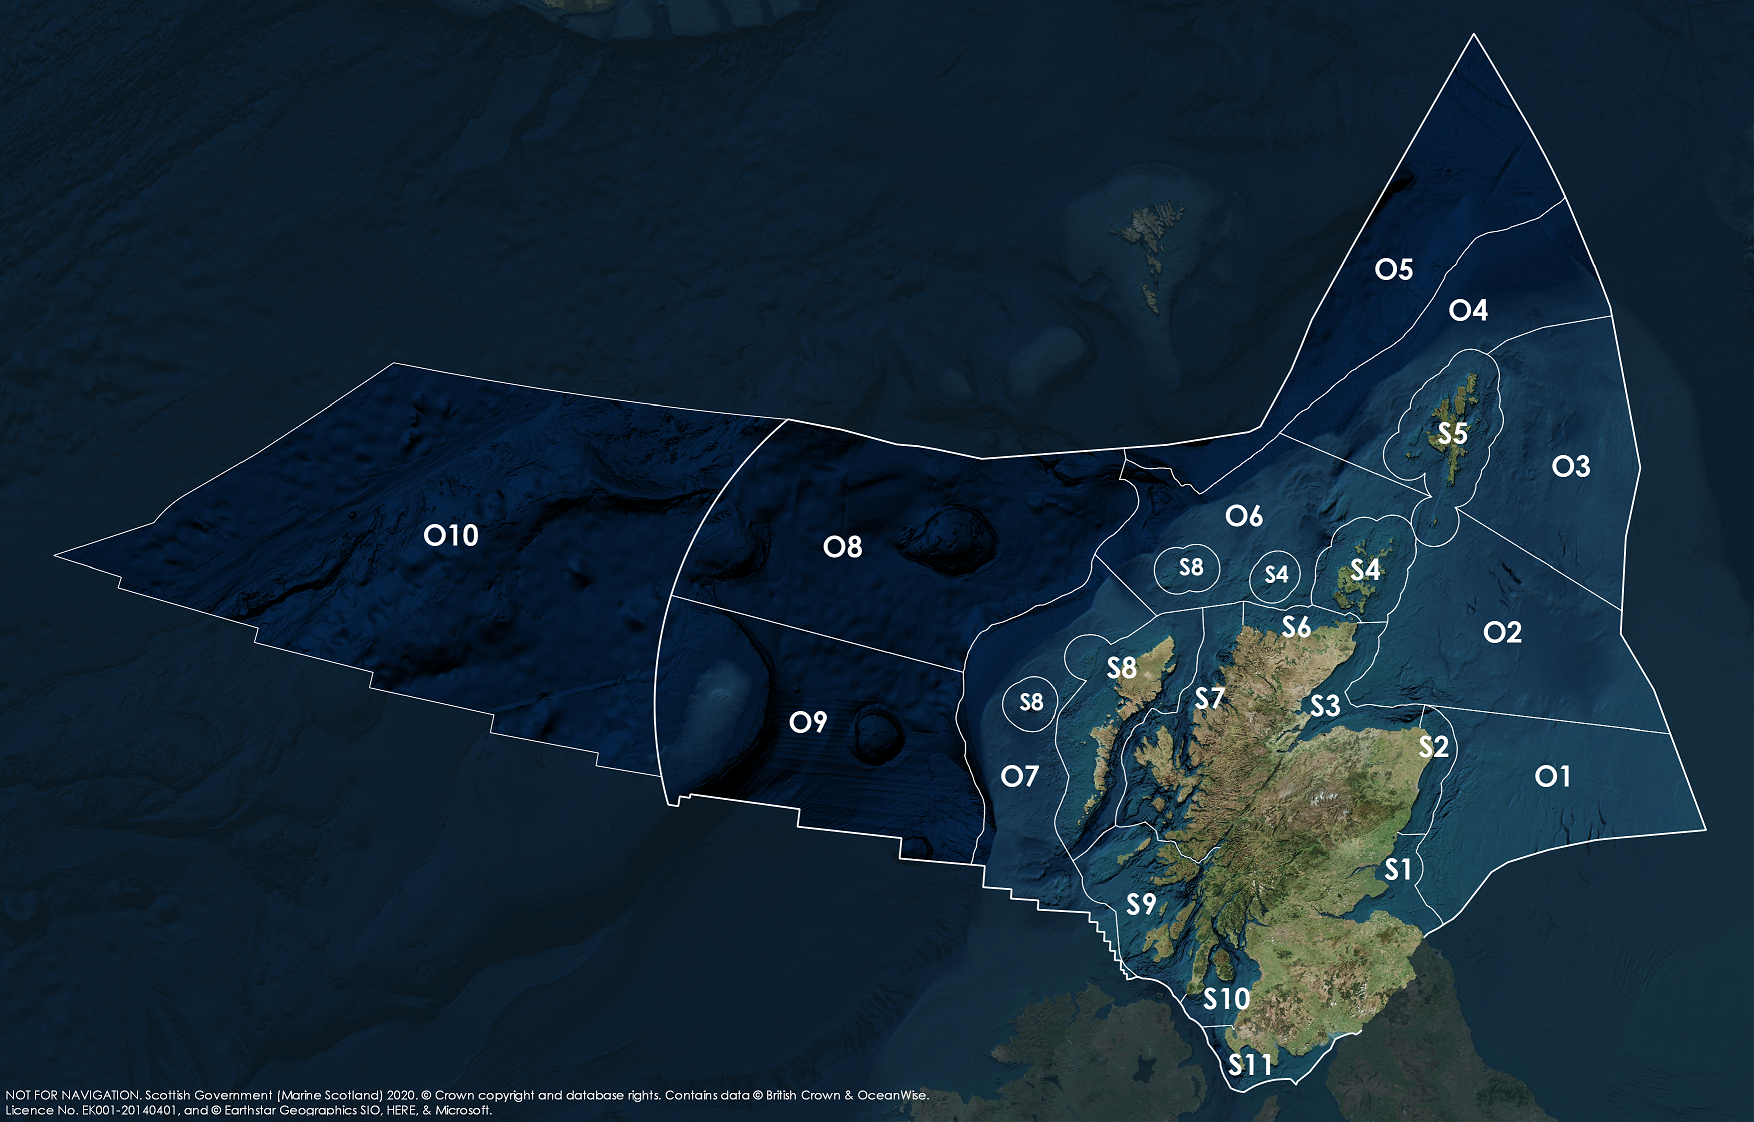
Identification of the human activities taking place in the twenty one regions (Figure 1) was achieved by a small working group which used Marine Scotland Maps NMPi (National Marine Plan interactive) as the primary tool to assign activities to locations. Marine Scotland Maps NMPi is the Scottish Government’s mapping tool that enables the occurrence of human activities to be mapped to geographical locations (Figure 2).
 |
||
|
Figure 1: 21 Scottish Marine Regions and Offshore Marine Regions assessed for pressures from human activities.
|
|
|
S1 = Forth and Tay
S2 = North East
S3 = Moray Firth
S4 = Orkney Islands
S5 = Shetland Isles
S6 = North Coast
S7 = West Highlands
S8 = Outer Hebrides
S9 = Argyll
S10 = Clyde
S11 = Solway
|
O1 = Long Forties
O2 = Fladen and Moray Firth Offshore
O3 = East Shetland Shelf
O4 = North and West Shetland Shelf
O5 = Faroe-Shetland Channel
O6 = North Scotland Shelf
O7 = Hebrides Shelf
O8 = Bailey
O9 = Rockall
O10 = Hatton
|
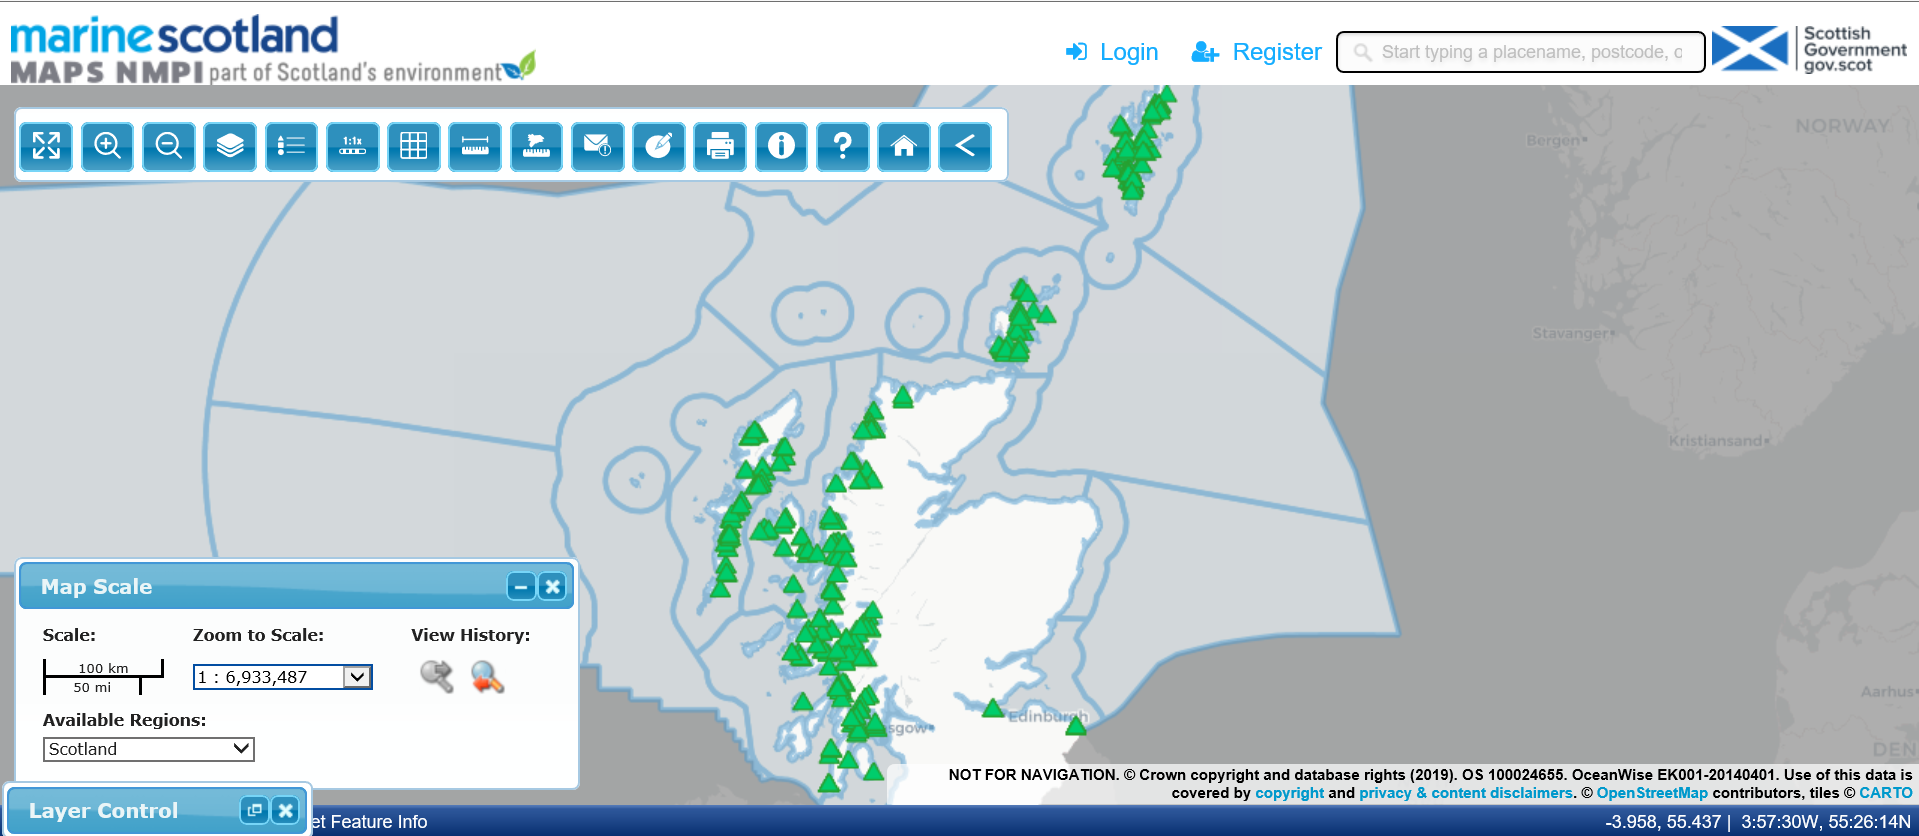 (a)
|
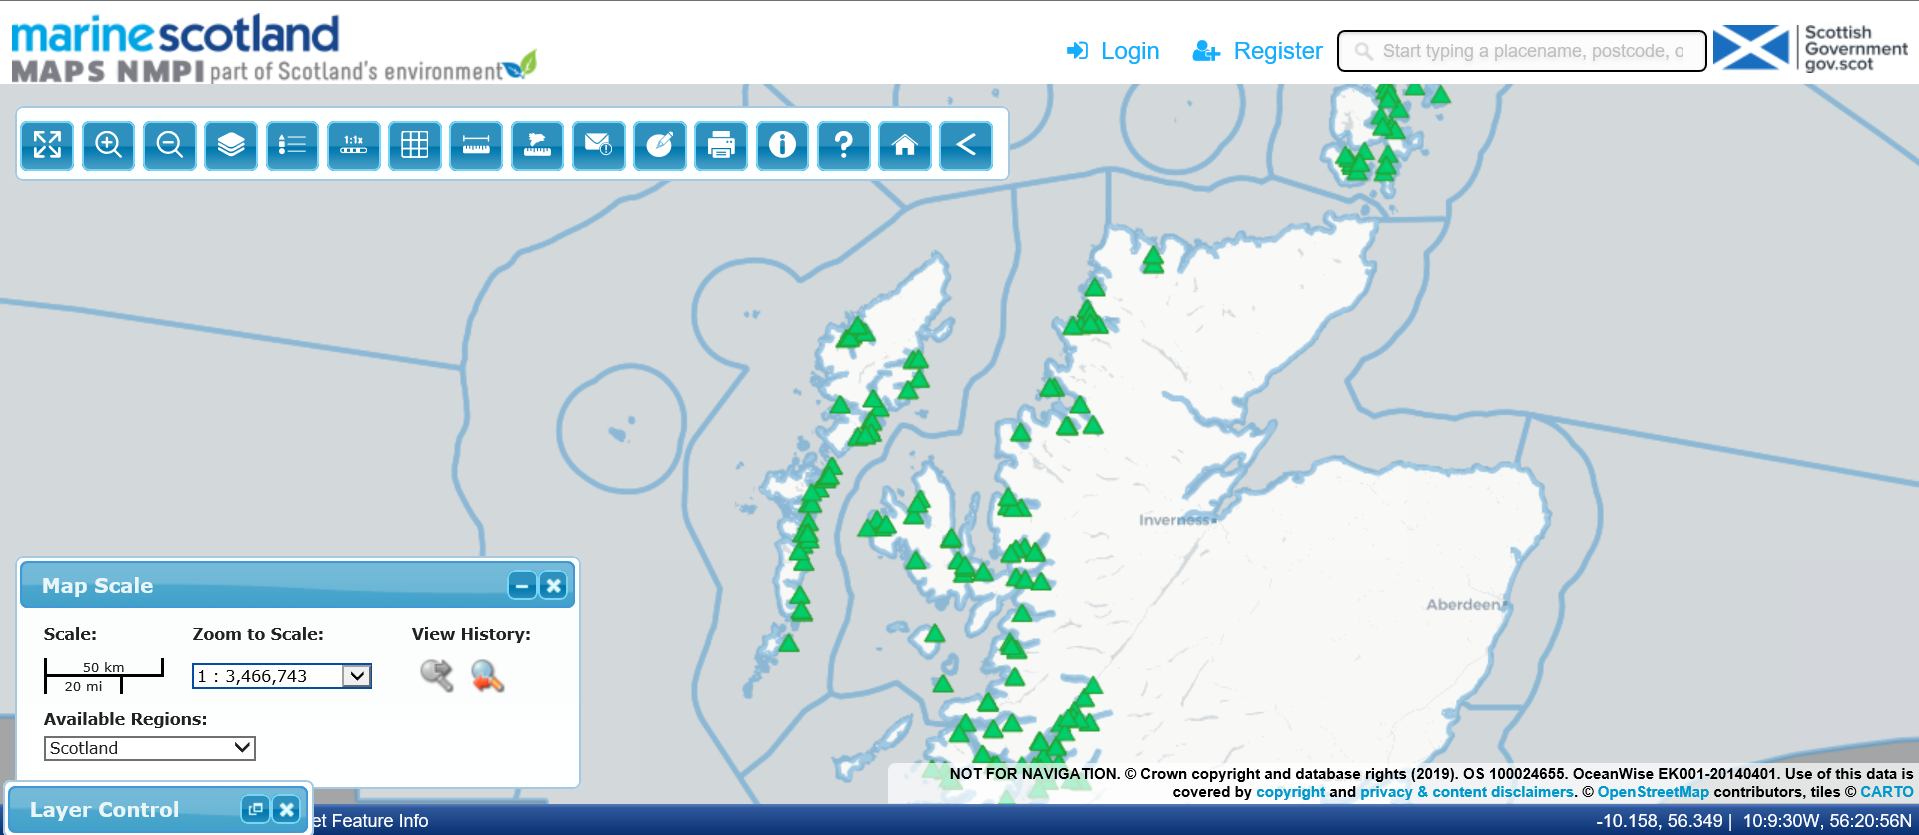 (b)
|
| Figure 2: (a) Active marine finfish aquaculture sites (March 2020) obtained using Marine Scotland Maps NMPi. The Scottish Marine Regions (SMRs) and Offshore Marine Regions (OMRs) are shown. (b) Expanded map showing in more detail the active marine finfish sites (March 2020) in, specifically, the Outer Hebrides and West Highlands SMRs. |
The pressure(s) associated with each activity were identified using the Feature Activity Sensitivity Tool (FeAST). This sensitivity tool has been developed jointly by NatureScot, Joint Nature Conservation Committee and Marine Scotland. An updated version of the marine pressure list was created during 2019 as part of ongoing redevelopment of FeAST and for use as a snap shot in this assessment. This online tool allows users to understand how pressures are associated with marine activities as well as providing a detailed description of the pressure(s). For further up to date information visit the FeAST webpage.
FeAST uses a defined list of 48 activities split into 15 activity categories which are:
- Aquaculture
- Beach replenishment
- Bioprospecting
- Energy production & associated infrastructure
- Extraction
- Fishing
- Industrial & agricultural liquid discharges
- Infrastructure
- Military activities
- Seaweed harvesting
- Seismic survey
- Sewerage disposal
- Shipping
- Tourism & recreation
- Waste disposal
These categories are split further where specific activities are likely to cause different impacts on marine features e.g. Infrastructure covers five specific activities (Table A) and fishing has 16. In total there are 48 activities.
|
Infrastructure
|
Cables & pipelines (operations & installation)
|
|
Coastal defence and land claim
|
|
|
Coastal (ports, marinas, leisure facilities)
|
|
|
Land based at coast (e.g. roads, forestry works, quarrying) - activity name widened from quarrying only.
|
|
|
Oil & gas infrastructure
|
To classify which activities took place in each region, a simple scoring system was used. Activities were classed as: ‘A’, ‘B’ or ‘Not Applicable’. An ‘A’ was assigned to those activities that were considered to be widespread and persistent, while ‘B’ acknowledged that the activity occurred but the associated pressures did not require further consideration. In cases where there was uncertainty in the allocation of categories , ‘A’ was assigned to the activity to allow that activity to be considered at the next stage of the process. Furthermore, the confidence in assigning ‘A’ or ‘B’ was recorded as high, medium or low.
The process created a spreadsheet that listed the activities within each region (SMR / OMR) across the 2014 – 2018 assessment period for each of the 21 marine regions. An extract from the assessment of the Forth and Tay SMR is presented in Table B. In order to make the assessment of 21 OMR/SMRs tractable, regions were grouped by geographic location as presented in Table C and were assessed by five groups of experts during a formal assessment exercise.
|
Activity Category (FeAST)
|
Activity Name (FeAST)
|
Forth and Tay
(SMR)
|
Confidence
HIGH / MEDIUM / LOW
|
|
Aquaculture
|
Finfish culture
|
B
|
HIGH
|
|
Seaweed culture - new activity
|
B
|
HIGH
|
|
|
Shellfish culture
|
B
|
HIGH
|
|
|
Beach replenishment
|
Beach replenishment
|
B
|
HIGH
|
|
Bioprospecting
|
Bioprospecting
|
B
|
HIGH
|
|
Energy production & associated infrastructure
|
Carbon capture and storage - new activity
|
B
|
HIGH
|
|
Energy production - on land (power stations, inc. nuclear)
|
B
|
HIGH
|
|
|
Tidal turbine energy production
|
B
|
HIGH
|
|
|
Wave turbine energy production
|
B
|
HIGH
|
|
|
Wind turbine energy production
|
B
|
HIGH
|
|
|
Extraction
|
Aggregate extraction
|
B
|
HIGH
|
|
Dredging (capital, maintenance)
|
A
|
HIGH
|
|
|
Extraction of sediment as part of oil and gas production
|
B
|
HIGH
|
|
|
Water extraction (freshwater catchment; industrial e.g. power station)
|
B
|
HIGH
|
|
Group
|
Name of grouping
|
Scottish Marine Region / Offshore Marine Region covered
|
|
1
|
Inshore east coast
|
Forth and Tay, North East, Moray Firth, North Coast.
|
|
2
|
West coast
|
Solway, Clyde, Argyll, Outer Hebrides, West Highlands, Hebrides Shelf, North Scotland Shelf.
|
|
3
|
Off the shelf
|
Hatton, Bailey, Rockall, Faroe-Shetland Channel.
|
|
4
|
Northern Islands
|
Orkney Islands, Shetland Isles.
|
|
5
|
North Sea Shelf
|
Long Forties, Fladen and Moray Firth Offshore, East Shetland Shelf, North and West Shetland Shelf.
|
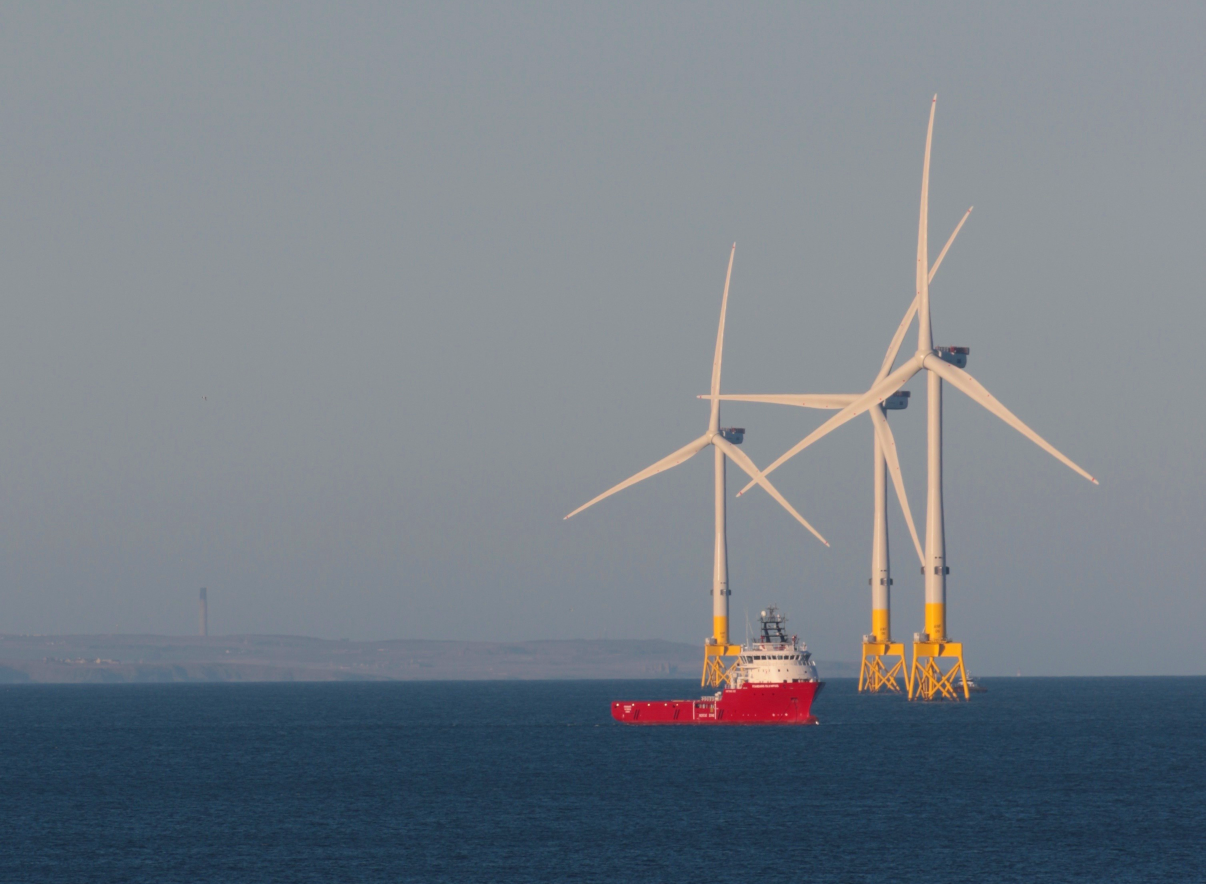 |
| One of the FeAST Activity Categories is ‘Energy production & associated infrastructure’ which includes the Activity ‘Wind turbine energy production’. This was assessed as part of the activities/pressures procedure. |
Stage 2: Identify, scope and rank pressures
Five groups of experts, from the MASTS community, were convened for the purposes of the assessment exercise under the leadership of an expert with specific knowledge relating to one of the five geographic groupings (Table C). They were provided with a range of information including:
- the outcomes from Stage 1.
- a table, prepared by the Habitats and Species Assessment Group, presenting a list of the FeAST pressures that had the most impact for the habitats and species being assessed in SMA 2020.
- a blank prioritisation table (presented with an example) that contained clearly defined criteria (columns 1 - 6), to help rank pressures (see Table D). A list of pressures and their definitions can be found on the FeAST web site.
|
Pressure
|
Main ecosystem components affected
|
1.
Loss/mortality or Injury/Disturbance
|
2.
Area within SMR
|
3.
Ecosystem component exposure
|
4.
Temporal frequency
|
5.
Intensity
|
6.
Acute/chronic
|
|
Underwater noise
|
Cetacean and seals
|
Di
|
Loc-W
|
Par
|
I
|
M
|
A & C
|
|
Physical change (to another seabed type)
|
Benthic habitats
|
Lo
|
Loc
|
Min
|
I
|
H
|
A
|
|
Sub-surface abrasion/penetration:
|
Benthic habitats
|
Di
|
W
|
Mos
|
P
|
H
|
A
|
-
Permanent loss (e.g. habitat loss) / mortality (Lo)
-
Disturbance (to ecosystem function/behaviour)/injury (Di)
-
Widespread (W) within the SMR (the footprint occurs over the majority of the SMR)
-
Localised but Widespread (Loc-W) (a localised pressure but occurs in many parts of the SMR)
-
Localised to one or two areas (Loc)
-
Absent (Abs)
-
All (All)
-
Most (Mos)
-
Partial (Par)
-
Minimal (Min)
-
Persistent (P)
-
Infrequent (between 1-5 occurrences per reporting period) (I)
-
Rare (less than 1 occurrence) (R)
-
High (H)
-
Moderate (M)
-
Low (L)
-
Acute (A)
-
Chronic (C)
-
Unknown (U)
The experts groups were required to the rank the pressures affecting the identified ecosystem components within each SMR / OMR taking into account the six pressure criteria. The instruction was that, where a pressure affects more than one ecosystem component, then this should be considered to be additive in the ranking process. Furthermore, pressures that result in loss over disturbance, have a high spatial coverage, affect a large proportion of an identified ecosystem component, occur often, are of high intensity, and are chronic in nature were to be rated the highest (although it was made clear that such a combination may not necessarily be present).
Stage 3: Consensus building workshop
Stage 3 was the final stage in the process and was undertaken at a one-day workshop in Glasgow as part of the MASTS Annual Science Meeting in October 2019. It included five groups formed by the five leads, additional biological experts chosen by the leads, and other stakeholders from the assessment author community. The objective of the workshop was to allow the five groups to meet and to complete the pressure assessment exercise with the delivery of 21 completed versions of Tables E and F. A consensus approach was used to confirm the five main pressures having an impact within each region, to discuss if a five year pressure trend could be identified, and to make the necessary links to the source human activity. In other words, completion of the last two columns in Table E.
At the workshop there was also an opportunity to resolve any differences in view emerging from the pre-workshop analysis and to ensure a consistency of approach across the five group.
In the event it was not possible to reach consensus on a complete suite of five year pressure trends in the absence of detailed quantitative data. This illustrates how challenging such a process is and points to the requirement for further thought on how to best assess pressure trends arising from specific human activities.
|
Pressure
|
Rank
|
Main ecosystem components affected
|
Assessment components
|
Main contributing activity /activities to pressure
|
1 Jan 2014 – 31 Dec 2018
5 year trend in pressure
|
|||||
|
1
|
2
|
3
|
4
|
5
|
6
|
|||||
|
|
|
|
|
|
|
|
|
|
|
|
|
|
|
|
|
|
|
|
|
|
|
|
|
|
|
|
|
|
|
|
|
|
|
|
|
|
|
|
|
|
|
|
|
|
|
|
|
Footnotes, assumptions and relevant reasoning to ensure openness and transparency of assessment, assumptions and relevant reasoning to ensure openness and transparency of assessment: |
|
|
Although significant progress was made at the workshop, some additional discussions were facilitated between the group leaders to further ensure consistency of approach and delivery.
 |
| The one day workshop was held to allow the experts to meet and to complete the pressure assessment exercise with the delivery of an activities/pressure assessment for each of the 21 SMRs/OMRs. |
Following the workshop, the group leaders prepared text for each of the regions within their area and finalised the summary table. There was some post-Workshop discussions between SSDAG and the leads as the final conclusions were drawn.