
Background
The cultivation, harvesting and sale of bivalves are important to the overall Scottish economy and that of coastal rural areas. This group of shellfish includes mussels, oysters, clams, cockles and scallops, which are aquatic molluscs with shells formed from two parts hinged together. They grow by filtering the microscopic marine algae found floating in the water column, called phytoplankton. Phytoplankton are the organisms at the bottom of the marine food chain and, although most of them are harmless, some species produce biotoxins that are dangerous to birds and mammals, including humans. Through the process of filter-feeding, bivalve molluscs can accumulate high concentrations of life-threatening biotoxins within their flesh that cannot be destroyed by cooking or freezing.
When humans consume shellfish containing biotoxins, it can lead to three different types of poisoning: amnesic (short-term memory loss), paralytic (affects nervous system), and diarrhetic shellfish poisoning (gastrointestinal). The main cause of concern for the shellfish aquaculture industry is the presence of diarrhetic shellfish toxins. These can result in harvesting bans throughout the year, often for prolonged periods. The potentially fatal biotoxins that cause amnesic and paralytic shellfish poisoning are also found in Scottish coastal waters, usually in spring and summer, when the algae blooms. Amnesic shellfish toxins rarely exceed allowable levels, but harvesting is banned due to the presence of paralytic shellfish toxins in most years.
Both biotoxins and phytoplankton are routinely monitored by Food Standards Scotland (FSS) under Regulation (EC) No. 854/2004. Harvesting areas are closed, when necessary, in order to prevent consumption of contaminated shellfish.

Figure 1: Shellfish samples were collected from biotoxin monitoring sites in 2018 (blue circles). Seawater samples were collected from the phytoplankton monitoring sites (purple diamonds). The blue areas are the Scottish Marine Regions (SMRs) and the Offshore Marine Regions (OMRs). Source: FSS
Since November 2006, classified shellfish production areas have been assigned to groups known as ‘pods’, based on hydrographic and environmental similarity. Each pod has a Representative Monitoring Point (RMP), considered to be indicative of any toxicity in the area, and may also have several Associated Harvesting Areas. There are around 260 classified shellfish harvesting sites within 174 production areas, although not all actively harvest every year. For example, during 2018, shellfish were collected from 86 inshore sampling locations, covering 76 pods, for biotoxin testing, and seawater samples for phytoplankton analysis were collected from 45 locations within 42 pods.
The shellfish testing frequency at each RMP is determined by risk assessment (Holtrop et al., 2016), based on seasonal occurrence and historic events. Testing for each of the main biotoxin groups is set at either weekly, fortnightly, or once every four weeks. In cases where monitoring is less than weekly, the frequency of testing is increased if either the results from the routine biotoxin testing or the phytoplankton monitoring indicate a heightened risk, since the enumeration of phytoplankton species can be used as an ‘early warning’ of the possible occurrence of shellfish biotoxin events.
To target the testing of shellfish, threshold concentrations, or trigger levels, of the main genera of phytoplankton have been determined by comparing historic data sets of phytoplankton counts with the presence of biotoxins in shellfish. The detection of any of the biotoxin groups at concentrations within shellfish flesh that exceed EU regulatory limits leads to the closure of all classified shellfish sites within that pod, until biotoxin concentrations have subsided.
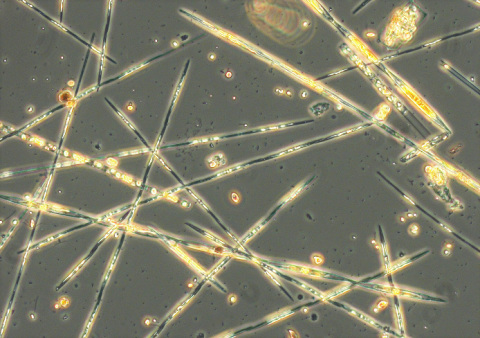
Three main groups of toxins are routinely monitored in Scottish waters. The potential for amnesic shellfish poisoning (ASP) is indicated by domoic acid in shellfish flesh and the presence of the diatom genus Pseudo-nitzschia in the phytoplankton (Figure a). In Scotland, the threshold concentration for Pseudo-nitzschia is set at 50,000 cells/L.
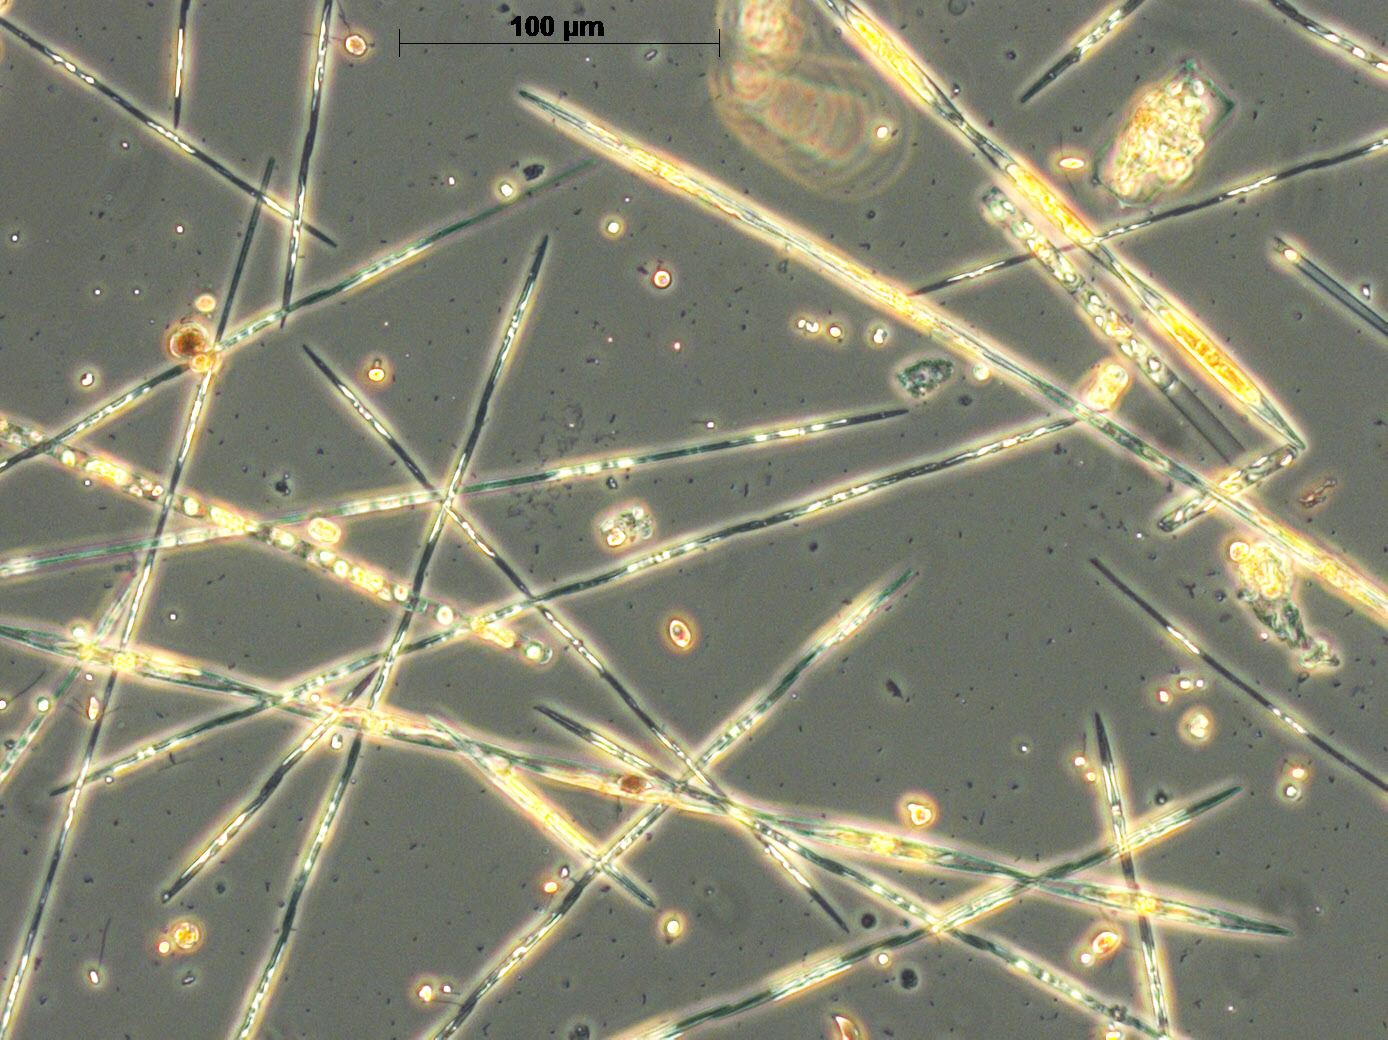
Figure a: Mixed species bloom of Pseudo-nitzschia © Scottish Association for Marine Science
Toxins that cause paralytic shellfish poisoning are indicated by saxitoxin in shellfish flesh and the dinoflagellate genus Alexandrium in the phytoplankton (Figure b). The Alexandrium threshold is set at 40 cells/L.

Figure b: Chain of Alexandrium cells © Scottish Association for Marine Science
The presence of lipophilic toxins is a major issue for the shellfish aquaculture industry and, depending on the causative phytoplankton organism, can lead to prolonged harvesting bans at any time of the year, often lasting for up to several months in duration. This toxin group includes okadaic acid (OA) and its related analogues, the dinophysistoxins (DTXs), which cause diarrhetic shellfish poisoning. In Scottish coastal waters, the causative organisms are dinoflagellate species belonging to the genera Dinophysis (Figure c) and Phalacroma, and the benthic dinoflagellate species Prorocentrum lima. Thresholds for Dinophysis/Phalacroma and Prorocentrum lima are both set at 100 cells/L. Pectenotoxins (PTXs) co-occur with OA and DTXs, and are expressed as OA equivalents within the OA group (Dhanji-Rapkova et al., 2018). Other regulated lipophilic toxin groups, the azaspiracids (AZAs) and yessotoxins (YTXs), are not particularly abundant in Scottish shellfish. Azaspiracids are associated with diarrhetic shellfish poisoning and are produced by dinoflagellate species belonging to the genera Azadinium and Amphidoma. The dinoflagellates Protoceratium reticulatum, Lingulodinium polyedra and Gonyaulax species have been linked to the production of YTXs, although YTXs as a source of poisoning in humans has never been confirmed (Dhanji-Rapkova et al., 2019).

Figure c. Mixed species of Dinophysis © Scottish Association for Marine Science,
The monitoring programme will also report unusually large occurrences of any other potentially problematic species, such as the ‘red tide’ dinoflagellate Karenia mikimotoi. This species is not an issue in terms of shellfish harvesting, as it does not produce biotoxins that are harmful to human health. However, it does produce ichthyotoxins that can kill finfish, and dense blooms of the order of several million cells/L may result in both fish and invertebrate mortality due to hypoxia (Davidson et al., 2009).
Shellfish and seawater samples were collected under contract to Food Standards Scotland, following UK National Reference Laboratory guidance. Shellfish were tested for biotoxins at the Centre for Environment, Fisheries and Aquaculture Science (Cefas), an executive agency of the UK government, in Weymouth. Seawater samples were analysed for phytoplankton by the Scottish Association for Marine Science (SAMS), near Oban. Table a shows the number of shellfish tested for the presence of biotoxins and the number of seawater samples analysed for phytoplankton between 2010 and 2018. The majority of sites from which samples were collected were located on the west coast of mainland Scotland in Solway, Clyde, Argyll, West Highlands, and Outer Hebrides. On the east coast, sites in Forth and Tay, and Moray Firth were monitored, although not in every year. A high proportion of samples were from the Shetland Isles, reflecting the amount of shellfish production in this region.
|
|
2010
|
2011
|
2012
|
2013
|
2014
|
2015
|
2016
|
2017
|
2018
|
|
Amnesic shellfish toxins
|
1921
|
1846
|
1170
|
1118
|
1335
|
1326
|
1277
|
942
|
793
|
|
Paralytic shellfish toxins
|
2473
|
2399
|
1969
|
1634
|
1905
|
1841
|
1717
|
1380
|
1160
|
|
Diarrhetic shellfish toxins (bioassay)
|
2526
|
1041
|
10
|
n/a
|
n/a
|
n/a
|
n/a
|
n/a
|
n/a
|
|
Okadaic acid group (analytical)
|
n/a
|
1483
|
1857
|
2787
|
2923
|
2939
|
2841
|
2056
|
1857
|
|
Azaspiracids (analytical)
|
n/a
|
1483
|
2857
|
2787
|
2923
|
2939
|
2841
|
2056
|
1857
|
|
Yessotoxins (analytical)
|
n/a
|
1483
|
2857
|
2787
|
2923
|
2939
|
2841
|
2056
|
1857
|
|
Phytoplankton
|
947
|
1004
|
928
|
1039
|
1270
|
1306
|
1301
|
1351
|
1301
|
Testing for the presence of amnesic shellfish toxins (ASTs) was carried out using High-Performance Liquid Chromatography with UV detection (HPLC-UV). The maximum permitted level (MPL) is 20 mg domoic acid equivalent (DA eq.) per kg of shellfish flesh, with a Limit of Quantitation (LOQ) of 1 mg/kg DA eq./kg (Rowland-Pilgrim et al., 2019).
Paralytic shellfish toxins (PSTs) were detected using either a bioassay method or Liquid Chromatography with Fluorescence Detection (LC-FLD). The analytical method has been used exclusively for all shellfish species from classified harvesting areas from September 2011. An initial qualitative screen test was used to identify samples with PSTs likely to be in excess of 400 µg STX eq./kg and only those samples were subject to full quantitative analysis. The MPL is 800 µg saxitoxin equivalent (STX eq.) per kg of shellfish flesh, with a reporting limit (RL) of 160 µg STX eq./kg (Turner et al., 2014).
Toxins within the lipophilic toxin group were determined using a liquid chromatography tandem mass spectrometric (LC-MS/MS) method from July 2011. This enabled the quantification of specific toxin groups, which had not previously been possible with bioassay (Dhanji-Rapkova et al., 2018). Okadaic acid, dinophysistoxins and pectenotoxins are reported as okadaic acid equivalent (OA eq.) and the MPL is 160 µg OA eq. per kg of shellfish flesh. The RL is dependent on the shellfish species tested and is set at 16 µg OA eq./kg for common mussels. For azaspiracids, the MPL is 160 µg AZA eq./kg, with a RL of 16 µg AZA eq./kg for all shellfish species. Yessotoxins have a regulatory limit of 3.75 mg YTX eq./kg shellfish, with a RL of 0.1 mg YTX eq./kg (Dhanji-Rapkova et al., 2019).
Seawater samples (500 ml) were collected using either a PVC sampling tube or a bucket, depending on the sampling location, and the contents preserved with Lugol’s iodine fixative on site. At the laboratory, a sub-sample (typically 50 ml) was “settled” to allow phytoplankton cells to sink onto the base plate of a settling chamber. Potentially toxic genera/species were then identified and enumerated by light microscopy. Phytoplankton analysis of seawater samples occurs weekly from March through to September, fortnightly in October, and then monthly over the winter at selected sites when overall abundance of phytoplankton in the water column is low. Phytoplankton sampling frequency in March was increased in 2013, and the number of monitoring sites set at 40 from 2014. The exact location of these sites may vary throughout the year, depending on the harvesting activity.
Both shellfish and seawater samples are tested using methods accredited to ISO17025 standard by the United Kingdom Accreditation Service (UKAS).
Results
Amnesic shellfish toxins were most prevalent between May and September, coinciding with blooms of Pseudo-nitzschia in the plankton. Between 2010 and 2018, six harvesting sites were closed due to elevated levels of these toxins in shellfish. The highest reported concentration was almost two and a half times the regulatory limit (the allowable amount) and was found in mussels from the Clyde in May 2016. Amnesic shellfish toxins above the regulatory limit were also found in mussels from Argyll in August 2012, cockles from the Outer Hebrides in August 2013, and razor clams collected from both the Outer Hebrides and the Clyde in June 2016. Toxin concentrations varied considerably between years and both frequency of occurrence and intensity were relatively low in 2015 and 2018.

Figure 2: Number of shellfish samples in each year when the main biotoxin groups exceeded maximum permitted levels. AST = Amnesic Shellfish Toxins; PST = Paralytic Shellfish Toxins; DST = Diarrhetic Shellfish Toxins.
Paralytic shellfish toxins were present between March and September, coinciding with Alexandrium detected in coastal waters from early spring into late summer. Raised levels of toxins resulted in the closure of sites on sixty-three occasions between 2010 and 2018. Exceptionally high toxin concentrations were recorded in mussels from the Clyde in April 2015, with the highest being almost thirty-five times the regulatory limit. High concentrations were also observed in mussels from other sites in the Clyde in June 2014, May 2015 and April 2016. Fifteen sites around the Clyde, Argyll, the West Highlands, and the Outer Hebrides were closed in 2015. In contrast, no harvesting sites were closed as a result of paralytic shellfish toxins in 2010, and only two sites were affected in 2016, both in the Clyde area.
Toxins associated with diarrhetic shellfish poisoning were present in shellfish in every month of the year, but most of the occurrences above the regulatory limit were between June and September. Between 2010 and 2018, 286 sites were affected, with some sites being closed on more than one occasion within the same year. One such harvesting ban in 2012 at a mussel site in the Clyde lasted for 28 weeks. Forty-one harvesting sites were closed in 2013 as a result of diarrhetic shellfish toxins, and thirty-five sites were closed in 2018. By comparison, in 2017 only fifteen sites were affected. A high toxin concentration of over 43 times the regulatory limit was recorded in mussels from the Shetland Isles in July 2013. This was linked to seventy reported cases of diarrhetic shellfish poisoning. Dinophysis bloomed most frequently between June and August, and was especially abundant in 2013 and 2018, with some dense blooms observed in the Clyde, the West Highlands, and the Shetland Isles between 2016 and 2018. Toxins produced by other organisms (Azadinium and Amphidoma) were at their highest in late summer and autumn, with periods of shellfish contamination through the winter, particularly in 2011, 2012 and 2013.
Amnesic Shellfish Toxins
Between 2010 and 2018, a total of 11,728 bivalve shellfish samples obtained from classified production areas were tested for the presence of amnesic shellfish toxins (ASTs). The majority of tests (67%) were carried out on common mussels (Mytilus species).
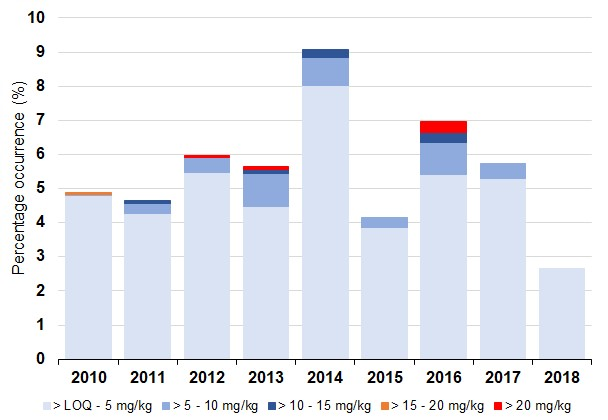
Figure d: Percentage occurrence of amnesic shellfish toxins present for all shellfish species by year. Source: FSS
The overall proportion of shellfish in which ASTs were detected above the Limit of Quantitation was relatively low, at 5.6% of all the samples tested between 2010 and 2018 (Figure d). Toxins were most prevalent between May and September, coinciding with elevated levels of Pseudo-nitzschia in the plankton. The maximum permitted toxin level was exceeded on six occasions between 2010 and 2018. The highest reported concentration of 49 mg/kg was found in mussels from the Clyde in May 2016. Amnesic shellfish toxins above regulatory limits were also found in mussels from Argyll in August 2012, cockles from the Outer Hebrides in August 2013, and razor clams collected from both the Outer Hebrides and the Clyde in June 2016. Toxin concentrations varied considerably between years and both frequency of occurrence and concentrations were relatively low in 2015 and 2018. Diatoms belonging to the genus Pseudo-nitzschia were present in the water column throughout the year. Cell abundance increased in spring and blooms exceeded the Scottish threshold of 50,000 cells/L from early March until late October, but typically occurred most often between June and September. Maximum Pseudo-nitzschia bloom density was also variable between years, with cell counts exceeding three million cells/L in the Shetland Isles (July 2010) and the West Highlands (April 2014).
Paralytic Shellfish Toxins
A total of 16,478 bivalve shellfish samples obtained from classified production areas between 2010 and 2018 were analysed for the presence of paralytic shellfish toxins (PSTs). Most tests (70%) were performed on common mussels.

Figure e: Percentage occurrence of paralytic shellfish toxins present for all shellfish species by year. Source: FSS.
Between 2010 and 2018, paralytic shellfish toxins (PSTs) were detected in 410 shellfish samples (2.5%) (Figure e). Toxins were present between March and September, exceeding the maximum permitted level between April and August on 168 occasions (1.0% of samples). Most of these events affected sites in the Clyde, Argyll, and the West Highlands, particularly between April to July. Some exceptionally high concentrations of PSTs were recorded during this period, with the highest concentration being 27,822 µg STX eq./kg in a mussel sample collected from the Clyde in April 2015, almost thirty-five times the regulatory limit. High concentrations were also observed in mussels from other sites in the Clyde in June 2014, May 2015 and April 2016. Fifteen sites around the Clyde, Argyll, the West Highlands, and the Outer Hebrides were closed in 2015. In contrast, no harvesting sites were closed as a result of PSTs in 2010, and only two sites were affected in 2016, both in the Clyde area. Dinoflagellates belonging to the genus Alexandrium were present in the water column throughout the year, with cell abundance increasing from early spring. Blooms were frequently observed between April and August and the threshold of 40 cells/L was exceeded in 23.9% of seawater samples analysed between 2010 and 2018.
Diarrhetic Shellfish Toxins
Okadaic acid group
Between 2010 and 2018, a total of 23,320 bivalve shellfish samples obtained from classified production areas were tested for the presence of diarrhetic shellfish toxins (DSTs). The test method was changed in July 2011, enabling the quantification of specific toxin groups. Prior to this, qualitative bioassay results were reported as either positive or negative. Bioassays were continued for surf clam samples into 2012. Diarrhetic shellfish toxins include the okadaic acid group (okadaic acid and dinophysistoxins) and this group is related to the presence of Dinophysis, Phalacroma and Prorocentrum lima in the plankton. The majority of tests (71.8%) were performed on common mussels.

Figure f: Percentage occurrence of diarrhetic shellfish toxins (bioassay/okadaic acid group) present for all shellfish species by year. Source: FSS.
In 2010 and 2011, out of 3,567 shellfish samples tested by bioassay, a total of 203 samples (5.7%) returned a positive result (Figure f). Okadaic acid (OA) group toxins were present in 5,960 (30.2%) of the 19,743 samples tested between 2011 and 2018, with the MPL exceeded on 1,372 occasions (6.9%). Toxins were present in shellfish in every month of the year, but most of the occurrences above the regulatory limit were between June and September. Thirty-nine harvesting sites were closed in 2013 as a result of diarrhetic shellfish toxins, and thirty-five sites were closed in 2018. The maximum concentration was 6,950 µg OA eq./kg, recorded in mussels from the Shetland Isles in July 2013. By comparison, in 2017 only fifteen sites were closed. Dinophysis bloomed most frequently between June and August, and the proportion of samples exceeding threshold was highest in 2013 and 2018, with some dense blooms observed in the Clyde, the West Highlands, and the Shetland Isles between 2016 and 2018. Between 2010 and 2018, annual maximum bloom densities for Prorocentrum lima were typically below 2,000 cells/L. Changes in sampling location (from open water to piers) at two Shetland Isles sites in 2018 saw an increase in abundance of Prorocentrum lima, with a maximum cell count of 12,080 cells/L recorded in July 2018. However, planktonic cell counts do not reflect the availability of Prorocentrum lima for consumption by shellfish, and it is not clear how much of a contribution it makes to the accumulation of diarrhetic shellfish toxins.
Azaspiracids
Azaspiracids are also associated with diarrhetic shellfish poisoning. These toxins are produced by dinoflagellate species belonging to the genera Azadinium and Amphidoma, but due to their small size and difficulty in discriminating from other non-toxic genera, they are not routinely monitored by light microscopy. Since July 2011, the change in method used for detecting lipophilic toxins has enabled the quantitation of the azaspiracid toxin group (Dhanji-Rapkova et al., 2019).

Figure g: Percentage occurrence of azaspiracid toxins present for all shellfish species by year. Source: FSS.
Between 2011 and 2018, a total of 19,743 shellfish samples were analysed for the presence of azaspiracid toxins. They were detected in a total of 608 shellfish samples (3.1%), with 44 samples (0.2%) exceeding the MPL (Figure g). Toxins were reported at sites around the Outer Hebrides, Argyll, the West Highlands, the Forth and Tay, the Orkney Islands, and the Shetland Isles. Azaspiracids exceeding the regulatory limit were only reported in 2011, 2012 and 2013, and toxin concentrations were at their highest in late summer and autumn, with prolonged periods of contamination through the winter. The highest reported concentration of 626 µg AZA eq./kg was found in mussels from the Shetland Isles in October 2011. Toxins below regulatory limit were occasionally detected in subsequent years, although absent in 2015.
Yessotoxins
Compared to other lipophilic toxins, yessotoxins (YTXs) were not particularly prevalent in Scottish shellfish. They were detected in 414 samples (2.1%) out of 19,743 tested and found in every month (Figure h). No samples exceeded the MPL of 3.75 mg YTX eq./kg and only ten samples recorded YTXs above 1.8 mg YTX eq./kg, with these events all occurring in the Clyde during June (2012, 2014 and 2016) and July (2012 and 2014). They were recorded most frequently in southwest Scotland, but also occurred further north in the Outer Hebrides and in the Shetland Isles, with toxins persisting for extended periods, often for several weeks or months (Dhanji-Rapkova et al., 2019).
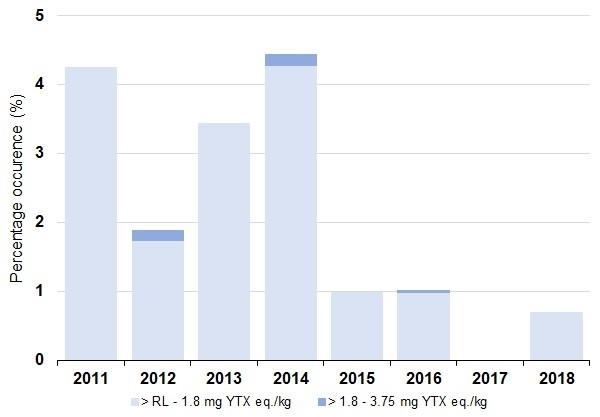
Figure h: Percentage occurrence of yessotoxins present for all shellfish species by year. Source: FSS.
Two dinoflagellate species linked to YTX production are monitored within the phytoplankton programme, although neither were particularly abundant and their appearance in the water column was sporadic. Protoceratium reticulatum was identified in 415 samples (4.0%) between February and September, most frequently in samples from Argyll, the Clyde, the West Highlands, and occasionally the Shetland Isles. Lingulodinium polyedra was recorded less often, occurring in only 89 samples (0.85%) and generally most abundant in August and September particularly around Argyll.
Other harmful species
The ‘red tide’ dinoflagellate Karenia mikimotoi was observed in the water column in every month of the year and was generally most abundant between July and September. Cell counts were very variable between years and cell densities did not exceed 2,000 cells/L in 2014, 2015, 2017 and 2018. A bloom of over one million cells/L was recorded in the Shetland Isles in August 2010, but the Clyde area was most affected in July and August 2016. The Scottish Environmental Protection Agency recorded a Karenia mikimotoi bloom of over thirty-five million cells/L, which was associated with mass mortality of marine organisms (Baptie, & Swan, 2017). Prior to 2010, the last Karenia mikimotoi bloom of any note occurred in the Clyde area in 2009
Conclusion
The marine algae, Pseudo-nitzschia, is found in coastal waters all year round, but only blooms when environmental conditions become favourable. Pseudo-nitzschia does not always produce biotoxins, and the amount of toxin contained within each individual algal cell is variable. Contamination of shellfish with amnesic shellfish toxins was usually preceded by, or coincided with, an increase in Pseudo-nitzschia blooms, but rarely resulted in the closure of harvesting sites.
Similarly, Alexandrium does not always produce paralytic shellfish toxins, but shellfish harvesting sites were closed in most years when toxin concentrations reached high levels. Due to the formation of Alexandrium cyst beds, contamination of shellfish tends to occur at the same locations every year.
Toxins that cause diarrhetic shellfish poisoning were almost always associated with increased levels of Dinophysis, and dense blooms were occasionally observed. Sometimes it took several months for the shellfish to eliminate the toxins and become safe to eat again. Diarrhetic shellfish toxins produced by other algae were found between 2011 and 2013 but have only been detected at low concentrations since then.
Some exceptional biotoxin events between 2010 and 2018 highlight the importance of the regulatory biotoxin and phytoplankton monitoring programmes to protect both human health and the rural economy.
In 2009, amnesic shellfish toxins were detected in 74 samples (4.1%), with a reported maximum concentration of 13 mg/kg. Between 2010 and 2018, the proportion of samples per year in which ASTs were detected varied between a high value of 9.1% in 2014 to a low value of 2.6% in 2018, with maximum permitted levels of toxin exceeded in 2012, 2013 and 2016. Toxin contamination was usually preceded by, or coincided with, an increase in Pseudo-nitzschia blooms. The frequency of blooms and the Pseudo-nitzschia cell abundance do not in themselves directly relate to the concentration of ASTs detected in shellfish (Rowland-Pilgrim et al., 2019). Both toxic and non-toxic species occur within the genus Pseudo-nitzschia and toxin production is not continuous (Fehling et al., 2004; Bresnan et al., 2017). Toxin content per cell is also variable, depending on species. Typically, blooms occurring in summer and autumn tend to contain a greater proportion of the more toxic Pseudo-nitzschia species, and the risk of shellfish contamination is therefore higher during this time. There was no evidence of either an increasing or decreasing trend since the previous assessment, although analysis over a longer period is required to draw any further conclusions.
In 2009, paralytic shellfish toxins were detected in 32 samples (1.3%), with five of those samples containing PSTs above regulatory limit, and a maximum reported concentration of 1,090 µg STX eq./kg in a mussel sample from the Clyde. Between 2010 and 2018, the proportion of samples per year in which PSTs were detected ranged from 0.49% in 2010 to 4.8% in 2013. Maximum permitted levels of PSTs were exceeded in every year except 2010, with some exceptionally high concentrations detected in mussels from the Clyde between June 2014 and April 2016. Alexandrium blooms were not always accompanied by an increase in PSTs, as both toxic and non-toxic species co-occur (Touzet et al., 2010). Due to the formation of Alexandrium cyst beds and the subsequent re-emergence of vegetative cells when conditions are more suitable (Lewis et al., 2018), contamination of shellfish with PSTs tends to occur at the same locations every year. However, local processes will determine the magnitude of events and not all will result in site closures.
A change in the testing method occurred for the lipophilic toxins in July 2011, allowing the quantification of specific toxin groups. The bioassay previously used had reported qualitative results as either positive or negative, but did not discriminate between the okadaic acid (OA) group, the azaspiracids and the yessotoxins. The first two toxin groups are known to cause diarrhetic shellfish poisoning, but the effect of yessotoxins in humans is uncertain. In 2009, 100 shellfish samples (4.3%) tested positive for the presence of lipophilic toxins. In 2010/2011, 203 samples (5.7%) returned a positive bioassay result. Since then, the proportion of samples per year in which OA group toxins were detected above the regulatory limit has varied between a high value of 13.7% in 2018 to a low value of 2.2% in 2017. Dinophysis blooms were widespread around the Shetland Isles in 2013 during a diarrhetic shellfish poisoning incident, which led to prolonged site closures. Cells accumulated rapidly as a result of wind-driven advection from offshore, reaching a maximum of 7,620 cells/L in July 2013 (Whyte, Swan, & Davidson, 2014) and remaining above threshold levels for several weeks. In 2015 and 2016, the Clyde, Argyll, and the West Highlands were affected by site closures of up to several months in duration. An atypical bloom of Dinophysis acuta was observed in the Clyde in 2015, which resulted in a change to the okadaic acid toxin group profile in shellfish tissue (Paterson et al., 2017; Swan et al., 2018). Sites around the Shetland Isles were also subject to closure in July and August 2016. The presence of OA group toxins in shellfish was almost always preceded by, or coincided with, elevated levels of Dinophysis in the plankton.
As the routine quantification of azaspiracids in shellfish has only occurred since July 2011, it was not possible to make any comparison with the previous assessment. Toxins exceeding the regulatory limit were reported in 44 samples, mostly in 2011, with further events in 2012 and 2013, and concentrations were at their highest in late summer and autumn. Toxins at lower concentrations were occasionally detected in subsequent years, but not at all in 2015.
Biotoxins may accumulate in shellfish over an extended period, or the response may be fairly rapid, depending on both the biotoxin involved and the shellfish species. Phytoplankton threshold levels can be used to indicate the potential for a toxic event.
Knowledge gaps
Not all shellfish harvesting sites were monitored for both biotoxins and phytoplankton. Where this was the case, and the frequency of routine biotoxin testing was less than weekly, the lack of phytoplankton counts may have led to toxin events being missed, as no additional biotoxin tests were scheduled. When sites were subject to closure due to the presence of toxins above regulatory limits, testing was not performed for other toxin groups, even when the phytoplankton results indicated an increased risk. Hence, the occurrence of amnesic and paralytic shellfish toxins may have been underestimated, due to extended site closures for diarrhetic shellfish toxins.
Harvesting site closures due to the presence of diarrhetic shellfish toxins usually occur between June and September. Alexandrium blooms tend to happen between April and August, often coinciding with these site closures, so the presence of paralytic toxins in shellfish is likely to be underestimated. Similarly, autumnal blooms of toxic Pseudo-nitzschia species may not lead to additional testing for ASTs. However, shellfish samples must return biotoxin results below maximum permitted levels for all the main toxin groups before sites can open.
One phytoplankton sample is collected at the monitoring point and this is sub-sampled and analysed in the laboratory. It is assumed that the sample is representative of the surrounding seawater, although phytoplankton blooms can be patchy and may form thin layers. Species may therefore be under-represented in the reported cell counts. This is likely to be the case for the benthic dinoflagellate Prorocentrum lima, as this species is rarely abundant in the water column. Environmental information that could be used to inform bloom dynamics is not available at the monitoring points. Water temperature could reveal stratification, and wind direction and speed at the monitoring point could indicate the potential for onshore advection of blooms.
Status and trend assessment
Due to high variability in both the presence of potentially toxic phytoplankton above threshold level, and the frequency and intensity of biotoxin events between 2010 and 2018, it is not possible to identify any discernible trend regarding on overall increase or decline in the toxin contamination of shellfish.
This Legend block contains the key for the status and trend assessment, the confidence assessment and the assessment regions (SMRs and OMRs or other regions used). More information on the various regions used in SMA2020 is available on the Assessment processes and methods page.
Status and trend assessment
|
Status assessment
(for Clean and safe, Healthy and biologically diverse assessments)
|
Trend assessment
(for Clean and safe, Healthy and biologically diverse and Productive assessments)
|
||
|---|---|---|---|
 |
Many concerns |
No / little change |
|
 |
Some concerns |
Increasing |
|
 |
Few or no concerns |
Decreasing |
|
 |
Few or no concerns, but some local concerns |
No trend discernible |
|
 |
Few or no concerns, but many local concerns |
All trends | |
 |
Some concerns, but many local concerns |
||
 |
Lack of evidence / robust assessment criteria |
||
| Lack of regional evidence / robust assessment criteria, but no or few concerns for some local areas | |||
 |
Lack of regional evidence / robust assessment criteria, but some concerns for some local areas | ||
| Lack of regional evidence / robust assessment criteria, but many concerns for some local areas | |||
Confidence assessment
|
Symbol |
Confidence rating |
|---|---|
|
Low |
|
|
Medium |
|
|
High |

Assessment regions
 and the Scottish Offshore Marine Regions (OMRs, O1 – O10)")
Key: S1, Forth and Tay; S2, North East; S3, Moray Firth; S4 Orkney Islands, S5, Shetland Isles; S6, North Coast; S7, West Highlands; S8, Outer Hebrides; S9, Argyll; S10, Clyde; S11, Solway; O1, Long Forties, O2, Fladen and Moray Firth Offshore; O3, East Shetland Shelf; O4, North and West Shetland Shelf; O5, Faroe-Shetland Channel; O6, North Scotland Shelf; O7, Hebrides Shelf; O8, Bailey; O9, Rockall; O10, Hatton.
 Regions. These have been used as the assessment areas for hazardous substances.")
, Regions.")