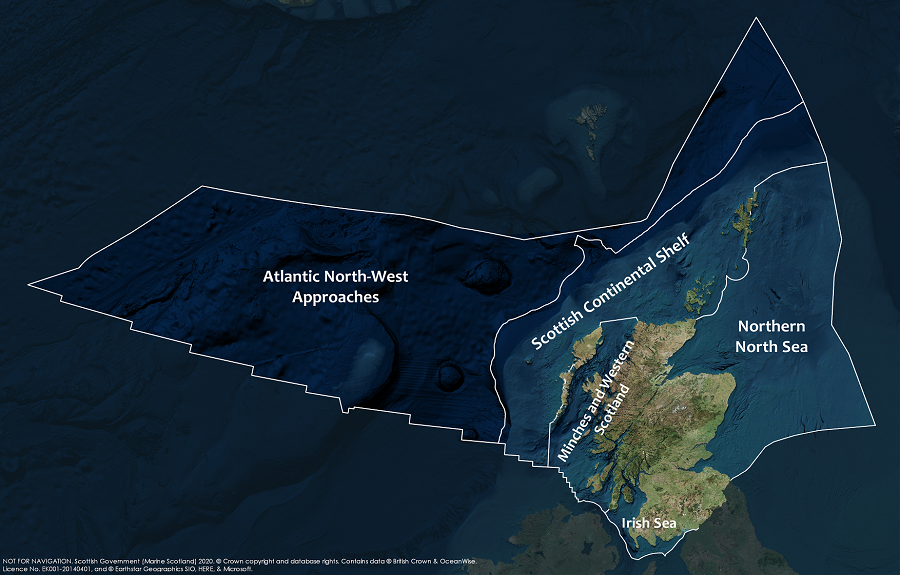
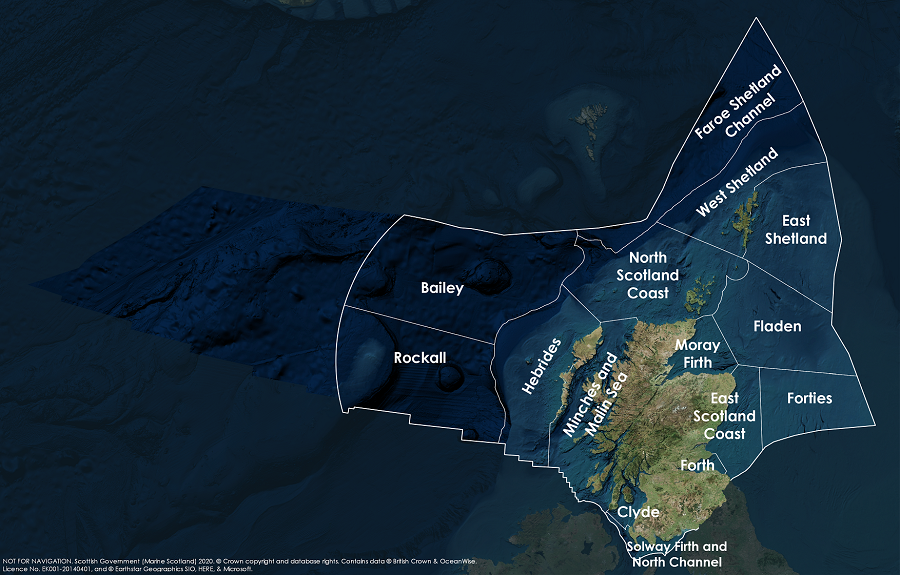
Background
Scotland has 83 designated coastal bathing waters where the Scottish Environment Protection Agency (SEPA) monitor water quality from 15 May to 15 September in accordance with the EU Bathing Water Directive (2006/7/EC) and the Bathing Waters (Scotland) Regulations 2008.
The directive states that a bathing water is one where a large number of people are expected to bathe and a permanent bathing prohibition, or permanent advice against bathing, has not been issued. Generally, a ‘large’ number of bathers (150 or so people) will be found at popular, well-used beaches and lakes where bathing is encouraged and facilities for bathers may have been provided.
The general water quality condition for each location is described by a classification statement – excellent, good, sufficient and poor – based on four years of monitoring data. These classifications are calculated at the end of one season for display at the start of the following season.
SEPA monitor for Escherichia coli and intestinal enterococci, which inform the classification, and also for cyanobacterial (blue-green algae) blooms, macroalgae (seaweed), marine phytoplankton and other waste where action may be required.
In Scotland, the primary causes of poor bathing water quality are short episodes of pollution caused by the impact of heavy rainfall on the operation of sewerage assets, surface drains, field run-off and agricultural activity.
In 2015 SEPA reported for the first time against new Directive (2006/7/EC), which replaced Directive 76/160/EEC. This assessment therefore considers the classification of bathing waters from 2015 to 2018.
Most bathing waters are sampled 18 times during the season, with some geographically remote sites sampled 10 times. Sites that have consistently demonstrated excellent water quality are sampled five times a year. Therefore, as classifications are based on 4yr rolling dataset, most classifications are calculated from around 72 samples, for some locations 40 samples, and a few using a minimum of 20 samples. All analytical methods comply with QA and QC with UK comparison and standard methods as given in the EC Directive.
The classifications – excellent, good, sufficient and poor – are calculated using the two key mandatory microbial parameters measured; Escherichia coli (E coli) and intestinal enterococci (IE). These classifications are used directly for this assessment. The standards used for the classification are shows in Tables a and b.
|
Parameter
|
Excellent
|
Good
|
Sufficient
|
Poor
|
|
Intestinal enterococci (cfu/100ml)*
|
200 (95th percentile)
|
400 (95th percentile)
|
330 (90th percentile)
|
Worse than sufficient in the assessment period
|
|
Escherichia coli (cfu/100ml)*
|
500 (95th percentile)
|
1000 (95th percentile)
|
900 (90th percentile)
|
|
Parameter
|
Excellent
|
Good
|
Sufficient
|
Poor
|
|
Intestinal enterococci (cfu/100ml)*
|
100 (95th percentile)
|
200 (95th percentile)
|
185 (90th percentile)
|
Worse than sufficient in the assessment period
|
|
Escherichia coli (cfu/100ml)*
|
250 (95th percentile)
|
500 (95th percentile)
|
500 (90th percentile)
|
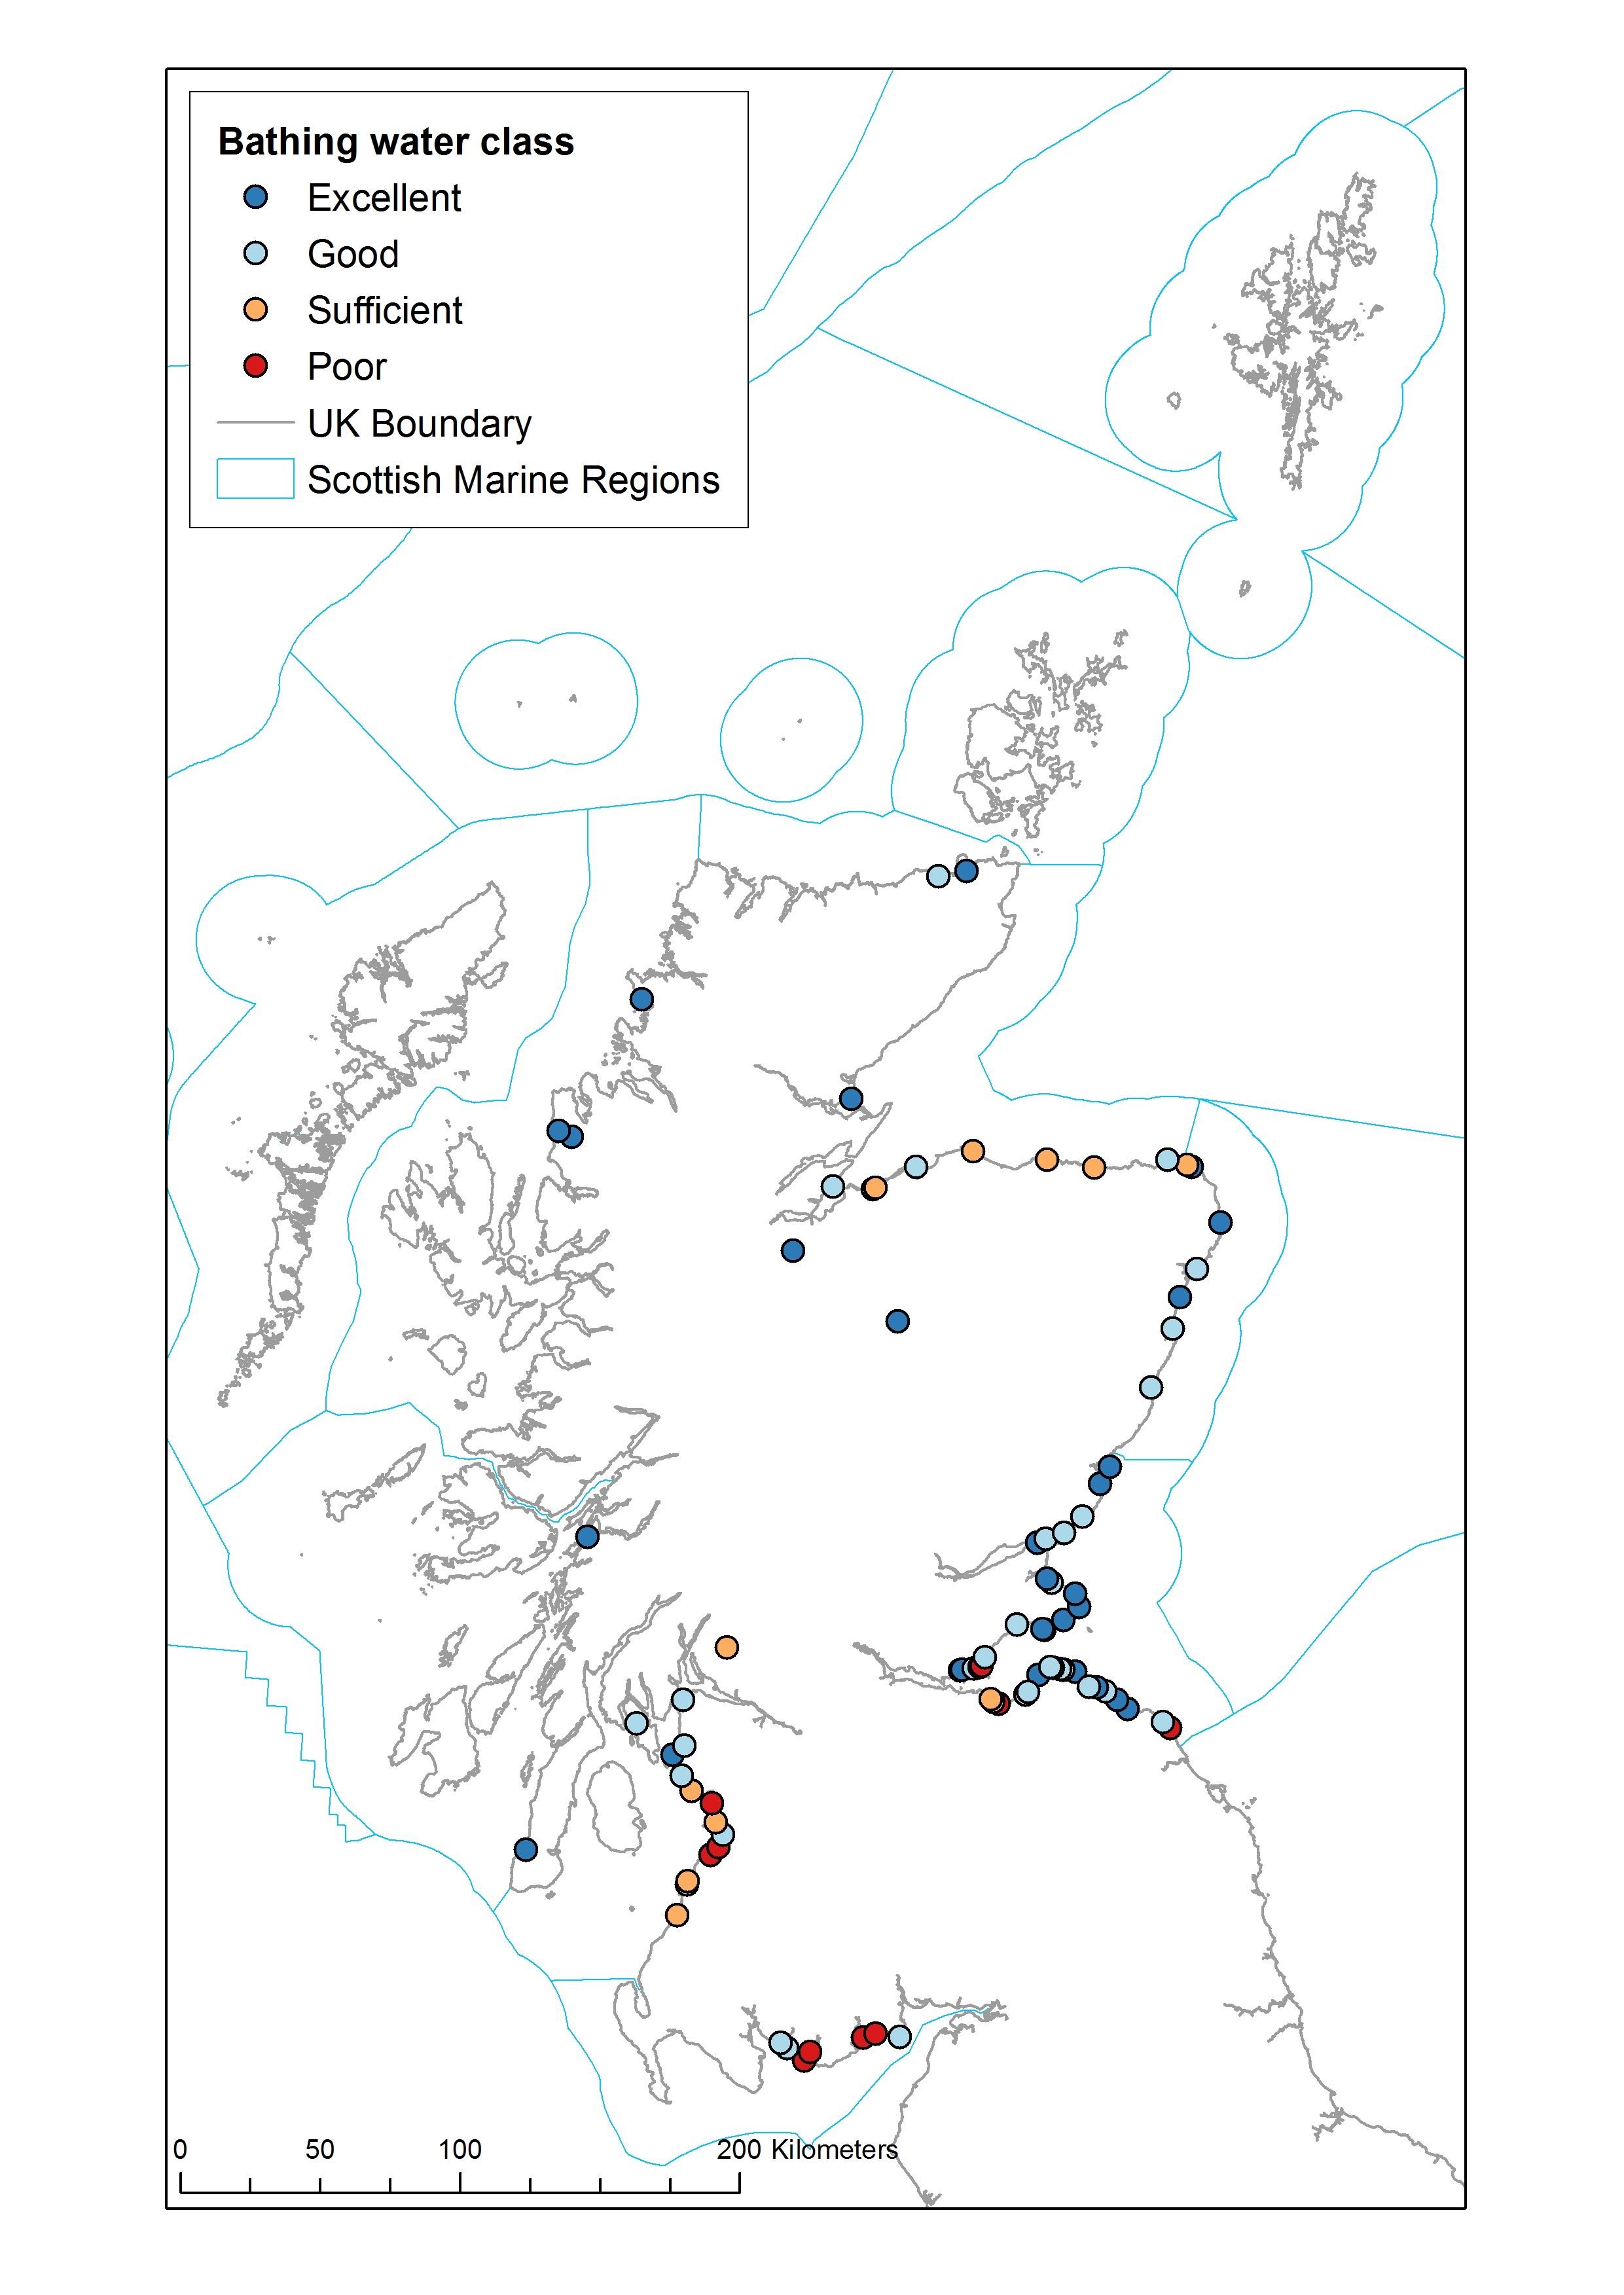
Bathing water classifications are only applied to the designated bathing water body and are not easily extrapolated to wider areas due to the highly localised nature of microbiological pollution. However, for the purposes of this assessment Scottish Marine Regions (SMRs) are flagged if they contain bathing waters that have a Poor designation in the latest available classification (2018).
The statutory test parameters indicate levels of overall faecal contamination (human and animal), which in turn indicate increasing risk of bathers being exposed to human health pathogens such as norovirus. The European health protective classification values are derived from multiple European and North American exposure trials and studies (WHO, 2003) in both coastal and freshwater environments.
Results
Since 2015 there has been an overall improvement in coastal bathing water quality, reflecting SEPA’s aim to bring all bathing waters to sufficient or better (Figure 1). This has largely been achieved by improved pollution control measures and investment to wastewater assets by the water industry and private operators, along with measures undertaken by farmers to reduce pollution risks from farm fields and compliance with new agricultural general binding rules (GBRs).
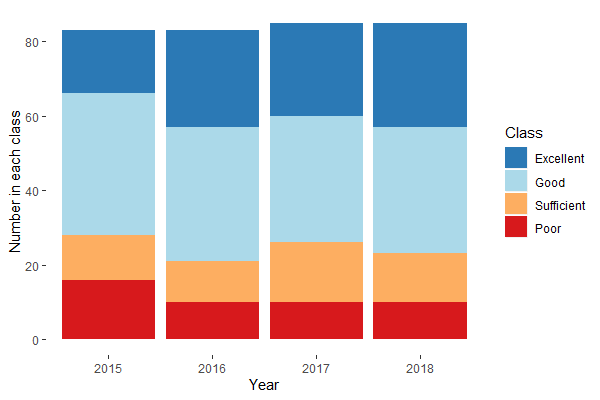
The number of coastal bathing waters with an excellent classification has increased from 16 in 2015 to 26 in 2018. The number with a poor classification has reduced from 17 to 10 over the same period. Further improvements are expected in 2019 and future years to reflect ongoing improvement work.
Detail on specific locations, trends and results are visualised and available for download on the Scotland's Environment website.
SEPA also provides daily water quality forecasts with live on-line beach signage for 30 well used bathing beaches in order to provide on the day advice to bathers and beach users. These can also provide information on any pollution warnings.
Coastal bathing waters are an integral part of Scottish Marine Regions (SMRs) (Figure 2). Of the 11 SMRs, only 8 contain designated bathing waters: Solway, Clyde, Argyll, West Highlands, North Coast, Moray, North East and Forth & Tay. Bathing water classifications are only applied to designated bathing water bodies due to the highly localised nature of microbial water pollution. It is therefore difficult to extrapolate classifications to the SMR scale.
Conclusion
Water quality at coastal bathing waters has shown a steadily improving picture since the new Directive was introduced in 2015. Although there are failing bathing waters in the Clyde, Solway, Forth & Tay SMRs, work is planned to bring all bathing waters up to the minimum sufficient classification.
Knowledge gaps
Bathing waters are selected for monitoring and classification when a ‘large’ number of bathers (usually 150 or more) use the waterbody. There are likely more waterbodies that are used by bathers but fall below the ‘large’ threshold for classification. There are limited data on the bathing water quality of these waterbodies.
Status and trend assessment
It has not been possible to conduct regional assessments for bathing waters due to the localised nature of bathing water classification. Subsequently, traffic light assessment was not possible either.
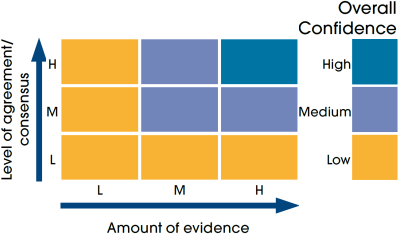
This Legend block contains the key for the status and trend assessment, the confidence assessment and the assessment regions (SMRs and OMRs or other regions used). More information on the various regions used in SMA2020 is available on the Assessment processes and methods page.
Status and trend assessment
|
Status assessment
(for Clean and safe, Healthy and biologically diverse assessments)
|
Trend assessment
(for Clean and safe, Healthy and biologically diverse and Productive assessments)
|
||
|---|---|---|---|
 |
Many concerns |
No / little change |
|
 |
Some concerns |
Increasing |
|
 |
Few or no concerns |
Decreasing |
|
 |
Few or no concerns, but some local concerns |
No trend discernible |
|
 |
Few or no concerns, but many local concerns |
All trends | |
 |
Some concerns, but many local concerns |
||
 |
Lack of evidence / robust assessment criteria |
||
| Lack of regional evidence / robust assessment criteria, but no or few concerns for some local areas | |||
 |
Lack of regional evidence / robust assessment criteria, but some concerns for some local areas | ||
| Lack of regional evidence / robust assessment criteria, but many concerns for some local areas | |||
Confidence assessment
|
Symbol |
Confidence rating |
|---|---|
|
Low |
|
|
Medium |
|
|
High |
Assessment regions
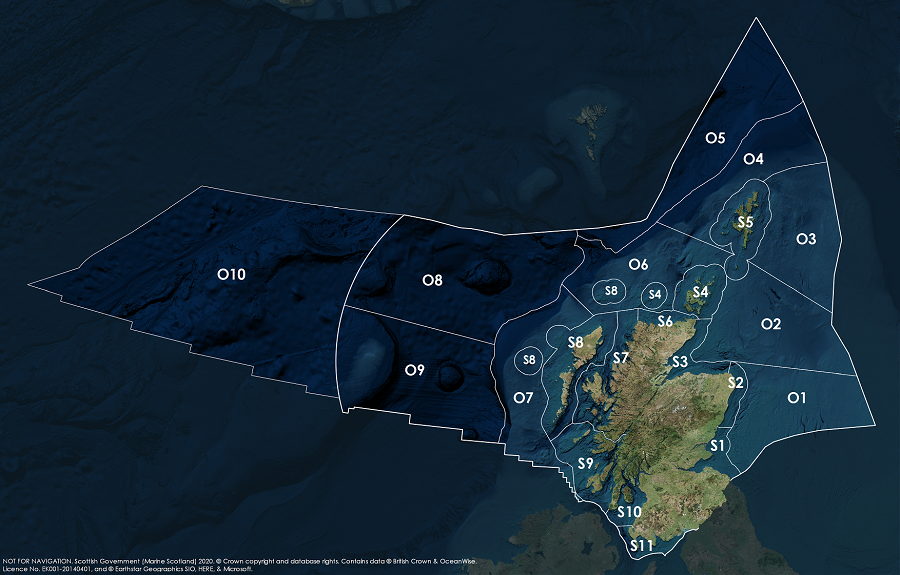
Key: S1, Forth and Tay; S2, North East; S3, Moray Firth; S4 Orkney Islands, S5, Shetland Isles; S6, North Coast; S7, West Highlands; S8, Outer Hebrides; S9, Argyll; S10, Clyde; S11, Solway; O1, Long Forties, O2, Fladen and Moray Firth Offshore; O3, East Shetland Shelf; O4, North and West Shetland Shelf; O5, Faroe-Shetland Channel; O6, North Scotland Shelf; O7, Hebrides Shelf; O8, Bailey; O9, Rockall; O10, Hatton.
