

Background
The amount of litter in the earth’s seas has increased substantially over recent decades and is of international concern. Litter appears in the sea and on beaches. This litter originates from human activities at sea and on land, with fishing, shipping, sewage outputs and the public all being major sources. Of particular concern are persistent plastics, which may float, remain in suspension, sink to the sea-floor, be cast up on beaches or be ingested by marine life. The predominant type of marine litter is plastic and polystyrene of various types, with a higher percentage of plastics and polystyrene in beach and floating litter as opposed to seabed litter. Plastic litter will take hundreds of years to degrade and therefore will accumulate in the environment. Litter can harm marine creatures, has economic consequences, and is a risk to human safety.
The density and type of litter found on beaches has been recorded by the Marine Conservation Society (MCS) since 1993. The Great British Beach Clean survey takes place annually (third weekend in September) and relies on volunteers to select and survey a beach. In addition, OSPAR reference beaches (Cramond and Kinghorn Harbour (Forth), Lunderston Bay (Clyde) and Mill Bay (Orkney)) are surveyed 4 times per year by MCS volunteers and staff. All these surveys use a standard method, agreed with OSPAR, to count the visible pieces of plastic and non-plastic litter on a beach, with these being put into one of 118 different categories. These 118 categorises were grouped to give the Scottish Beach Litter Performance Indicators (SBLPI) and both the OSPAR reference beach data and MCS data (2008-2017) are assessed by coastal sub-regions. The coastal sub-regions used were based on oceanographic processes that influence the deposition of beach litter (Figure 2).

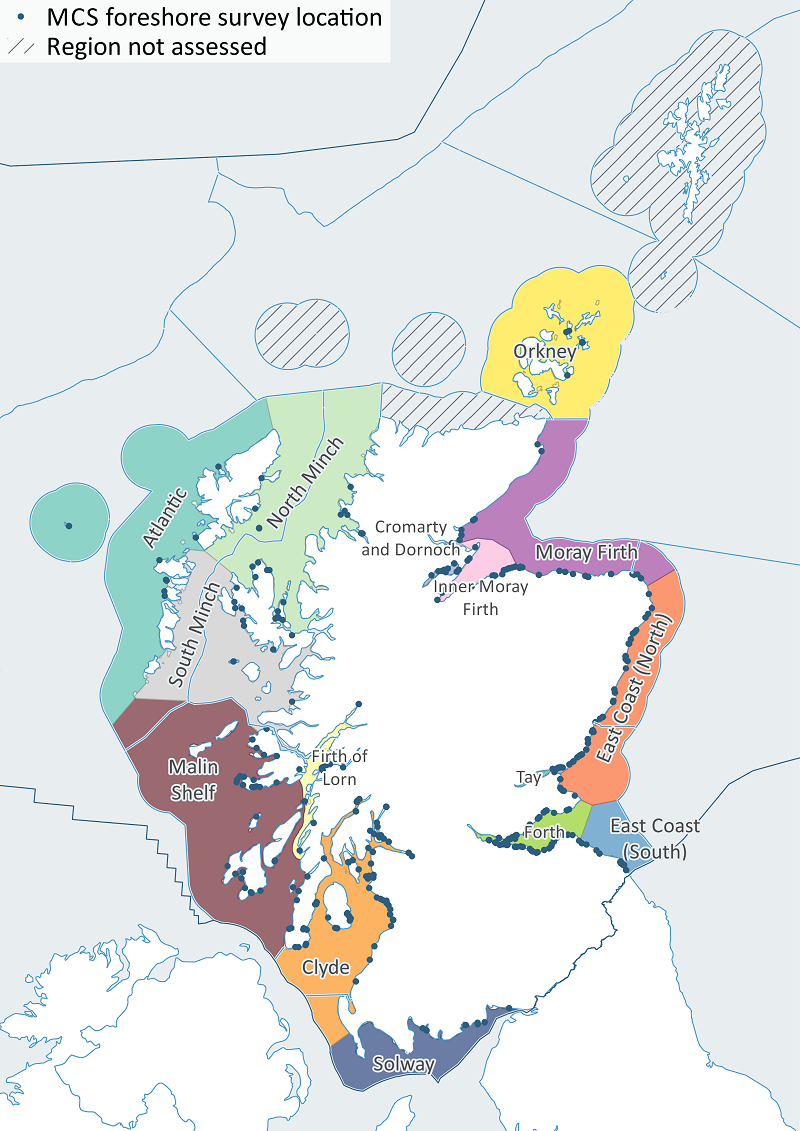
Figure 2: Map showing location of all Marine Conservation Society (MCS) foreshore surveys (point symbols), arranged in 15 sub-regions (indicated by different colours). There were sufficient data for an assessment of the Clyde, Orkney, Moray Firth, East Coast (North) and Forth (including Forth harbours).
Understanding beach litter in Scotland
In Scotland, tides, winds and coastal currents are very active. The combination of these results in some effects that alter the average loadings of litter on beaches. The oceanographic effects mean that average beach loadings increase up the west coast of Scotland, reset to a base value north of Scotland, and then increase again down the east coast (see Turrell, 2019b for full details).
The oceanographic processes are influenced by the direction of the prevailing wind relative to the beach in question, as well as by the nature of the water body the beach is located within. The technical analysis that supports the pilot indicators (Turrell, 2018; Turrell, 2019a) suggested that beaches within harbours, sea lochs, estuaries and embayments have different litter loadings than beaches lying along open coasts. For this reason, indicators have been estimated using surveys only from open coast foreshores.
Owing to the complex effect of natural processes, total beach loadings must be viewed in the context of where a particular beach lies along our coasts. The SBLPI look at trends within a sub-region of the coast rather than absolute values. They also use a relative scale that is the same for all litter categories and for all sub-regions (i.e. values normalised to have a mean of zero, and a standard deviation of one over the period 2008-2017).
The natural variability of the amount and composition of beach litter described above can result in large day to day, month to month, and even year to year, variations. The trends presented here are influenced not just by the size of the source of the items entering the sea, but also this natural variability.
Subsets of the 118 beach litter categories were grouped to create 25 Scottish Beach Litter Performance Indicators (SBLPI, Table a) that were used to assess the state of litter on beaches, as well as judge the success of policies in reducing sources of marine plastics and litter (Turrell, 2019a). Indicators were classed as: “Priority One” if they measured changes in litter items subject to current or developing Scottish Government policies and strategies; “Industry” if they related to litter items that might be traced back to specific marine industries; “Other” if none of the above. Using the MCS surveys, these pilot indicators were selected based on:
- Availability of data in the MCS/OSPAR beach survey databases;
- Relevance to industry sectors that the Scottish Government may influence through dialogue/legislation;
- Relevance to specific litter items that the Scottish Government may influence through policies/legislation/publicity campaigns;
- Relevance to specific litter items of concern to the Scottish public;
|
Group
|
Type
|
SBLPI
|
|---|---|---|
|
Priority One
|
Individual Items
|
Plastic – Bottles*
|
|
Plastic – Shopping Bags*
|
||
|
Plastic – Straws*
|
||
|
Sanitary – Cotton Buds
|
||
|
Sanitary – Wet Wipes
|
||
|
Paper – Coffee Cups*
|
||
|
Totals
|
All Plastic
|
|
|
All Sanitary
|
||
|
All Litter
|
||
|
Industry
|
Totals
|
Plastic – Fishing Related
|
|
Plastic – Marine Related
|
||
|
Plastic – Aquaculture Related
|
||
|
Plastic – Farm Related
|
||
|
Total – Angling Related
|
||
|
Total – Fishing Related
|
||
|
Total – Marine Related
|
||
|
Total – Old Plastic
|
||
|
Other
|
Individual Items
|
Metal – Drinks Cans
|
|
Plastic – Sweets/Crisps
|
||
|
Plastic – Cups
|
||
|
Plastic – Food Packaging
|
||
|
Paper – Smoking Related
|
||
|
Medical - Syringes
|
||
|
Plastic – 4/6 Pack Yokes
|
||
|
Rubber - Balloons
|
Subsets were grouped to give 25 Scottish Beach Litter Performance Indicators (SBLPI), which were used to assess the MCS beach litter surveys. Indicators marked by an asterix can include additional (but similar) litter items as well as the target item owing to the nature of the MCS survey recording protocols. Further details of what litter items are contained in each category and the corresponding OSPAR beach litter description can be found in Turrell (2019a).
There are two types of SBLPI: sub-totals that sum a range of litter categories together and specific items, which target individual marine litter items. Inclusion or exclusion of litter categories in the performance indicators that use sub-totals is somewhat arbitrary. For example, in the sub-total category “Marine Related”, which tries to capture litter from marine sources (shipping, offshore industries, fishing vessels) other than identifiable fishing gear, includes the litter category “8 Engine oil containers and drums <50 cm”. Obviously these could also come from land-based sources. However, a judgment has been made based on the likelihood of land versus marine sources.
An arbitrary number of 4 surveys per year was set as the minimum needed in any sub-region for that year to be valid, and a minimum of 5 valid years within the 10 year period for a sub-region to be included in the analysis. There were sufficient data for an assessment of the SBLPI for five of the fifteen coastal sub-regions (Figure 2); Clyde, Orkney, Moray Firth, East Coast (North) and Forth (including Forth harbours). There were insufficient surveys to estimate the SBLPI for Solway, Malin Shelf, Firth of Lorn, Atlantic, South Minch, North Minch, Inner Moray Firth, Cromarty/Dornoch, Firth of Tay and East Coast (South). There are no data for Shetland. The Da Voar Redd Up is Shetland’s annual beach clean but the data are recorded in a different way to that of the Marine Conservation Society therefore could not be used here.
Using the beach location (latitude and longitude), each beach was examined using the satellite images contained in Google maps. The location of each survey with respect to principal sea areas around Scotland’s coasts was determined, as was the nature of the surveyed foreshore. Foreshores were categorised as beaches, bays, sea lochs or harbours. A bay was defined as relatively short foreshores having semi-enclosing adjacent coastlines extending out to sea for distances approximately equal to or greater than the foreshore length itself. Sea lochs are glacially-cut fjords, and are well identified and named in Scotland. Harbours were defined as foreshores within industrial areas with man-made substrates and/or retaining structures.
The east coast of Scotland has a much simpler morphology than the west coast. Whereas the west coast has island chains, peninsulas and glacially-cut fjords, the east coast has no offshore islands of any size, and has linear coasts devoid of fjords.
While foreshores on the east coast predominantly face east, a few major embayments disrupt this general trend, specifically the Dornach, Cromarty, Tay and Forth Firths, and the inner Moray Firth (a firth in Scotland is a large embayment or channel, normally navigable in some way).
Foreshores on the west coast can face in any direction, owing to the complex topography. For this reason west coast beaches and bays had a further parameter added, determined from the satellite images, namely the direction they face (the exposure). A beach recorded as having an exposure to the SW would experience winds directed perpendicularly onshore for winds blowing from the south west. Initial analysis of the data showed that beaches and bays on the west coast, outside the Clyde sea area, predominantly faced westwards, with a minority facing east.
Water body types
For the purpose of this analysis, all data from harbours were excluded from regional assessments, except for Forth harbours which were included as an example of litter levels within harbours. Forth harbours were selected as they have the most available data. Other sites rejected were within river channels or at landward extremes of estuaries, where marine deposition of litter could be augmented by riverine sources. On the west coast, all surveys on foreshores with an exposure towards the north, northeast, east, southeast or south were excluded from the analysis as these are not representative of foreshores facing into the prevailing wind (Turrell, 2019b). These included many on the eastward, and hence sheltered, side of islands and peninsulas.
Results
The composition of beach litter in the five sub-regions is shown in Figure 3, and the trends over the last decade shown in Table 1 for the Priority One categories.
Harbours in the Firth of Forth have the highest total litter loading of any sub-region where SBLPIs have been calculated. They also have the highest proportion of sanitary items (nearly 50%), and this proportion is increasing at the fastest rate of any SBLPIs. All categories associated with industries are increasing.
The Clyde sub-region has the second highest average beach litter loading. The proportion of the total litter loading that is made up of sanitary items is the highest. The Clyde has the highest number of pilot SBLPIs showing increasing trends, particularly within sanitary items and those related to angling, fishing and shipping.
Orkney had the lowest average beach litter loadings. This may reveal the true “background” litter conditions in Scottish waters before other effects enhance litter concentrations. Local sources of non-plastic litter items are so low (i.e. wood, paper, cloth, glass, metal, sanitary and medical items) that plastic makes up by far the greatest proportion of Orkney’s beach litter, probably most originating outwith Orkney. Overall, beaches were relatively clean, with an overall improving trend.
Although indicators for the Moray Firth have been calculated, several years are missing owing to too few surveys being available. In general, most categories are showing decreasing trends, apart from those related to the marine industries of shipping and fishing, which are showing gradual increasing trends.
Apart from indicators associated with wet wipes, angling and smoking, most other categories suggest improving beach conditions in the East Coast (North). For some indicators, however, this may be partly caused by very high values estimated from 2008 surveys.
As with the Clyde, the Firth of Forth has a high proportion of sanitary items. However, the total beach litter loadings are not particularly high. This is most likely due to the effect of wind, tides and currents along the Scottish east coast. In general, apart from those associated with wet wipes and smoking waste, all pilot SBLPIs in the Firth of Forth are suggestive of static or improving litter conditions.
 with sufficient data, averaged for 2008 to 2017, and with 2017 also shown separately.")
|
Type
|
SBLI
|
Clyde
|
Orkney
|
Moray Firth
|
East Coast (North)
|
Forth
|
Forth (harbours)
|
|---|---|---|---|---|---|---|---|
|
Individual Items
|
Plastic – Bottles*
|
-1.5
|
-1.9
|
-1.9
|
-2
|
-1.8
|
-1.1
|
|
Plastic – Shopping Bags*
|
-2.5
|
-1.2
|
-1.9
|
-1.6
|
-1.6
|
0.1
|
|
|
Plastic – Straws*
|
1.1
|
RARE
|
-1.5
|
-1.9
|
-0.9
|
-2.9
|
|
|
Sanitary – Cotton Buds
|
1.7
|
RARE
|
-1.6
|
-1.2
|
-1.5
|
0.5
|
|
|
Sanitary – Wet Wipes
|
2.7
|
RARE
|
0.7
|
2.2
|
1.9
|
+2.9
|
|
|
Paper – Coffee Cups*
|
0.6
|
RARE
|
-1.8
|
-0.6
|
0.7
|
-0.7
|
|
|
Totals
|
All Plastic
|
0.1
|
-1.5
|
0.2
|
-1.6
|
-0.9
|
-1.4
|
|
All Sanitary
|
2
|
RARE
|
-0.4
|
-0.7
|
0.3
|
3
|
|
|
All Litter
|
0.6
|
-1.5
|
-1
|
-1.5
|
-0.1
|
1.2
|
|
|
Average Total Litter Loading (np/100 m)
|
670
|
40
|
320
|
250
|
341
|
1,600
|
|
|
|
Increasing by 2 or more standard deviations per decade
|
|
Increasing or decreasing by 0 to 1 standard deviations per decade
|
|
Decreasing by 1 or more standard deviations per decade
|
||
Trends over the last decade in the SBLPIs for industry related and other beach litter types are shown in Tables b and c. Most SBLPIs showed reduction or little change, except for industry related SBLPIs in Forth Harbours, angling related in the East Coast (North) and paper (smoking related) in the Forth and East Coast (North). A full assessment of the SBLPI and sub-regional trends for each indicator has previously been published (Turrell, 2019a), further details can be found here.
|
Type
|
SBLI
|
Clyde
|
Orkney
|
Moray Firth
|
East Coast (North)
|
Forth
|
Forth (harbours)
|
|---|---|---|---|---|---|---|---|
|
Individual Items
|
Plastic – Fishing Related
|
0.8
|
-1.2
|
1.6
|
0.3
|
-0.3
|
1.3
|
|
Plastic – Marine Related
|
1.8
|
-0.9
|
1.1
|
0.8
|
0.7
|
+2.2
|
|
|
Plastic – Aqua. Related
|
RARE
|
RARE
|
RARE
|
RARE
|
RARE
|
RARE
|
|
|
Plastic – Farm Related
|
RARE
|
RARE
|
RARE
|
RARE
|
RARE
|
RARE
|
|
|
Total – Angling Related
|
0.7
|
RARE
|
0.3
|
2.7
|
-0.6
|
1.8
|
|
|
Total – Fishing Related
|
0.8
|
-1.2
|
1.6
|
0.3
|
-0.3
|
1.3
|
|
|
Total – Marine Related
|
1.7
|
-0.9
|
1.1
|
0.8
|
0.7
|
2.2
|
|
|
Total – Old Plastic
|
-1.2
|
-1.4
|
0.2
|
-1.6
|
0.1
|
-1.8
|
|
|
|
Increasing by 2 or more standard deviations per decade
|
|
Increasing or decreasing by 0 to 1 standard deviations per decade
|
|
Decreasing by 1 or more standard deviations per decade
|
||
|
Type
|
SBLI
|
Clyde
|
Orkney
|
Moray Firth
|
East Coast (North)
|
Forth
|
Forth (harbours)
|
|---|---|---|---|---|---|---|---|
|
Individual Items
|
Metal – Drinks Cans
|
-1.7
|
-1.7
|
-0.9
|
-2.2
|
0.9
|
-1.6
|
|
Plastic – Sweets/Crisps
|
0.1
|
-1.7
|
-1.8
|
-0.6
|
-1.9
|
-0.9
|
|
|
Plastic – Cups (see p.4)
|
2.5
|
RARE
|
2.4
|
2.2
|
2.3
|
2.3
|
|
|
Plastic – Food Packaging
|
-1.8
|
RARE
|
-1.5
|
-2.1
|
-1.3
|
-1.1
|
|
|
Paper – Smoking Related
|
1.7
|
RARE
|
-2.3
|
2.6
|
+2.1
|
0.9
|
|
|
Medical – Syringes
|
0.4
|
RARE
|
RARE
|
-2.3
|
-1.1
|
0.8
|
|
|
Plastic – 4/6 Pack Yokes
|
-0.7
|
RARE
|
RARE
|
-0.1
|
-1.1
|
-0.4
|
|
|
Rubber – Balloons
|
-1
|
RARE
|
-1.2
|
-2.2
|
0.1
|
1.4
|
|
|
|
Increasing by 2 or more standard deviations per decade
|
|
Increasing or decreasing by 0 to 1 standard deviations per decade
|
|
Decreasing by 1 or more standard deviations per decade
|
||
Information on litter found on Scottish beaches from MCS survey data was presented in the Scotland’s Marine Atlas (Baxter et al., 2011), and showed that the main source of litter was from the public, and that plastic made up 70% of the total litter. However, the 2011 assessment did not look at beach litter by regions and did not use the Scottish Beach Litter Performance Indicator, which has been used for the first time in this assessment, hence no direct comparison can be made.
Scottish Marine Regions
Eleven Scottish Marine Regions (SMRs) were created by The Scottish Marine Regions Order 2015 which cover sea areas extending out to 12 nm. Regional assessments to support Regional Marine Plans are required to be developed for each SMR by the relevant Marine Planning Partnership.
SBLPI was calculated for specific sub-regions around the Scottish coast. Sub-regions were not based on SMRs owing to the scarcity of surveys in some of them. In addition, the coastal sub-regions used here have been based on oceanographic processes that influence the deposition of beach litter, and these processes also do not follow SMRs. However, the regions assessed can be assigned to an SMR (Table d), with data available for some but not all regions. Figure 2 also shows the relationship between SMRs and the regions used here.
|
Scottish Marine Region
|
SBLPI Coastal sub-region
|
|---|---|
|
Solway
|
Solway
|
|
Clyde
|
Clyde
|
|
Argyll
|
Firth of Lorn; Malin Shelf
|
|
West Highland
|
S Minch; N Minch
|
|
Outer Hebrides
|
Atlantic; S Minch; N Minch
|
|
North Coast
|
No Data
|
|
Orkney
|
Orkney
|
|
Shetland
|
No Data
|
|
Moray Firth
|
Moray Firth; Inner Moray Firth; Cromarty and Dornoch
|
|
North East
|
East Coast (North)
|
|
Forth and Tay
|
Tay; Forth; East Coast (N); East Coast (S)
|
Conclusion
Indicators of beach litter in Scotland reveal the general features around the coast arising from public littering, other land-based sources and marine-based sources. These indicators provide a context for management actions and strategy formulation.
The amount of litter was lowest in Orkney and highest in Forth (harbours). Total plastics showed significant decreases in Orkney, East Coast (North) and Forth (harbours), with plastic bags and plastic bottles decreasing in all areas assessed. The total amount of litter in Firth of Forth harbours was approximately five times higher than elsewhere. The proportion of sanitary items in the Clyde and Forth is (about ten times) higher than elsewhere, increasing in the Clyde and in Firth of Forth harbours. Wet wipes are increasing in the Clyde, Forth and East Coast North. Angling related debris is increasing on East Coast North. Smoking related debris is increasing on beaches on the East Coast North and in the Forth.
Knowledge gaps
Few beaches in remote areas are monitored for beach litter, particularly on the west and north coasts. In addition there are no data for Shetland. Beach litter surveys are infrequent surveys and therefore fail to describe average conditions well.
Status and trend assessment
|
Region assessed
|
Status with confidence
|
Trend with confidence
|
|---|---|---|
|
Clyde
|
 |
|
|
Orkney
|
|
|
|
Moray Firth
|
|
|
|
East Coast (North)
|
|
|
|
Forth (including Forth harbours)
|
|
|
This Legend block contains the key for the status and trend assessment, the confidence assessment and the assessment regions (SMRs and OMRs or other regions used). More information on the various regions used in SMA2020 is available on the Assessment processes and methods page.
Status and trend assessment
|
Status assessment
(for Clean and safe, Healthy and biologically diverse assessments)
|
Trend assessment
(for Clean and safe, Healthy and biologically diverse and Productive assessments)
|
||
|---|---|---|---|
 |
Many concerns |
No / little change |
|
 |
Some concerns |
Increasing |
|
 |
Few or no concerns |
Decreasing |
|
 |
Few or no concerns, but some local concerns |
No trend discernible |
|
 |
Few or no concerns, but many local concerns |
All trends | |
 |
Some concerns, but many local concerns |
||
| |
Lack of evidence / robust assessment criteria |
||
| Lack of regional evidence / robust assessment criteria, but no or few concerns for some local areas | |||
 |
Lack of regional evidence / robust assessment criteria, but some concerns for some local areas | ||
| Lack of regional evidence / robust assessment criteria, but many concerns for some local areas | |||
Confidence assessment
|
Symbol |
Confidence rating |
|---|---|
|
Low |
|
|
Medium |
|
|
High |

Assessment regions
 and the Scottish Offshore Marine Regions (OMRs, O1 – O10)")
Key: S1, Forth and Tay; S2, North East; S3, Moray Firth; S4 Orkney Islands, S5, Shetland Isles; S6, North Coast; S7, West Highlands; S8, Outer Hebrides; S9, Argyll; S10, Clyde; S11, Solway; O1, Long Forties, O2, Fladen and Moray Firth Offshore; O3, East Shetland Shelf; O4, North and West Shetland Shelf; O5, Faroe-Shetland Channel; O6, North Scotland Shelf; O7, Hebrides Shelf; O8, Bailey; O9, Rockall; O10, Hatton.
 Regions. These have been used as the assessment areas for hazardous substances.")
, Regions.")