
Background
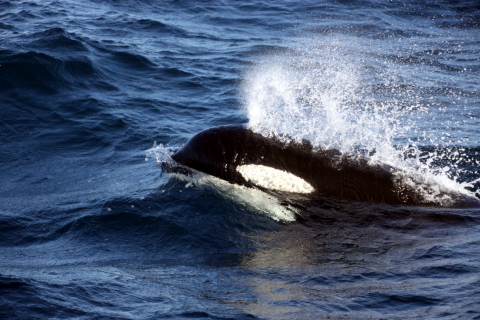
The North-East Atlantic Ocean is an important area for cetaceans. As top predators they can be sentinels of environmental status and food web integrity. They occur all around Scotland, but the greatest diversity is found off the continental shelf waters to the north and west. This assessment considers information on the abundance and distribution of the dominant (i.e. most abundant) species (for example minke whale (Figure 1) and white-beaked dolphin (Figure 2)) based on three systematic large-scale surveys carried out in European waters in 1994, 2005 and 2016 (SCANS, SCANS-II, and SCANS-III, (Hammond et al., 2017)), with the current assessment period being 2005 to 2016. These visual surveys were carried out using dedicated survey vessels following a planned survey route and statistically robust survey design, employing trained observers from duplicated observation platforms on the vessels. These ship-based surveys were supplemented with visual aerial surveys, which also followed planned routes using trained observers.
As cetaceans are highly mobile species, it is not possible to assess changes in the dominant species at a Scottish Marine Region scale, except for the coastal populations of bottlenose dolphin (Figure 3). The changes in abundance are therefore reported at a scale appropriate to such mobile animals, i.e. the European Continental Shelf which incorporates Scottish Waters.
Cetaceans are subject to a range of human pressures. Some of these pressures have been shown to have negative impacts at the individual level, ranging from increased stress and higher energetic costs, to sub-lethal effects on reproduction and immune function, and ultimately mortality. In more serious cases, effects may manifest at the population level.
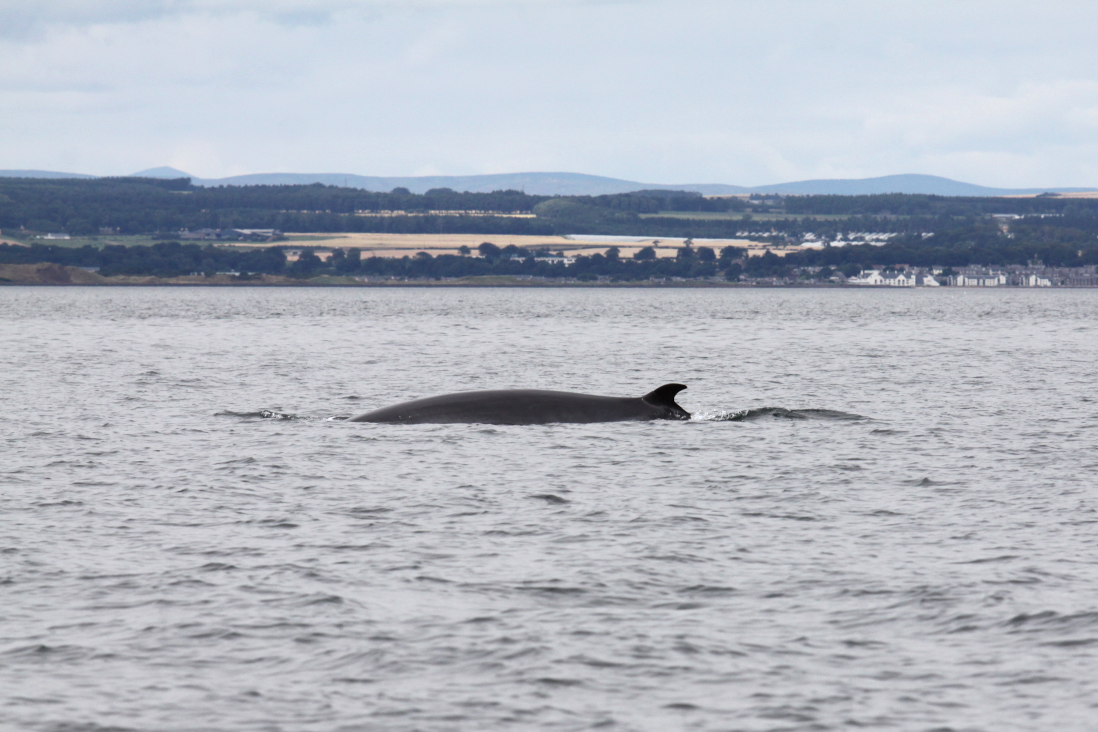
Figure 1: Minke whale © Mònica Arso Civil
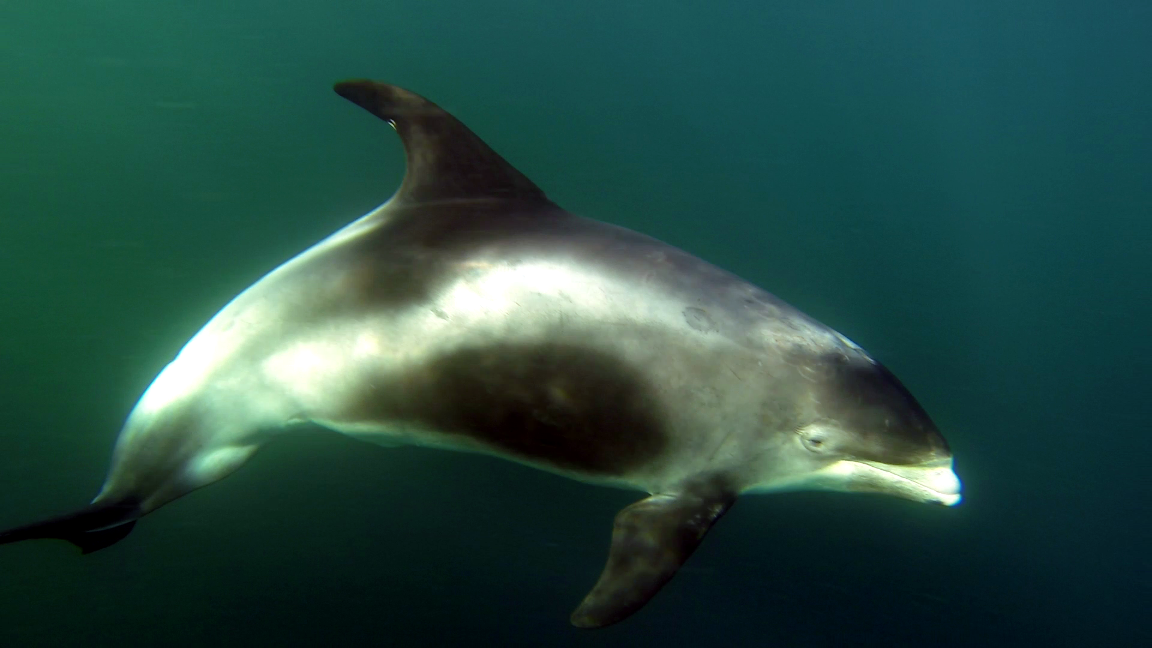
Figure 2: White-beaked dolphin © Ben Burville
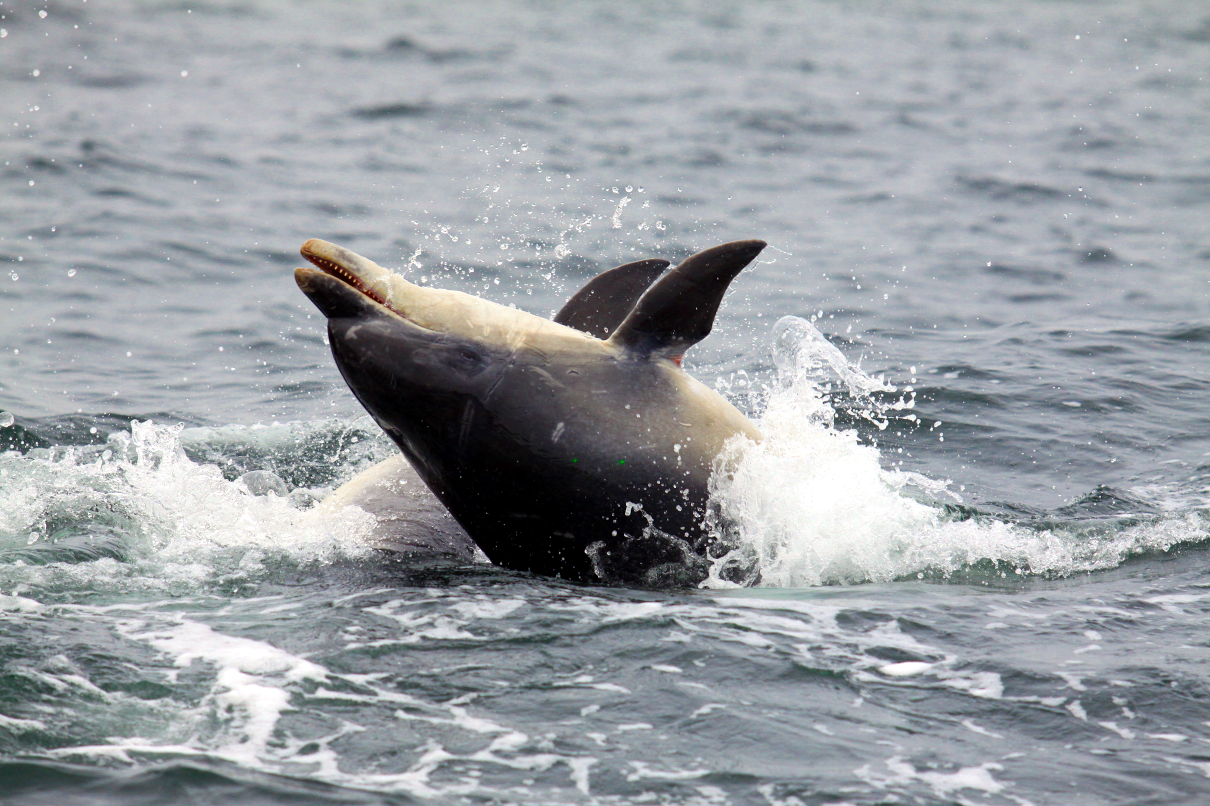
Figure 3: Bottlenose dolphin © Mònica Arso Civil
This assessment considers information on abundance and distribution and, where possible, assesses the status of the following species found regularly around Scotland: harbour porpoise, offshore bottlenose dolphin, white-beaked dolphin, short-beaked common dolphin, minke whale, fin whale, long-finned pilot whale, white-sided dolphin, sperm whale and beaked whales (the latter as a combined species group). All these species are also assessed under the Habitats Directive. In line with the OSPAR Intermediate Assessment (2017), coastal bottlenose dolphins are considered separately.
Some human activities affect the abundance and distribution of cetaceans. The range of human pressures includes incidental bycatch in fishing gear, collisions with ships, underwater noise generated by acoustic deterrent devices associated with aquaculture sites, naval, shipping or seismic activities, prey depletion caused by overfishing, habitat loss or degradation, pollution, marine debris, pressures related to offshore development of oil, gas and renewable energy, including habitat loss or collision risks associated with installations. Historically, direct removal of individuals by hunting had severe effects on populations (see also Case study: Scottish Marine Animal Stranding Scheme). Today, bycatch in fisheries is one of the major causes of mortality for small cetaceans. Other pressures, including chemical and noise pollution, such as underwater sonar, are known to affect individual animals, but their effects on populations are not well understood. Threats and pressures to the main species, as also summarised in the OSPAR Intermediate Assessment (2017) are shown in Table a.
| PRESSURE CATEGORY | Pressure | Harbour porpoise | Common dolphin | White beaked dolphin | Atlantic white sided dolphin | Risso's dolphin | Minke whale | Long finned pilot whale | |
| Pollution and other chemical changes | Contaminants | H | M | M | M | M | L | M | |
| Nutrient enrichment | L | L | L | L | L | L | L | ||
| Physical loss | Habitat loss | - | - | - | - | - | - | - | |
| Physical damage | Habitat degradation | L | L | L | L | L | L | L | |
| Other physical pressures | Litter (inc.plastics and discarded fishing gear) | L | L | L | L | L | M | L | |
| Underwater noise changes | Military Sonar | M | M | M | M | M | M | M | |
| Seismic surveys | M | M | M | M | M | M | M | ||
| Pile driving | M | M | M | M | M | M | M | ||
| Shipping | M | M | M | M | M | M | M | ||
| Barrier to species movement (offshore windfarm, wave or tidal device arrays) | L | L | L | L | L | L | L | ||
| Death or injury by collision | Death or injury by collision (with ships) | L | M | L | L | L | M | L | |
| Death or injury by collision (with tidal devices) | Risk of collision leading to death or injury is considered possible, but no evidence of such an occurrence to date | ||||||||
| Biological pressures | Introduction of microbial pathogens | L | L | L | L | L | L | L | |
| Removal of target and non-target species (prey depletion) | M | L | L | L | L | M | L | ||
| Exposure to toxins from harmful algal blooms | H | L | L | L | M | M | L | ||
| Removal of non-target species (bycatch) | H | M | L | L | L | M | L | ||
| Disturbance (e.g. wildlife watching) | L | L | L | L | L | L | L | ||
| Deliberate killing + hunting | Does not occur | - | - | - | - | - | - | ||
Abundance and distribution of offshore cetaceans
The following details are summarised from Hammond et al. (2017) where full details of the SCANS III survey methods can be found.
A series of large scale surveys for cetaceans in European Atlantic waters was initiated in 1994 in the North Sea and adjacent waters (Hammond et al., 2002; SCANS (1995)) and continued in 2005 in all shelf waters (Hammond et al., 2013; SCANS-II (2006)) and 2007 in offshore waters (CODA, 2009). In the mid-1990s, the primary need for a large-scale survey was to obtain the first comprehensive estimates of abundance of harbour porpoise in the North Sea and adjacent waters so that estimates of bycatch could be placed in a population context. The driver for the ongoing comprehensive and inclusive surveys is to provide the information on distribution and abundance of cetaceans for assessments (including the Habitats Directive and Marine Strategy Framework Directive (MSFD)).
It was the intention that these surveys be approximately decadal, and the most recent survey was scheduled for the mid-2010s, but sufficient resources were only secured in summer 2016. The supporting countries were: Denmark, France, Germany, the Netherlands, Norway, Portugal, Spain, Sweden and the UK. An independent project supported by Ireland, named ObSERVE, conducted surveys in Irish waters during the period 2015-2017 (Rogan et al., 2017).
Data collection
During all three surveys the methods used were largely the same, giving comparable data. In the SCANS-III survey, more sea area was surveyed by air than in previous years. Most importantly, all shelf waters including the North Sea were surveyed by air.
Aerial survey
Each aircraft contained three scientific crew members in addition to the pilot except one that had six, working in two independent teams. Target altitude was 600 feet (183 m) at a speed of 90 knots (167 km.h-1). Two observers sat at bubble windows on the left and right sides of the aircraft, and the third team member acted as navigator and data recorder for environmental and sightings data. Sighting conditions were classified subjectively but consistently as “good”, “moderate” or “poor” based primarily on sea conditions, water turbidity and glare. When detected groups of cetaceans came abeam, data were recorded on time, declination angle to the animal or group (from which perpendicular distance was calculated), cue, presence of calves, behaviour, species composition and group size. Further details of field protocol are given in Gilles, Scheidat & Siebert (2009). To collect data from which correction could be made for animals missed on the transect line, the circle-back or “racetrack” method of Hiby (1999) was used. In this approach, on detecting a group of animals, the aircraft circles back to resurvey a defined segment of transect. Abundance estimates from the sightings were calculated using the methods of Hiby & Lovell (1998) and Hammond et al. (2017).
Ship survey
The method used on ships was a double platform line transect survey with two independent teams of observers on each ship to generate data that would allow abundance estimates to be corrected for animals missed on the transect line (Laake & Borchers, 2004). Each survey ship accommodated eight observers working in two teams. Target survey speed was 10 knots (18.5 km.h-1). Two observers on one platform, known as Primary, searched with the naked eye a prescribed sector out to 500 m distance. Two observers on the higher platform, known as Tracker, searched from 500 m to the horizon with high-power binoculars. Tracker observers tracked detected animals until they had passed abeam of the vessel. The duplicate identifier assessed whether groups of animals detected by Tracker were re-sighted by Primary. Duplicates were classified as Definite (D: at least 90% likely), Probable (P: between 50% and 90% likely), or Remote (R: less than 50% likely). The data recorder recorded all sightings, effort and environmental data (sea conditions, swell height and direction, glare, visibility and sightability, a subjective measure of conditions for detecting small cetaceans). Data on sighting angle and distance for calculation of perpendicular distance were also collected. Further details of the methods for estimating abundance from the sightings data are given in (Hammond et al., 2017).
Abundance and distribution of coastal bottlenose dolphins
The nearshore habitat and restricted range of coastal bottlenose dolphins means that they are more exposed to human activity and potential impacts than offshore populations. The dolphins in the Moray Firth Special Area of Conservation (SAC) have been monitored for almost three decades (e.g. Cheney, Graham, Barton, Hammond & Thompson, 2018; Hastie, Wilson & Thompson, 2003; Wilson, Thompson & Hammond, 1997). Monitoring in other areas on the east coast began in the 2000s after the range expansion to the south, first reported in Wilson et al. (2004), and has been conducted consistently in the Tay estuary and St Andrews Bay since 2009, an area 300 km south of the Moray Firth SAC. The importance of this additional area outside the SAC and the effect of the distributional range expansion in the monitoring of this population is described in Arso Civil et al. (2019). As bottlenose dolphins are long-lived animals, with an estimated generation time of 23 years, temporal trend assessments need to be carried out over a relatively long period to avoid misleading results. This is because in small resident populations, local movement may account for apparent changes in abundance over short time scales.
Data collection
Mark-recapture analysis of boat-based, photo-identification data is used to estimate the abundance of this population of coastal bottlenose dolphins. Surveys are restricted to the summer (although earlier studies were year-round, see Wilson et al. (1997). Cheney et al. (2018) gives the details of the methods used across the time series. These are largely unchanged, resulting in a long abundance estimate time series. The population has been monitored within the Moray Firth SAC since 1989 and consistently in St Andrews Bay and the Tay estuary since 2009 (Arso Civil et al., 2019; Cheney et al., 2018). These combined datasets are used to investigate changes in abundance, demographic parameters and distribution of this relatively small population of inshore bottlenose dolphins.
These efforts are supported by a number of different funders (Department for Business, Energy and Industrial Strategy, Marine Alliance for Science and Technology Scotland, Scottish Natural Heritage, Beatrice Offshore Windfarm Ltd, Moray Offshore Renewables Ltd, Marine Scotland, The Crown Estate, Highlands and Islands Enterprise, Vattenfall, UK and the Universities of Aberdeen and St Andrews).
Definition of trends
- Declining means a decreasing trend of ≥5% over 10 years (significance level p<0.05).
- Increasing means an increasing trend of ≥5% over 10 years (significance level p<0.05).
- Stable means population changes of <5% over 10 years.
This percentage (i.e. 5%) is derived from the International Union for the Conservation of Nature (IUCN) criterion to detect a 30% decline over three generations for a species, which equates to slightly less than 0.5% per year for the toothed whales.
Abundance and distribution of offshore cetaceans
The data used to infer distribution and to estimate abundance are mostly derived from large-scale aerial and shipboard surveys that used line transect methodology to generate robust estimates of abundance: SCANS (Small Cetacean Abundance in the North Sea; (Hammond et al., 2002), SCANS-II (Small Cetacean Abundance in the European Atlantic and North Sea; (Hammond et al., 2013), CODA (Cetacean Offshore Distribution and Abundance in the European Atlantic (CODA (2009)); and SCANS-III (Hammond et al., 2017). The large-scale surveys provide information on distribution and abundance over a wide area but are infrequent, and only undertaken in summer. Results from the first two surveys have been published in peer reviewed publications (Hammond et al., 2002; Hammond et al., 2013).
Baselines and transboundary issues
Although the baseline should derive from historical data, these data are not available for any cetacean species. Historical abundance and distribution are therefore unknown. Even if numbers are suspected to have declined, it is unlikely that they could be restored because today’s marine environment is very different, in part due to climate change and other human impacts. Consequently, a recent baseline must be used. The most useful baselines for wide-ranging cetacean species derive from the results of the large-scale SCANS and CODA surveys. Because cetaceans are highly mobile species, transboundary effects are accounted for by considering changes in the populations at the appropriate and sufficiently large spatial scale. For example, harbour porpoise distribution in the North Sea shifted southwards prior to 2005, and the 2016 SCANS-III survey showed that this has been maintained. However, harbour porpoise abundance in the whole North Sea has remained stable since 1994.
Metrics
In line with the wider UK assessments for MSFD, two criteria were used, species distribution and population size, but the metrics used to measure distribution here for Scottish waters are different. Here survey encounter rates rather than model-based densities are reported. This is to make them comparable to the previous assessment (Baxter et al., 2011).
MSFD criterion D1.1 – species distribution
To investigate changes in species distribution since the previous assessment, data are presented as encounter rate and are compared between the SCANS-II and SCANS-III surveys for the 11 main species found around Scotland. This presents a broad summary of where the different species are found and how this differed between surveys. However, these should be interpreted with caution as they represent a snapshot of the occurrence of the animals, at two summer time points.
MSFD criterion D1.2 – population size
Abundance (by species) was estimated using line transect, distance sampling methods (design-based estimates; Hammond et al., 2013) incorporating both shipboard and aerial survey methods, in which sightings are corrected for availability and perception bias where possible.
For most species, only two abundance estimates are currently available so a robust assessment of a trend involving change from a baseline is not possible. For harbour porpoise and white-beaked dolphin in the Greater North Sea there are three estimates available (SCANS, SCANS-II and SCANS-III) so a limited assessment can be done. For minke whale, there are eight estimates available in the North Sea from SCANS and Norwegian surveys from 1989 to 2016 allowing a more robust assessment.
Spatial scope
Due to the mobility and variation in the habitat preference and foraging requirements of the vastly different species included, and to keep assessments consistent with the OSPAR Intermediate assessment and MSFD, the spatial scope is at the level of the European Atlantic waters.
Power analysis
Power analyses were performed for species for which there were three or more comparable estimates of regional abundance from SCANS and other surveys, using previously estimated coefficients of variation (CV). The datasets comprised abundance estimates from three surveys over 22 years for harbour porpoise, three surveys over 22 years for white-beaked dolphin, and eight surveys over 27 years for minke whale. These data have 80% power (the conventional acceptable level) to detect an annual rate of decline, at a significance level (p value) of 0.05, of 1.8% for harbour porpoise, 5% for white-beaked dolphin, and 0.5% for minke whale.
The power to detect trends could be improved by increasing the frequency of the large-scale surveys.
Reanalysis of SCANS (1994) and SCANS-II (2005) data
SCANS-III surveyed most of the European continental shelf by aerial survey whilst much of these waters were surveyed by ship in SCANS and SCANS-II. Methodologies employed for ship (two-team ‘tracker’) and aerial survey (circle-back) should generate unbiased estimates of abundance for most species (harbour porpoise, dolphin species and minke whale) so estimates for these species from ship and aerial surveys are, therefore, comparable.
There is a choice of two models to estimate detection probability when the two-team ‘tracker’ method has been employed on a ship survey, the point (or trackline) independence model and the full independence model. The second model should be used to correct for bias introduced when there is movement of animals in response to the approaching survey ship. However, it is not a robust model and tends to underestimate abundance because of non-independence in tracker and primary sightings. A full technical explanation of the methods is given in Hammond et al. (2017).
The full independence model was used to estimate abundance of all species from the ship surveys in SCANS in 1994 and SCANS-II in 2005. The point independence model had not yet been developed in 1994. In 2005, there was weak evidence of responsive movement for some species, so a cautious approach was adopted at the time leading to estimates that were likely to be negatively biased. However, this creates a problem of comparison with estimates between SCANS, SCANS-II and SCANS-III in any assessment of trend. Aerial surveys are not subject to responsive movement and the circle-back methods used should be unbiased. In SCANS-III, there was no evidence of movement of animals in response to the survey ships, so the more robust point independence detection function model was used for all species.
The solution implemented has been to reanalyse the SCANS and SCANS-II data using the more robust point independence model of detection probability so that estimates are comparable between 1994, 2005 and 2016. The result is that as expected, estimates for 1994 and 2005 for harbour porpoise, white-beaked dolphin and minke whale are larger than those published in Hammond et al. (2002) and Hammond et al. (2013). If this had not been done, estimates of trend in the North Sea between 1994 and 2016 would have appeared to show increasing rather than stable populations.
Abundance and distribution of coastal bottlenose dolphins
The summer abundance of coastal bottlenose dolphin on the east coast of Scotland has been estimated by Arso Civil et al. (2019) for the period 2009 to 2015 (see Results (extended)). Details of the mark-recapture model used to generate the estimates (from a no-movement model with a time-varying heterogeneity mixture parameter) and scaling to the total population from the annual proportion of marked individuals, are also found in Arso Civil et al. (2019). An indication of the population trend and changes in the animals’ distributional range are used in this assessment.
Results
Abundance and distribution of offshore cetaceans
The abundance estimates for the dominant cetacean species in the European Continental Shelf seas and offshore waters covered by the CODA in 2007 and SCANS II and ObSERVE surveys in 2016, are given in Table 1. In most cases the abundance of the main species has remained similar or increased. However, the power to detect any significant changes was only possible for three species in the North Sea; harbour porpoise, minke whale and white-beaked dolphin. The time span covered by the three SCANS surveys and reasonable precision means that the data have high power to detect changes of 2-5% per year. For minke whale this is a 0.5% change due to the additional data available from the Norwegian surveys (Bøthun et al., 2009; Solvan et al., 2015).
| Species | Year | Abundance | CV* | 95%CL low | 95%CL high |
| Harbour porpoise | 2005/07 | 519,864 | 0.21 | 345,987 | 781,125 |
| 2016 | 493,205 | 0.15 | 370,878 | 655,879 | |
| White-beaked dolphin | 2005/07 | 37,689 | 0.36 | 19,014 | 74,708 |
| 2016 | 39,535 | 0.27 | 23,558 | 66,348 | |
| White-sided dolphin | 2005/07 | - | - | - | - |
| 2016 | 17,431 | 0.64 | 5,528 | 54,962 | |
| Bottlenose dolphin | 2005/07 | 35,936 | 0.24 | 22,756 | 56,749 |
| 2016 | 115,027 | 0.17 | 83,125 | 159,173 | |
| Common dolphin | 2005/07 | 173,219 | 0.27 | 103,386 | 290,221 |
| 2016 | 481,306 | 0.26 | 292,818 | 791,123 | |
| Striped dolphin | 2005/07 | 63,210 | 0.90 | 13,913 | 287,170 |
| 2016 | 372,340 | 0.33 | 198,634 | 697,953 | |
| Common & striped (incl unid) | 2005/07 | 305,460 | 0.36 | 153,994 | 605,904 |
| 2016 | 1,031,395 | 0.17 | 734,129 | 1,449,030 | |
| Risso's dolphin | 2005/07 | - | - | - | - |
| 2016 | 16,214 | 0.38 | 7,959 | 33,030 | |
| Pilot whale | 2005/07 | 123,732 | 0.35 | 63,551 | 240,904 |
| 2016 | 33,190 | 0.28 | 19,296 | 57,089 | |
| Sperm whale | 2005/07 | 2,569 | 0.26 | 1,556 | 4,241 |
| 2016 | 13,518 | 0.41 | 6,298 | 29,017 | |
| Beaked whales (all spp)** | 2005/07 | 12,869 | 0.31 | 7,107 | 23,302 |
| 2016 | 14,536 | 0.41 | 6,723 | 31,427 | |
| Minke whale | 2005/07 | 22,014 | 0.37 | 10,863 | 44,611 |
| 2016 | 21,158 | 0.27 | 12,494 | 35,829 | |
| Fin whale | 2005/07 | 19,354 | 0.24 | 12,171 | 30,776 |
| 2016 | 18,240 | 0.32 | 9,885 | 33,657 |
Estimates for the European continental shelf obtained from the SCANS surveys in 2005/7 and 2016 and offshore waters covered by the CODA in 2007 and SCANS II and ObSERVE surveys in 2016 are given. Abundance estimates were not calculable for species with low encounter rates such as killer whale (see Figures l (i) and (ii) in Read More section) and others were combined (for example beaked whales) to provide an abundance estimate for that species group.
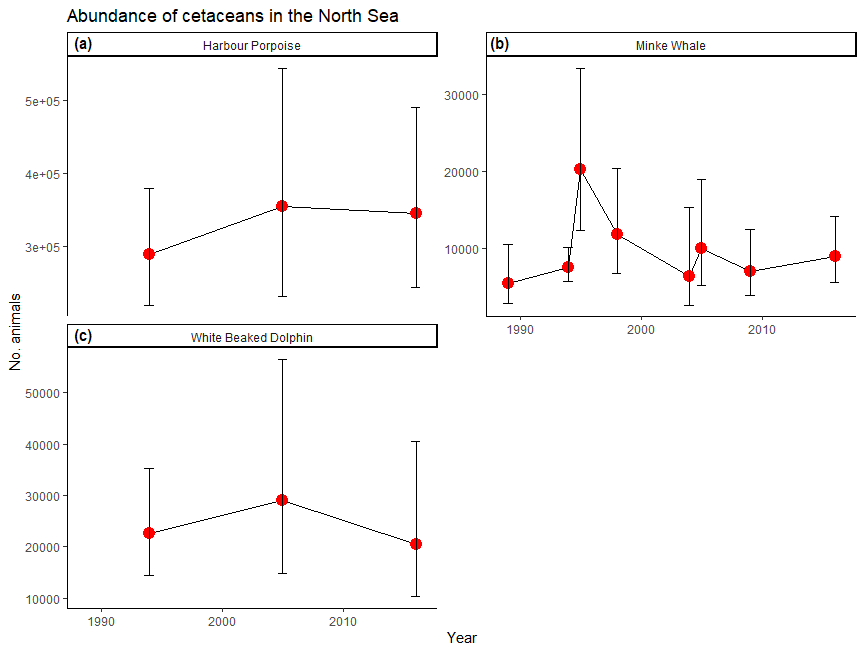
For harbour porpoise in the North Sea, a region that is considered for assessment purposes as a population unit, the results show no evidence for any trend in abundance since the mid-1990s (Figure 4). However, the species distribution has expanded in a southerly direction, particularly into the English Channel, presumably from the North and Celtic Seas.
Offshore bottlenose dolphin distribution has not changed and was also similar for common dolphin, long-finned pilot whale, beaked whales, sperm whale, and fin whale.
No trends in abundance were evident for white-beaked dolphin and minke whale in the North Sea (Figure 4). There was some evidence that minke whale distribution in the North Sea had shifted to the south between 1994 and 2005 but since then there has been no change.
Maps showing the encounter rates as a proxy for cetacean distribution for the 12 main species and the killer whale are given in Read More section (Figures a – m).
Abundance and distribution of coastal bottlenose dolphins
The estimated abundance of bottlenose dolphins on the east coast of Scotland between 2009 and 2015 was variable but increased from 165 (95% CI 156-175) animals in 2009 to 209 (95% CI 189-230) in 2015 (Arso Civil et al., 2019) (Figure 5). More information is in the extended section.
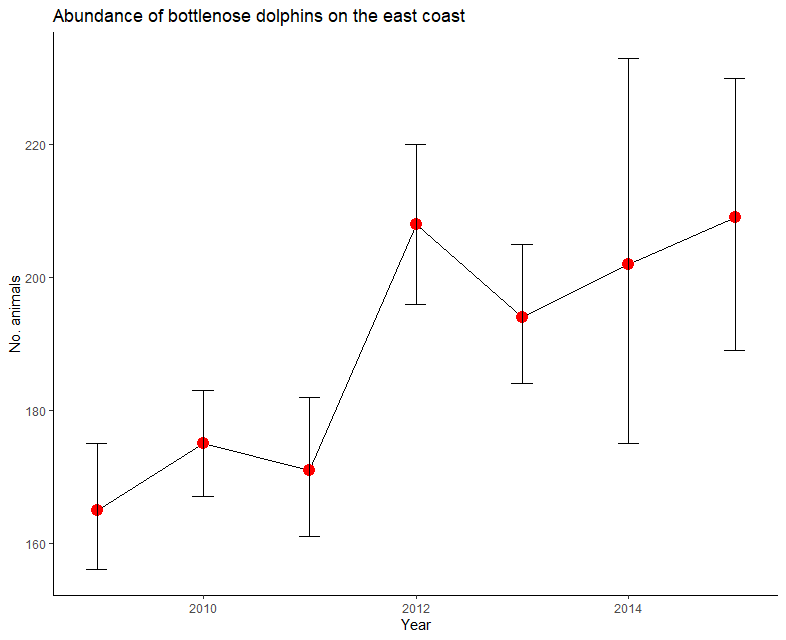
Figure 5: Abundance of coastal bottlenose dolphins on east coast of Scotland by year.
Offshore cetaceans
Harbour porpoise
The observed distribution of harbour porpoises in 2016 was similar to that observed in SCANS-II in 2005/07. For harbour porpoise in the North Sea, there is no evidence for trends in abundance since the mid-1990s. In terms of the ICES Assessment Units (AU), in the West Scotland AU numbers were comparable (24,400, CV = 0.23 and 26,300, CV = 0.37). In the North Sea the estimate in 2016 (345,000, CV = 0.18) was similar to the estimate in 2005 (355,000, CV = 0.22; revised from (Hammond et al., 2013) and 1994 (289,000, CV = 0.14; revised from (Hammond et al., 2002), and to the model-based estimate using data from 2005-2013 of 361,000 (0.20) (Gilles et al., 2016). Results of the trend analysis of estimates in the North Sea show no support for changes in abundance since 1994 (Figure 4).
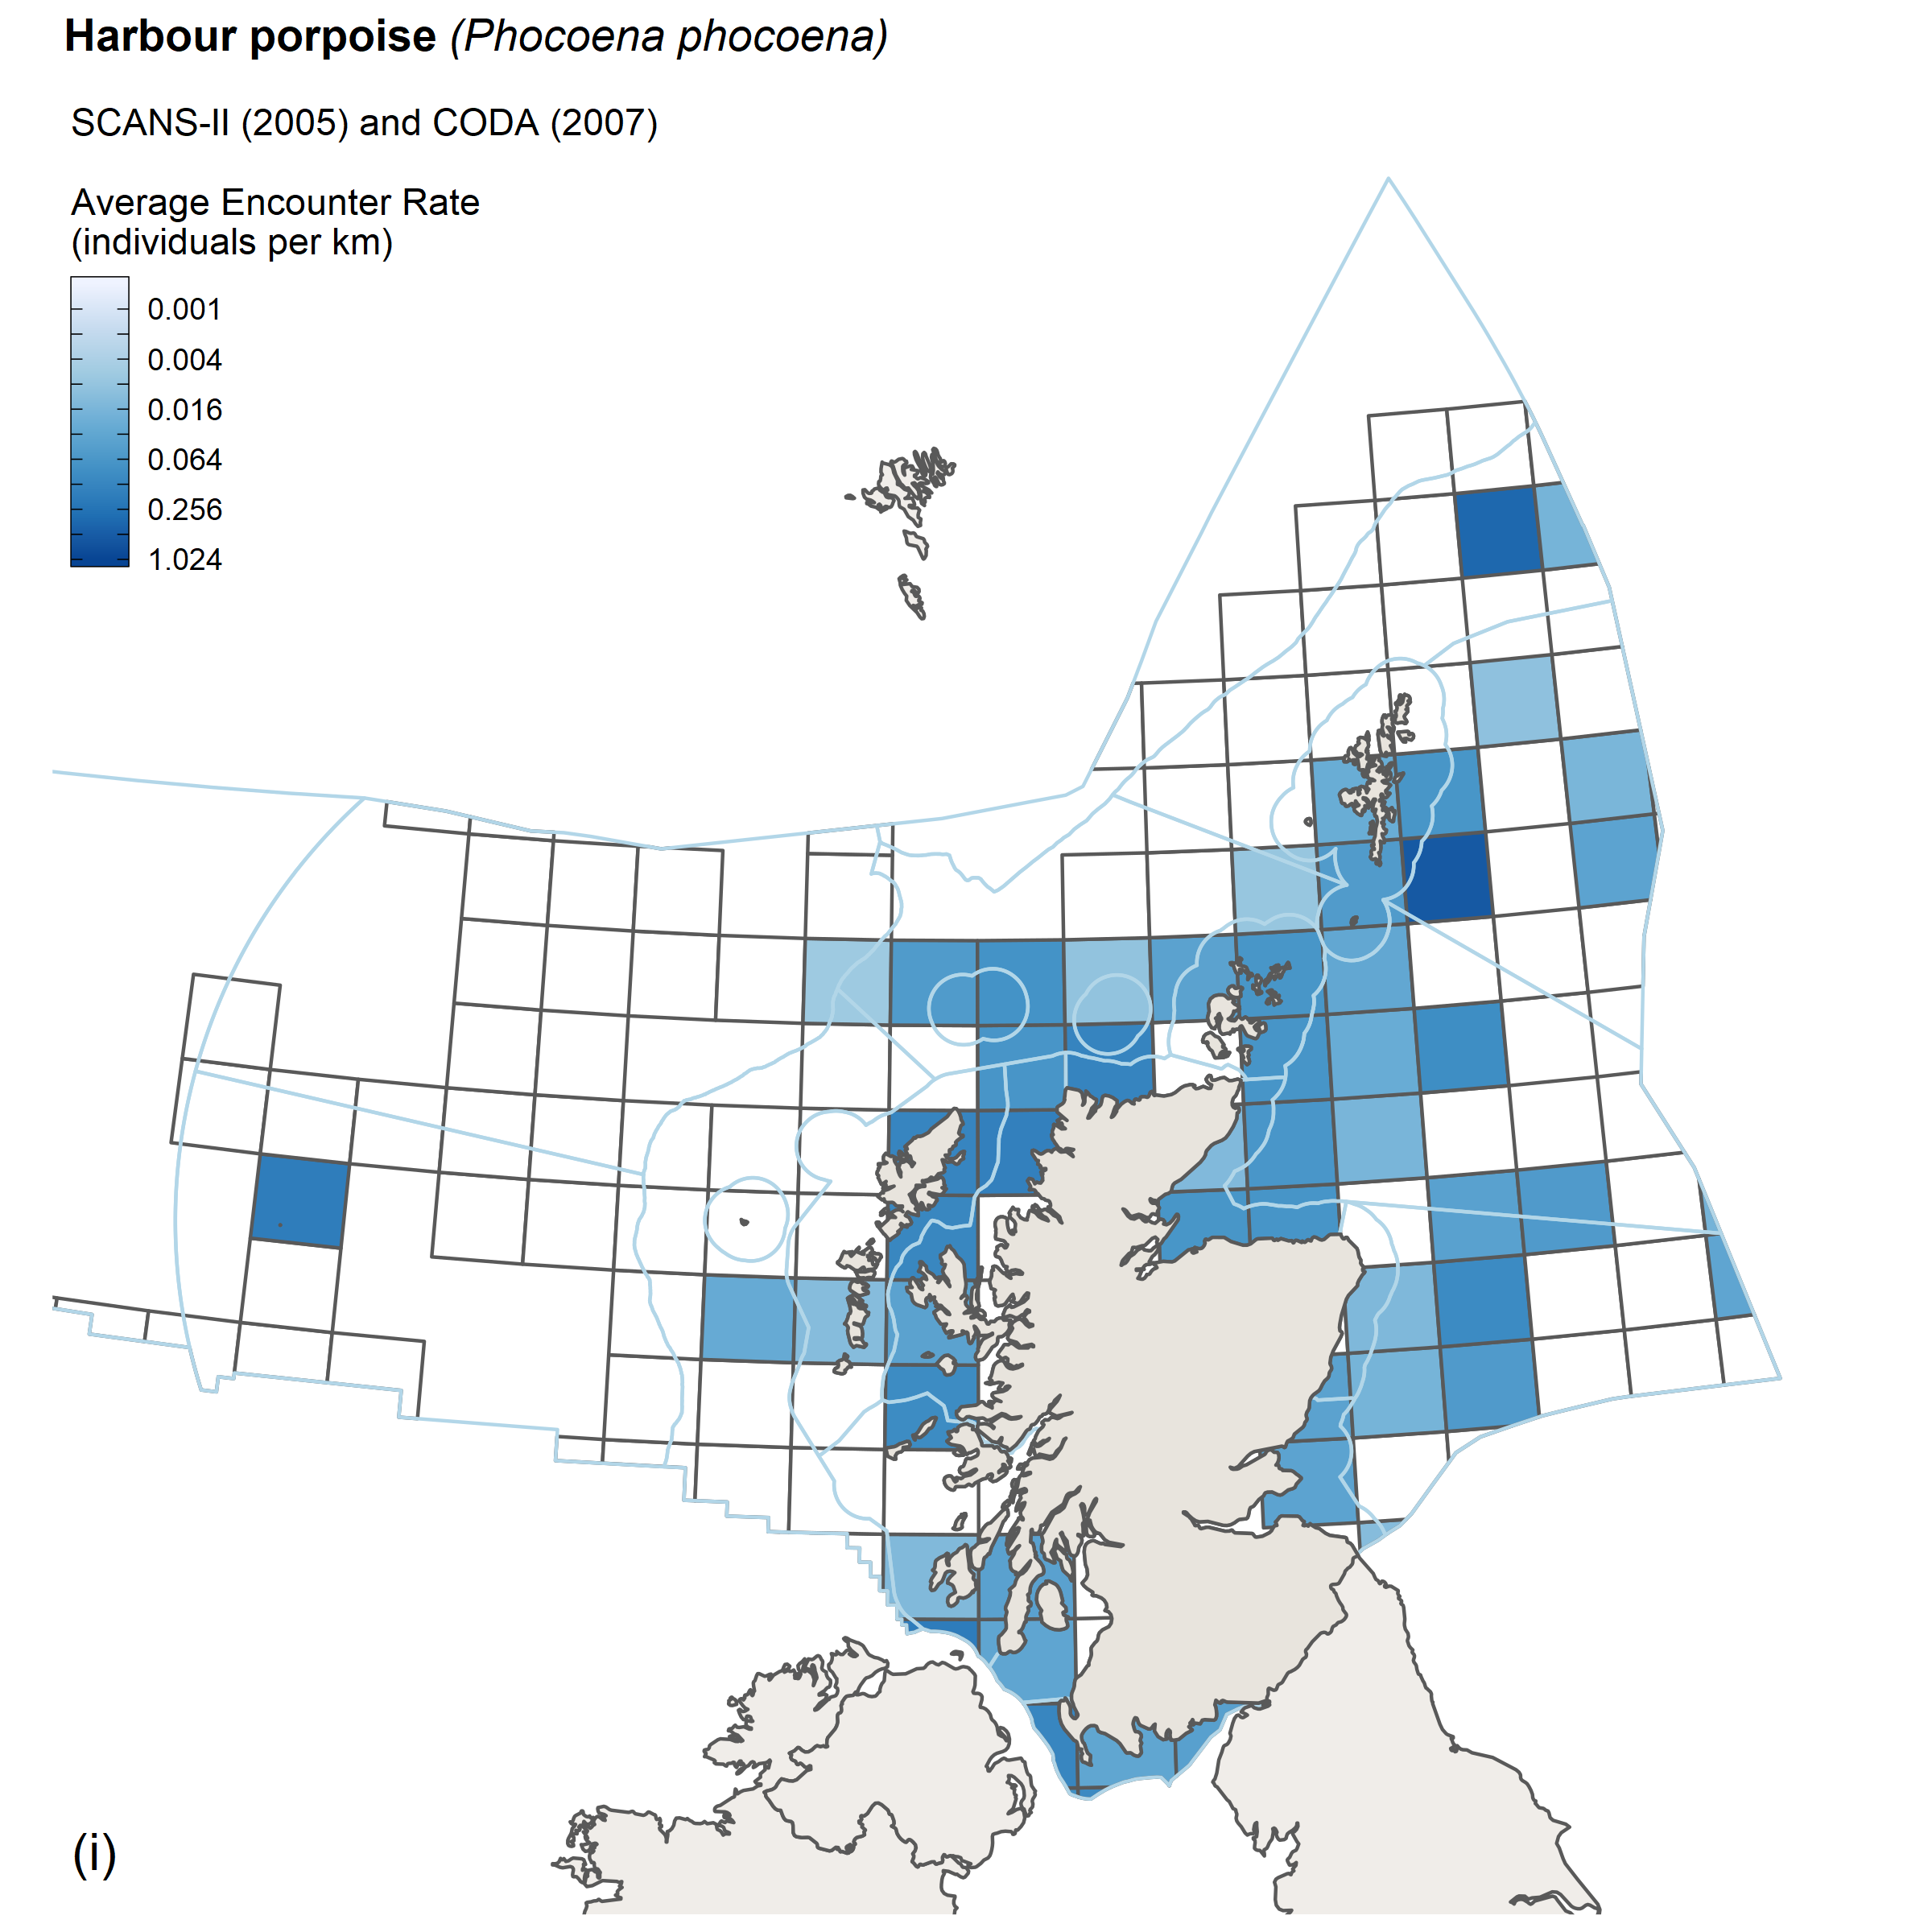 |
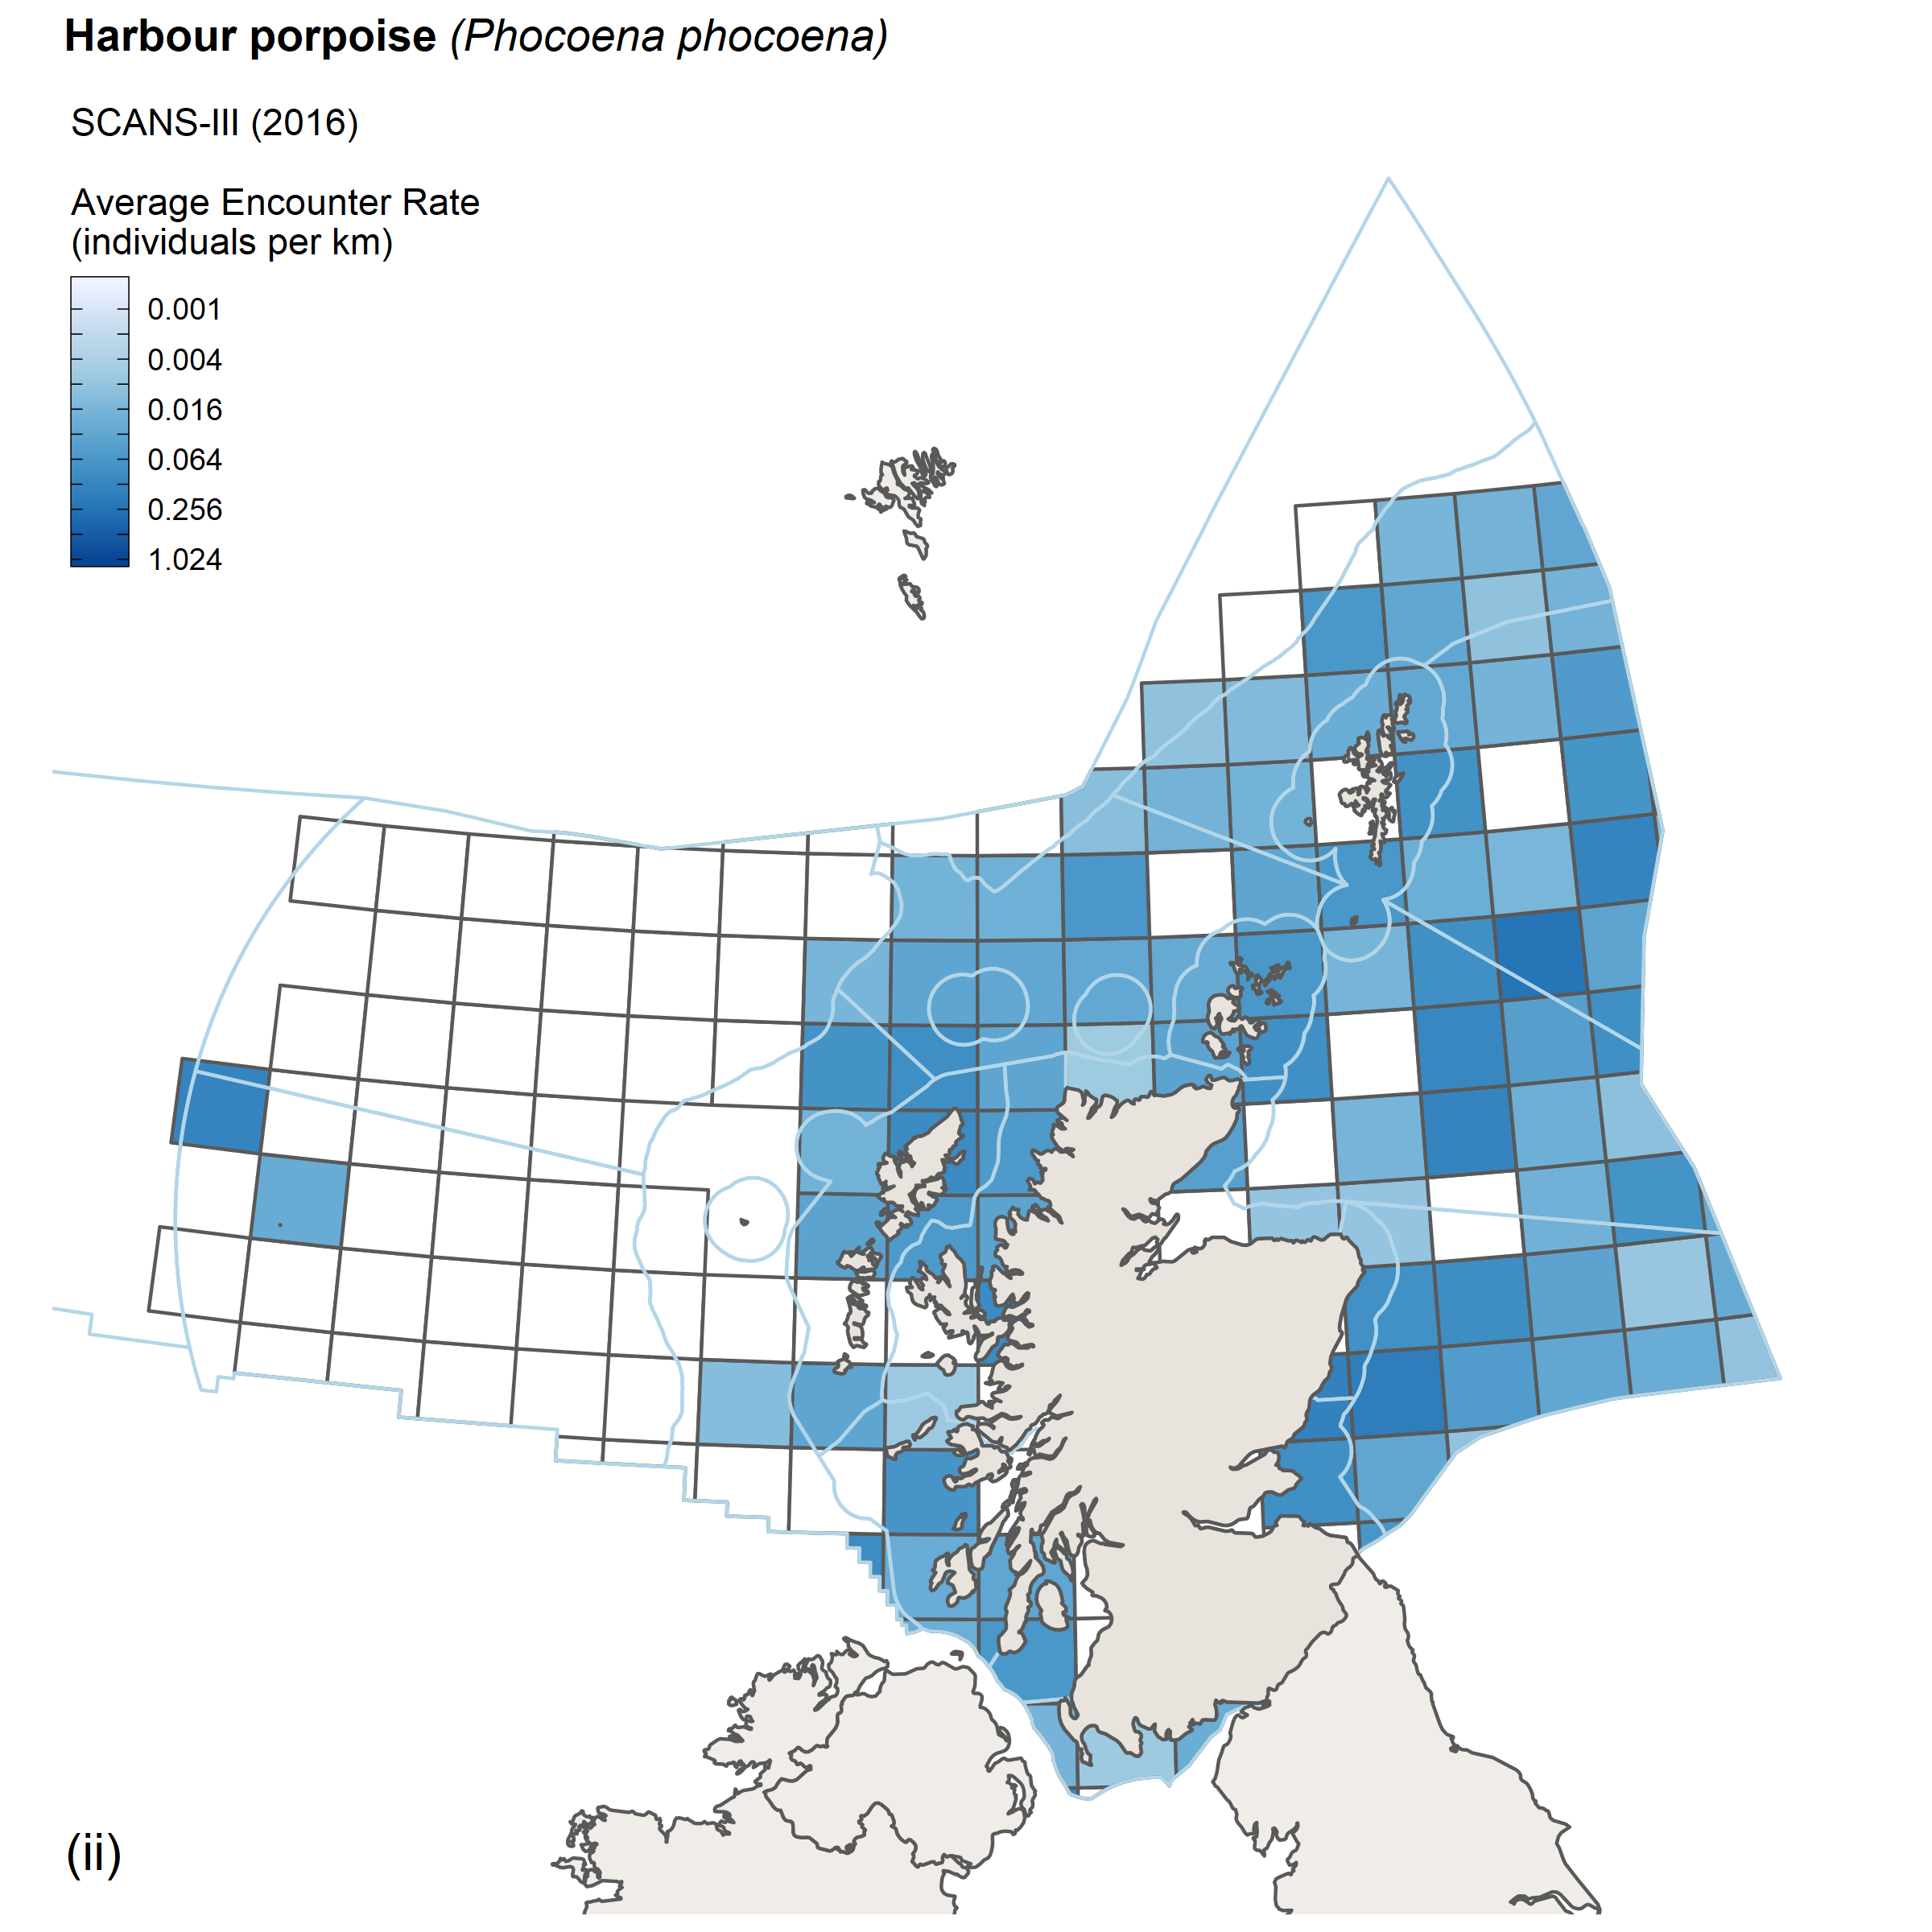 |
| Figure a: Encounter rates for harbour porpoise from (i) SCANS II/CODA survey, 2005/2007 and (ii) SCANS III survey, 2016. |
Offshore bottlenose dolphin
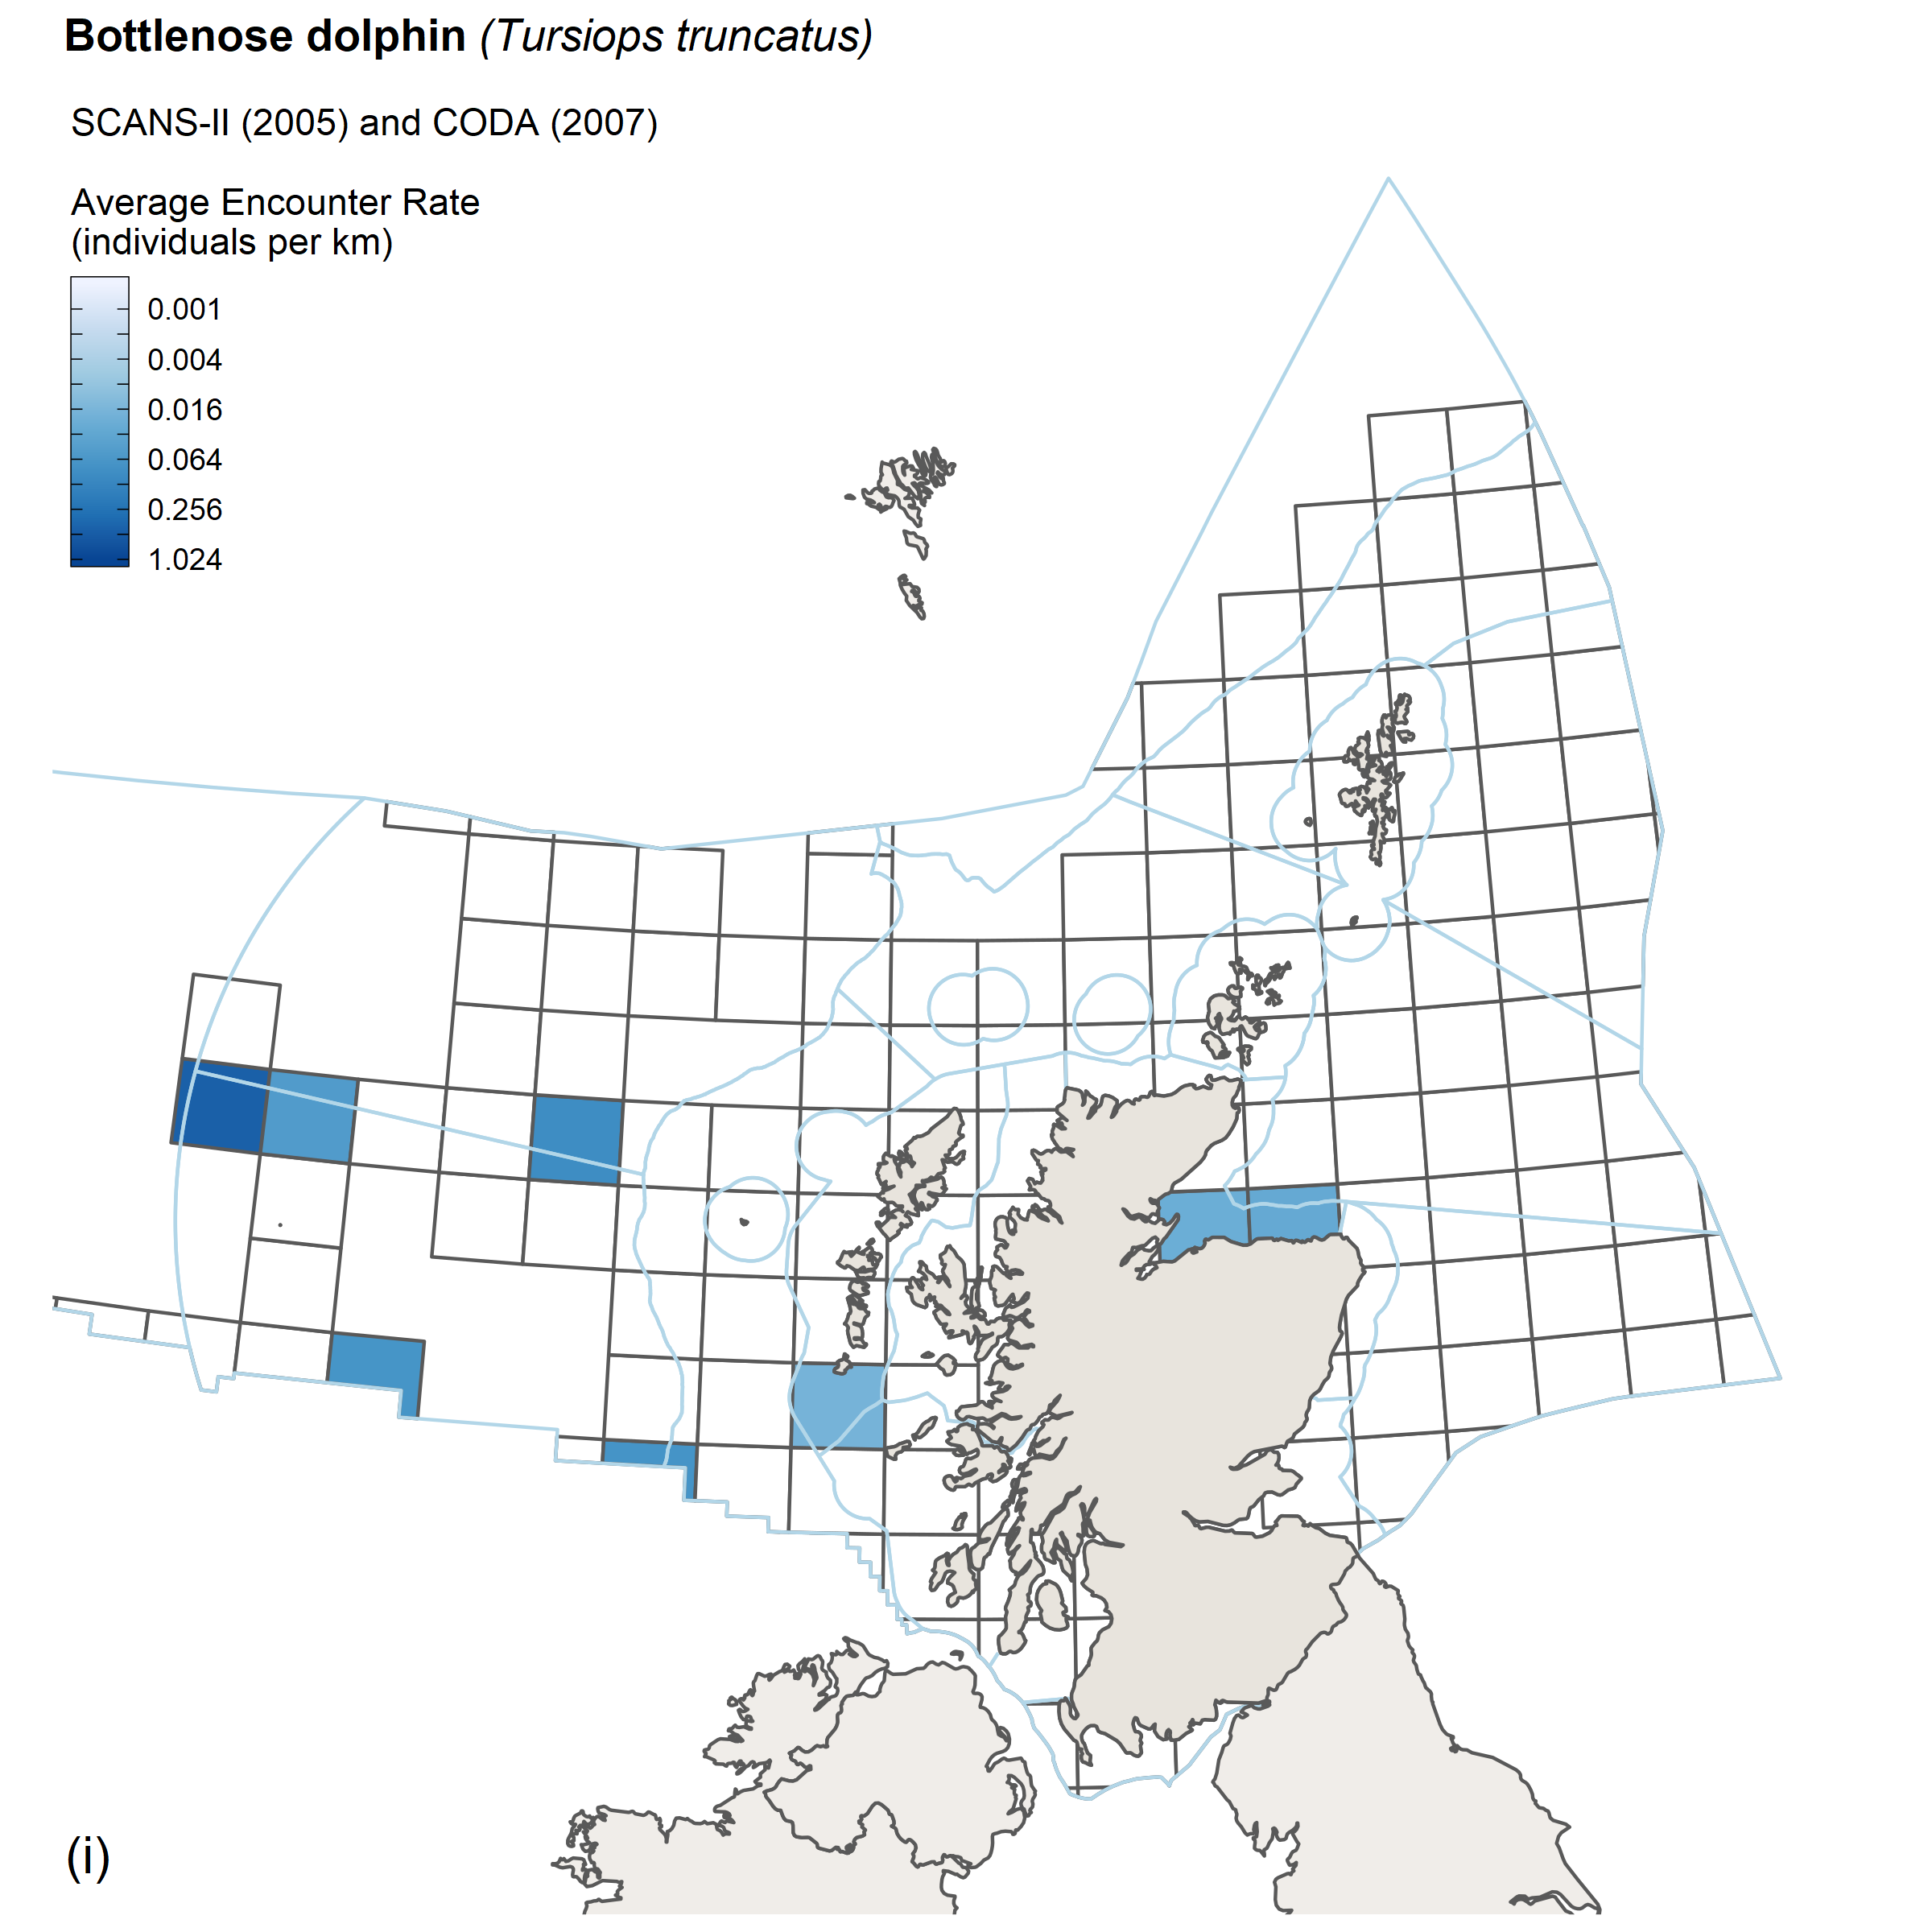
The observed distribution of offshore bottlenose dolphins in 2016 was similar to that observed in SCANS-II and CODA in 2005/07 (CODA, 2009); Hammond et al., 2013).
 |
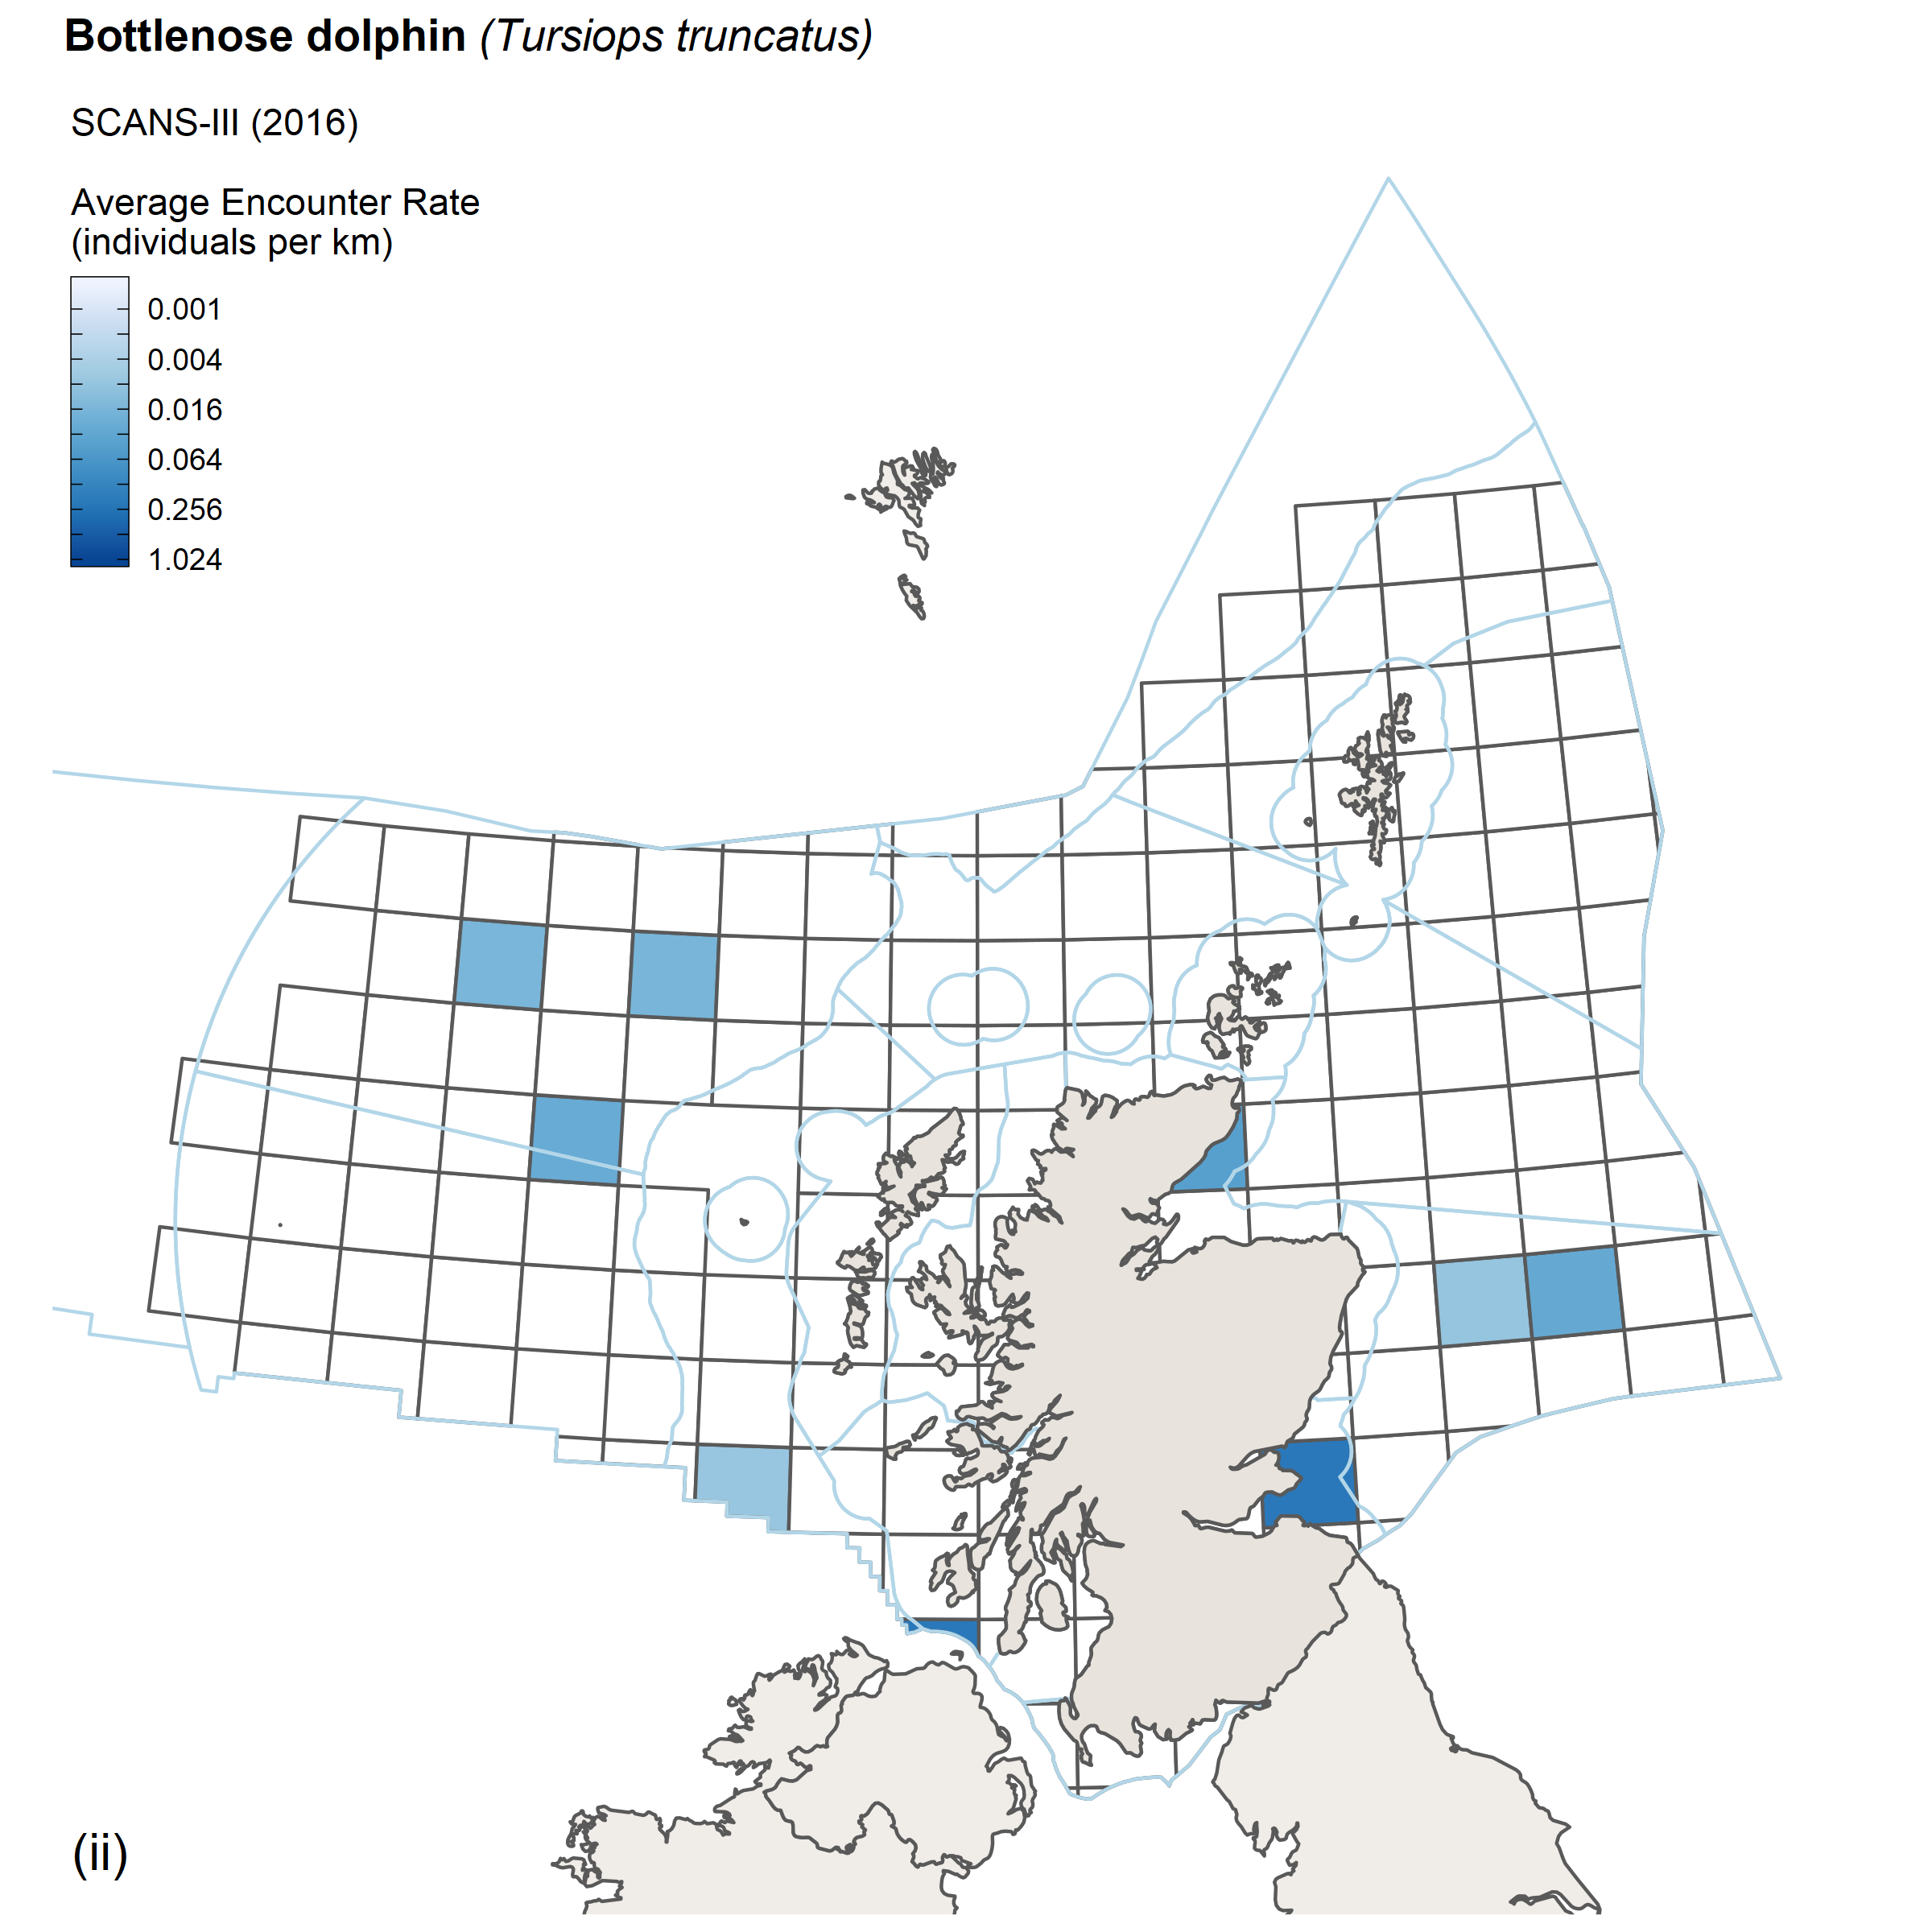 |
| Figure b: Encounter rates for offshore bottlenose dolphin from (i) SCANS II/CODA survey, 2005/2007 and (ii) SCANS III survey, 2016. |
White-beaked dolphin
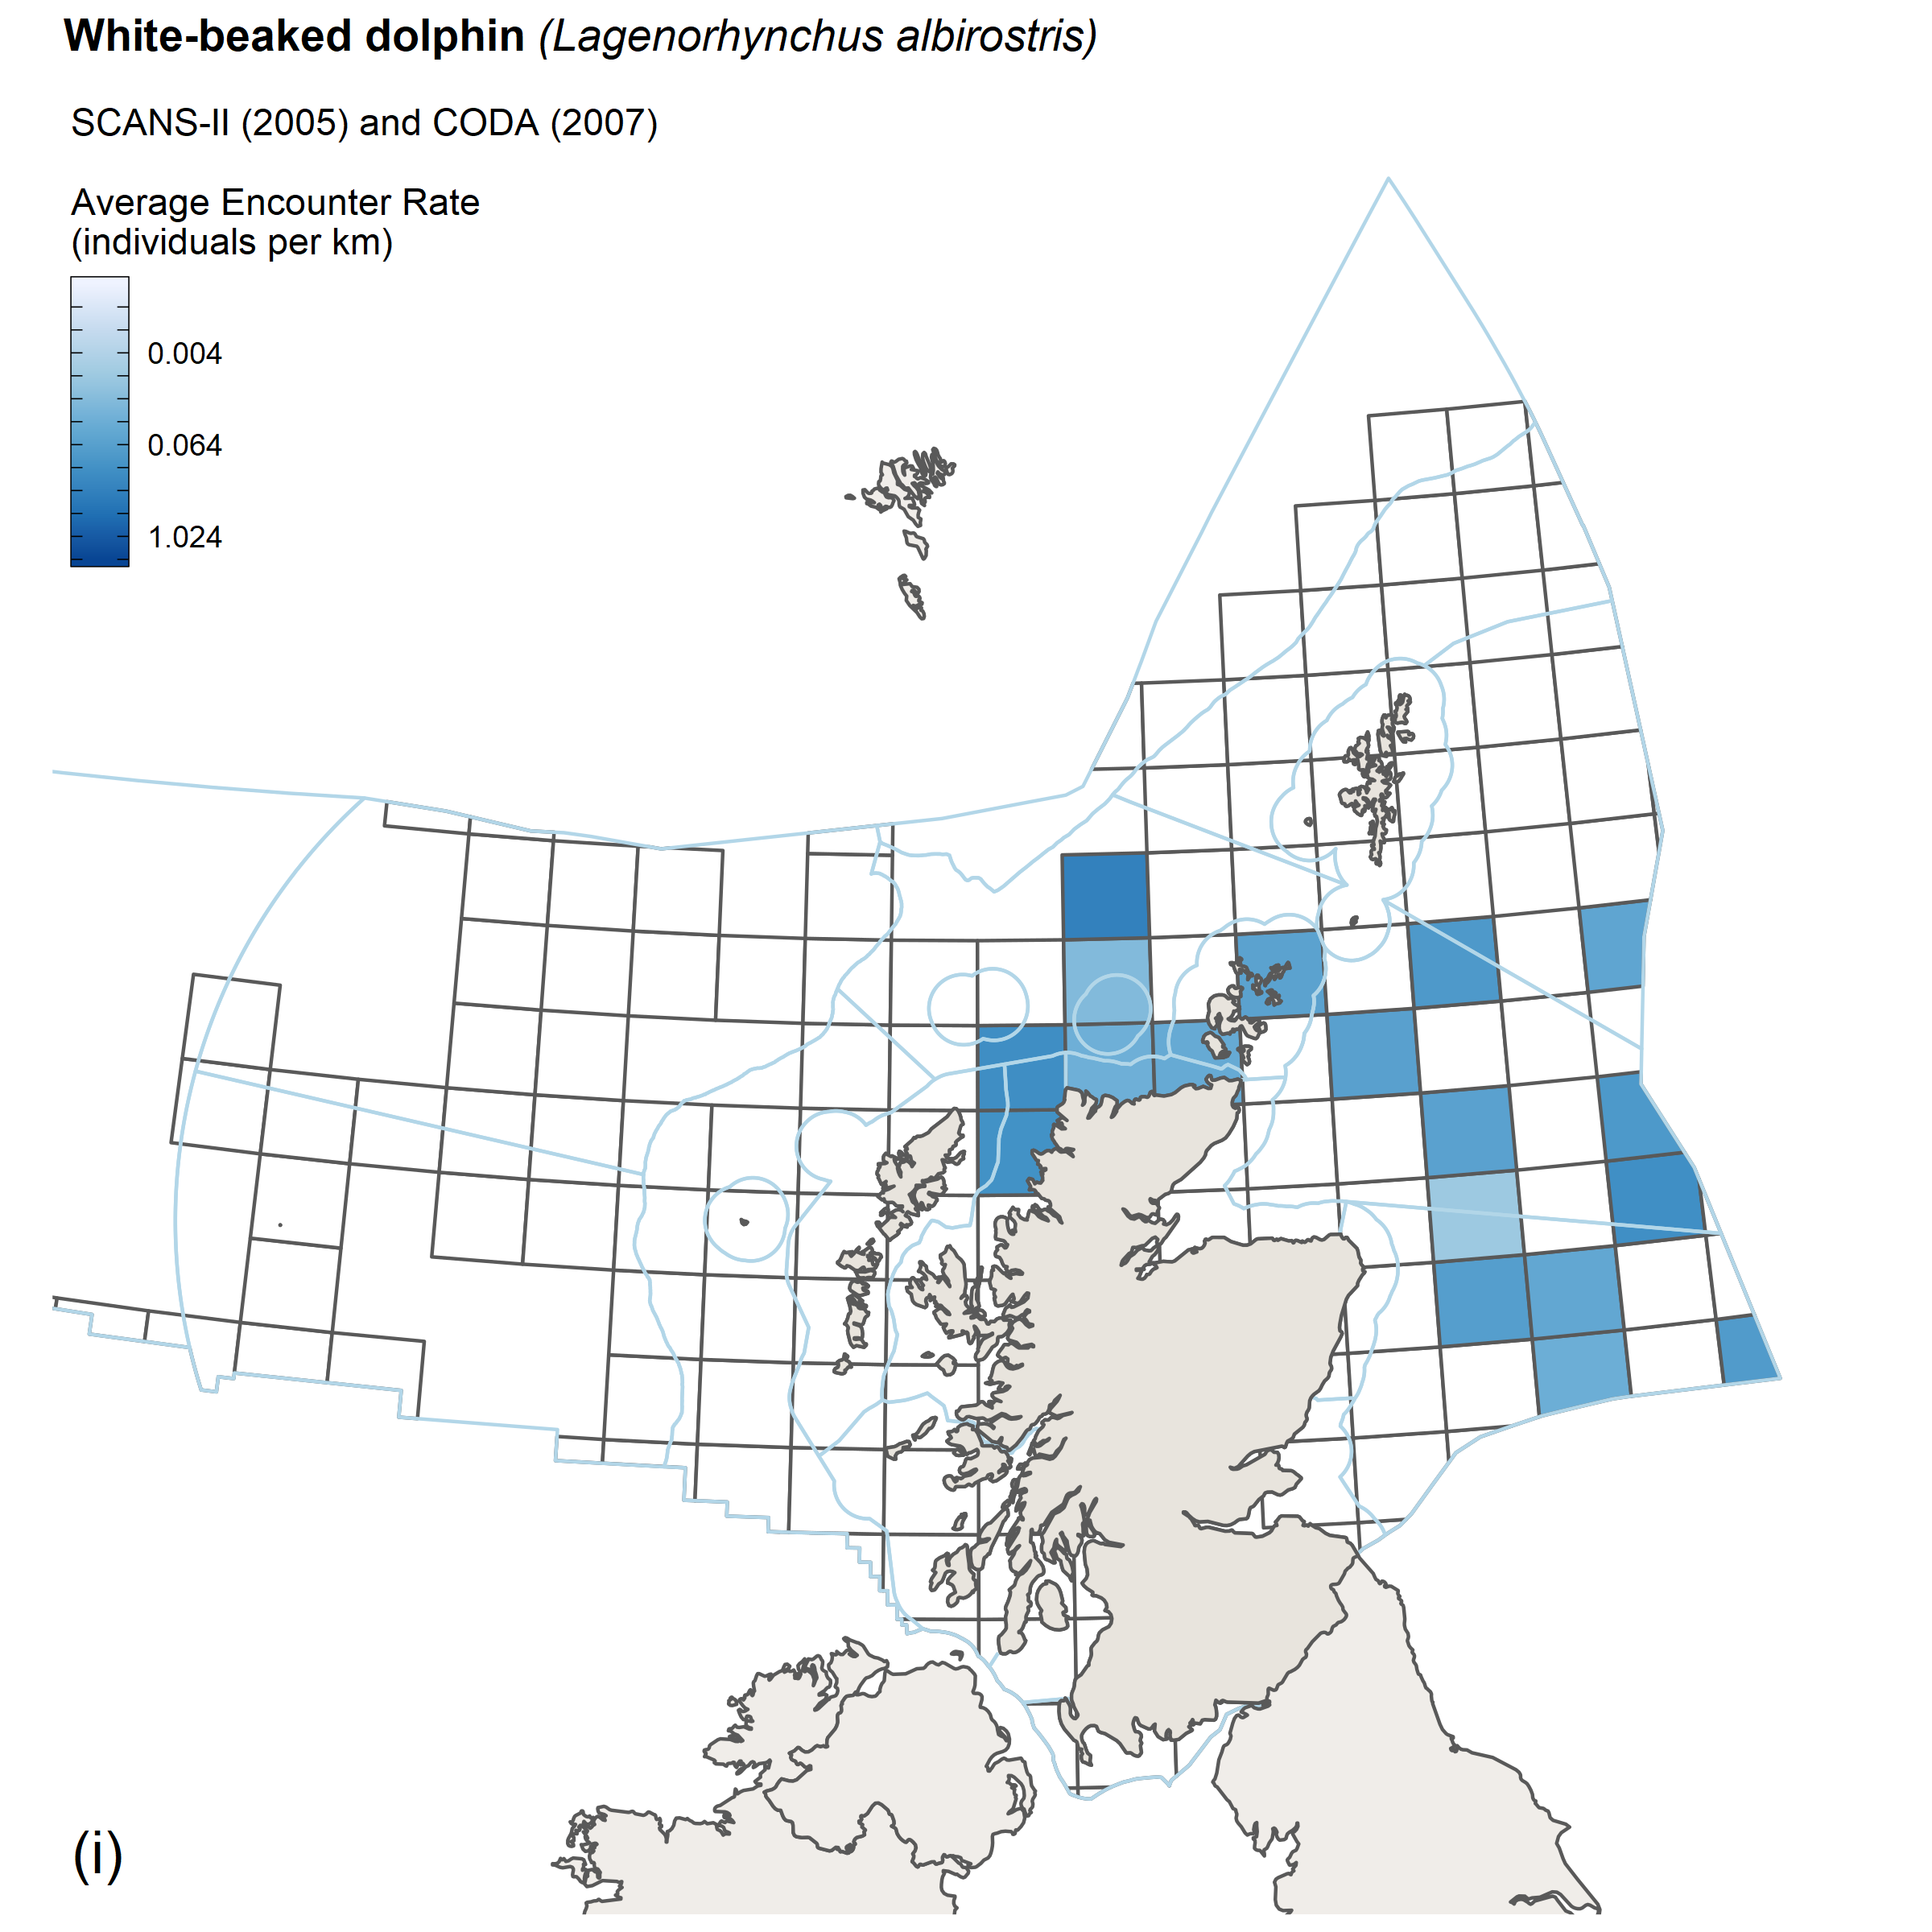
The observed distribution of white-beaked dolphins shows little change. The estimate of abundance in 2016 of 36,300 (CV = 0.29) is very similar to the estimate from SCANS-II in 2005 of 37,700 (CV = 0.36) (revised from (Hammond et al., 2013) but higher than the estimate from SCANS in 1994 of 22,600 (CV = 0.23) (revised from (Hammond et al., 2002). Results of the trend analysis of estimates in the North Sea show no support for changes in abundance since 1994 (Figure 4).
 |
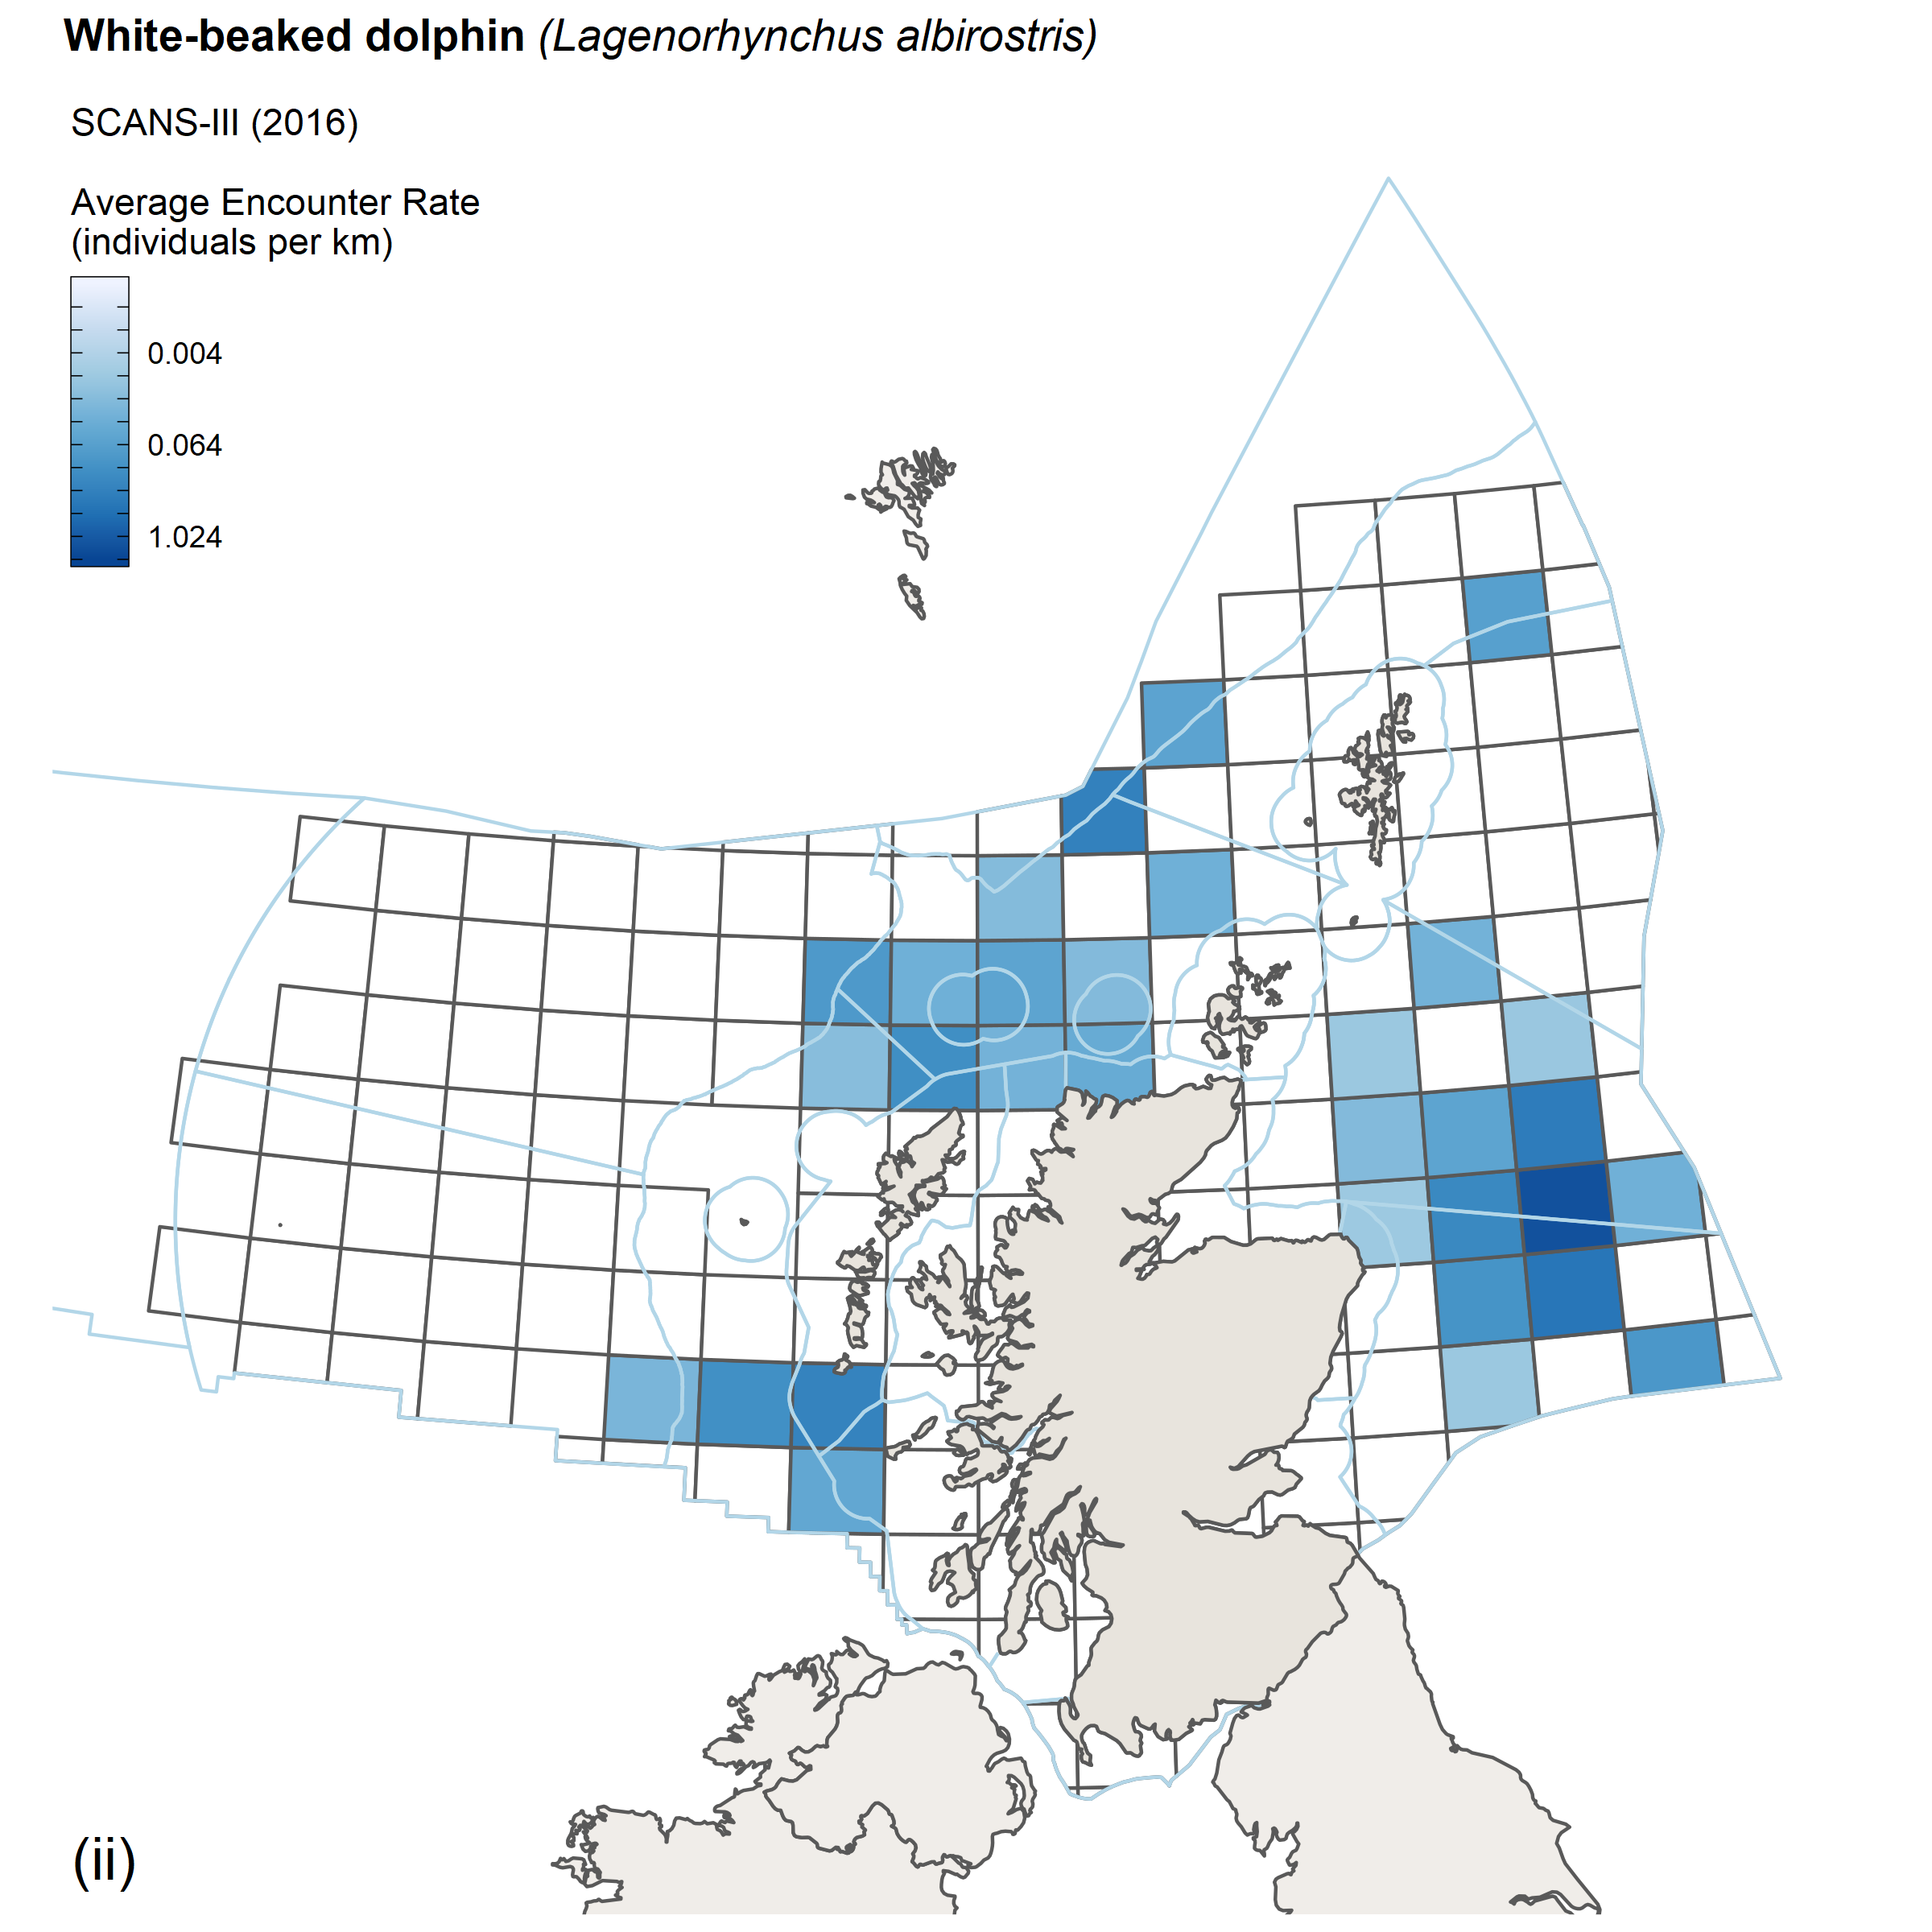 |
| Figure c: Encounter rates for white-beaked dolphin from (i) SCANS II/CODA survey, 2005/2007 and (ii) SCANS III survey, 2016. |
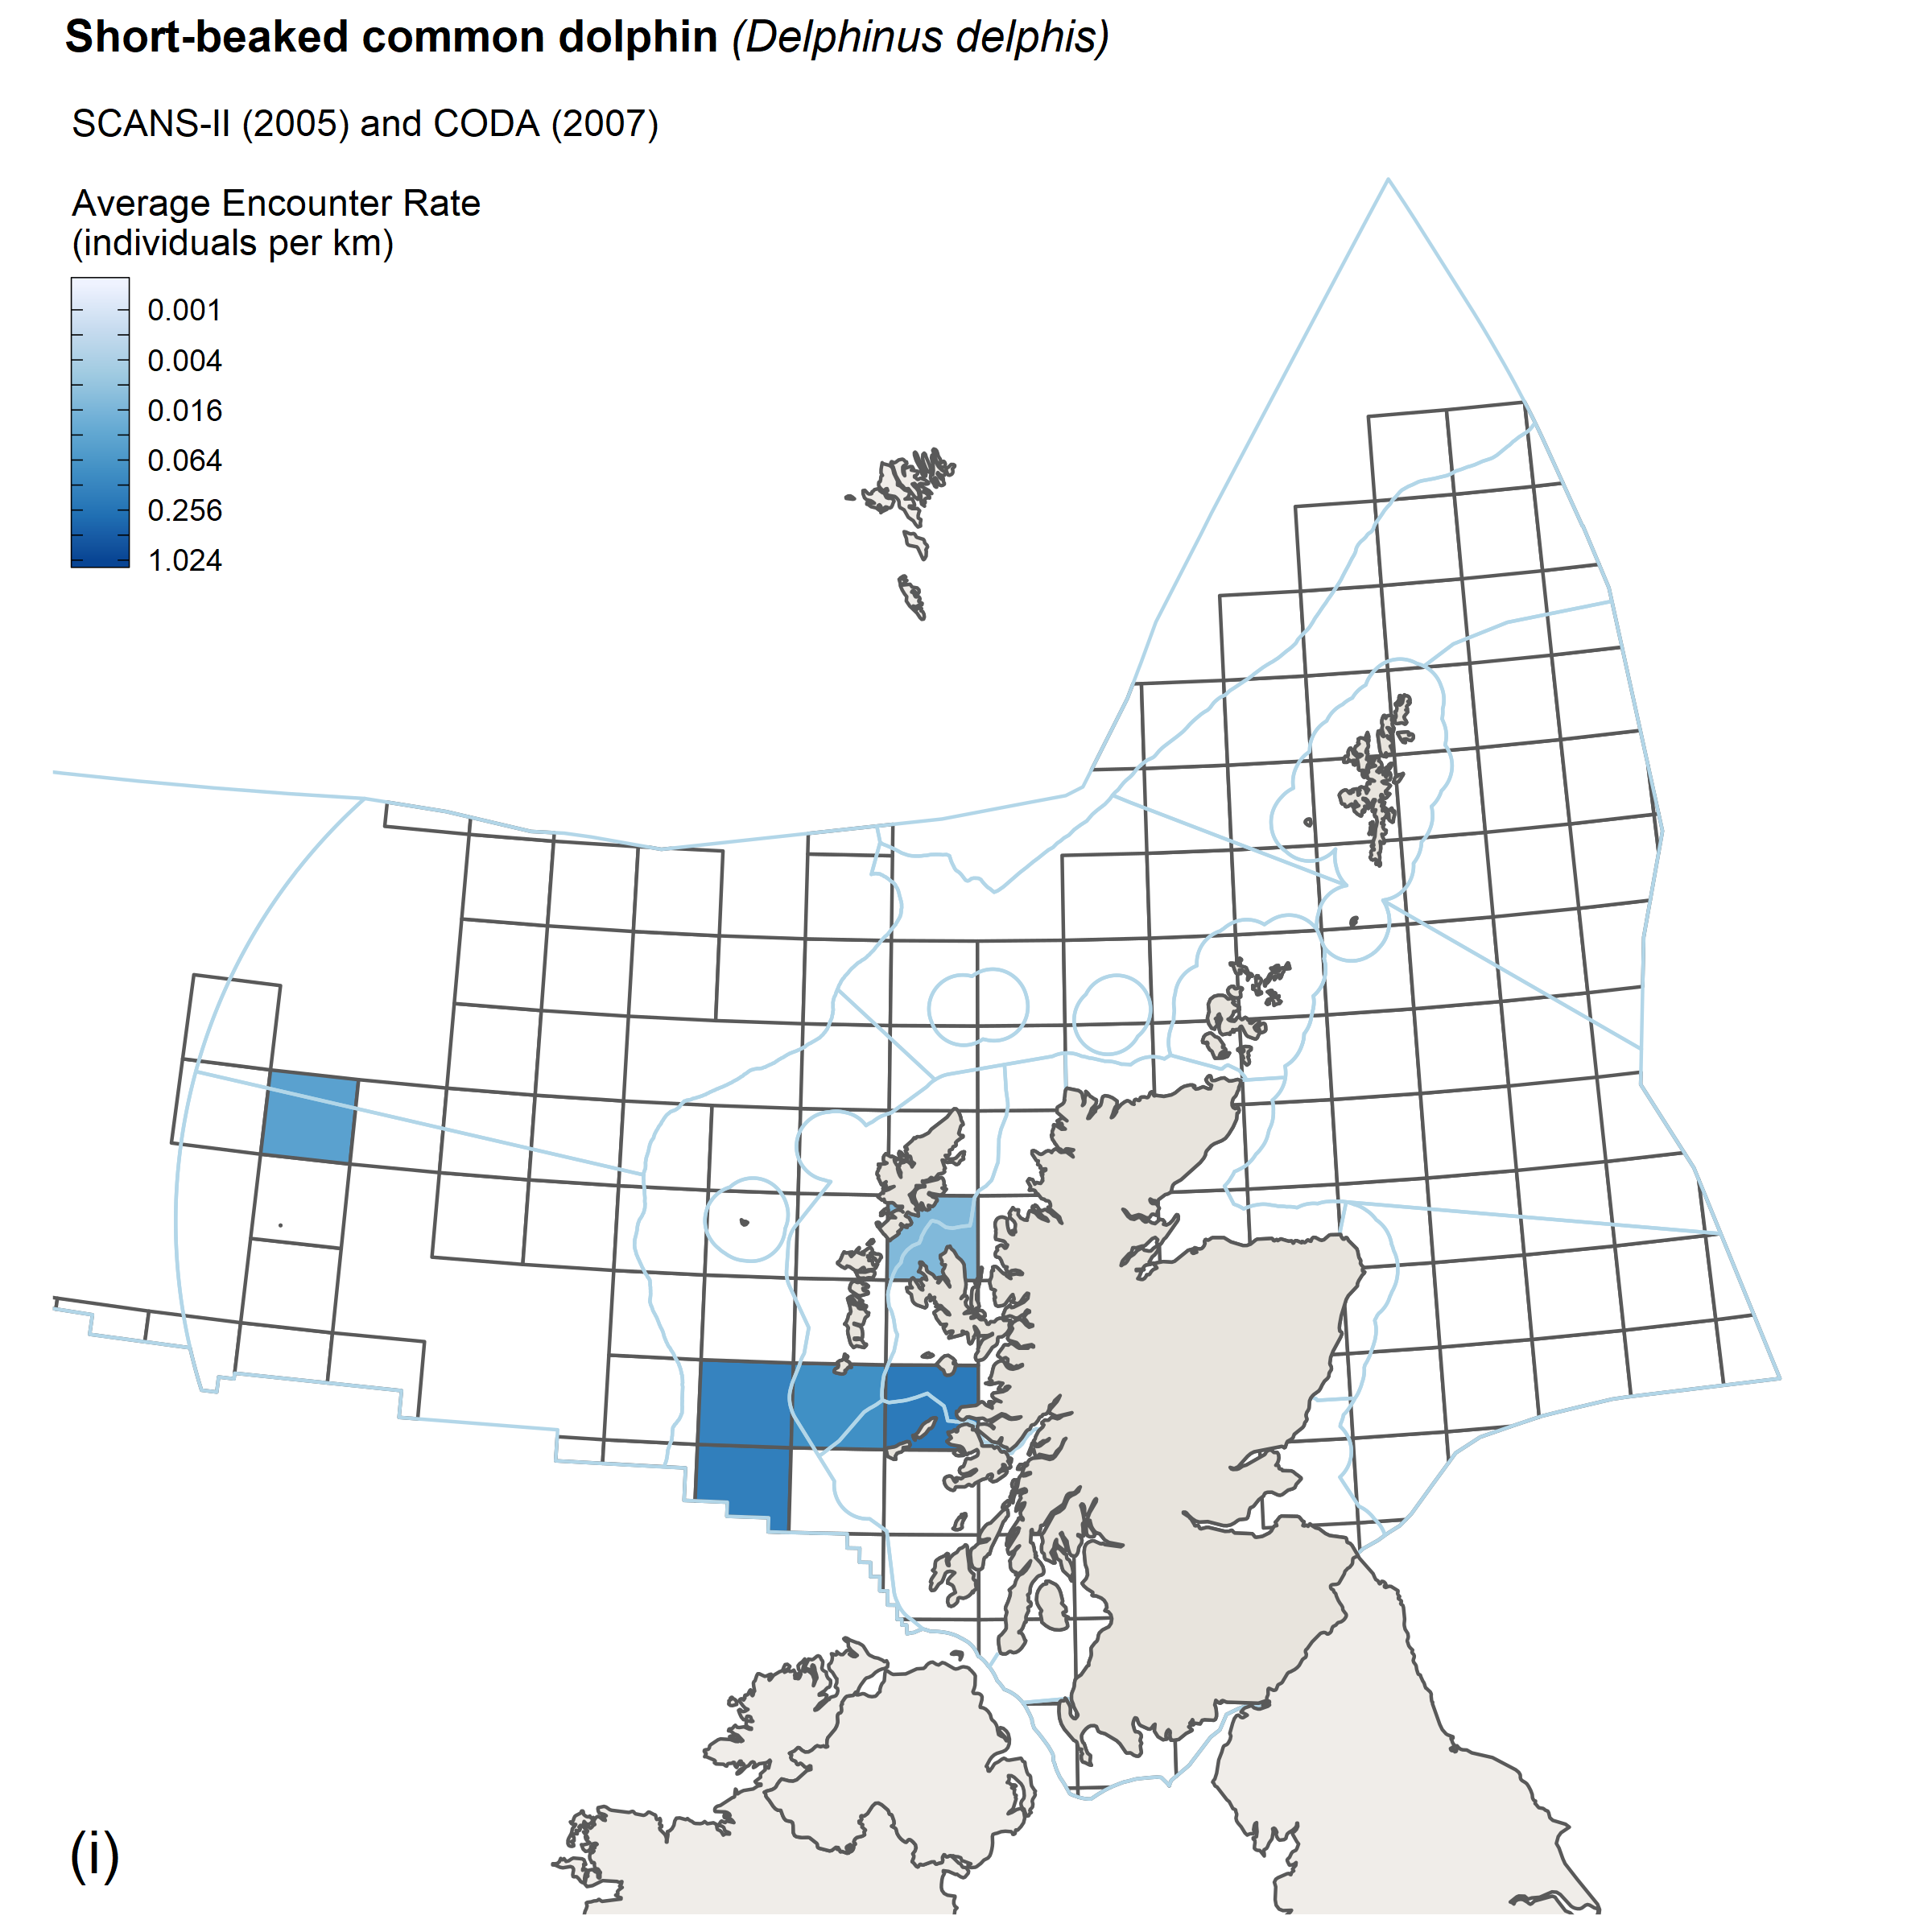
Short-beaked common dolphin
The observed distribution of common dolphins in 2016 was similar to that observed in SCANS-II (Hammond et al., 2013) and CODA in 2005/07 (CODA, 2009). The distribution of common dolphins appears to be strongly concentrated in shelf waters, but a substantial number of unidentified sightings were also made in offshore waters, at least some of which were likely to have been common dolphins. The estimates of abundance in 2016 of 468,000 (CV = 0.26) common dolphin, 372,340 (CV = 0.33) striped dolphin and 158,000 (CV = 0.19) unidentified common or striped dolphins sum to almost one million animals. These estimates are substantially larger than the estimates for 2005/2007 of 174,000 (CV = 0.27).
 |
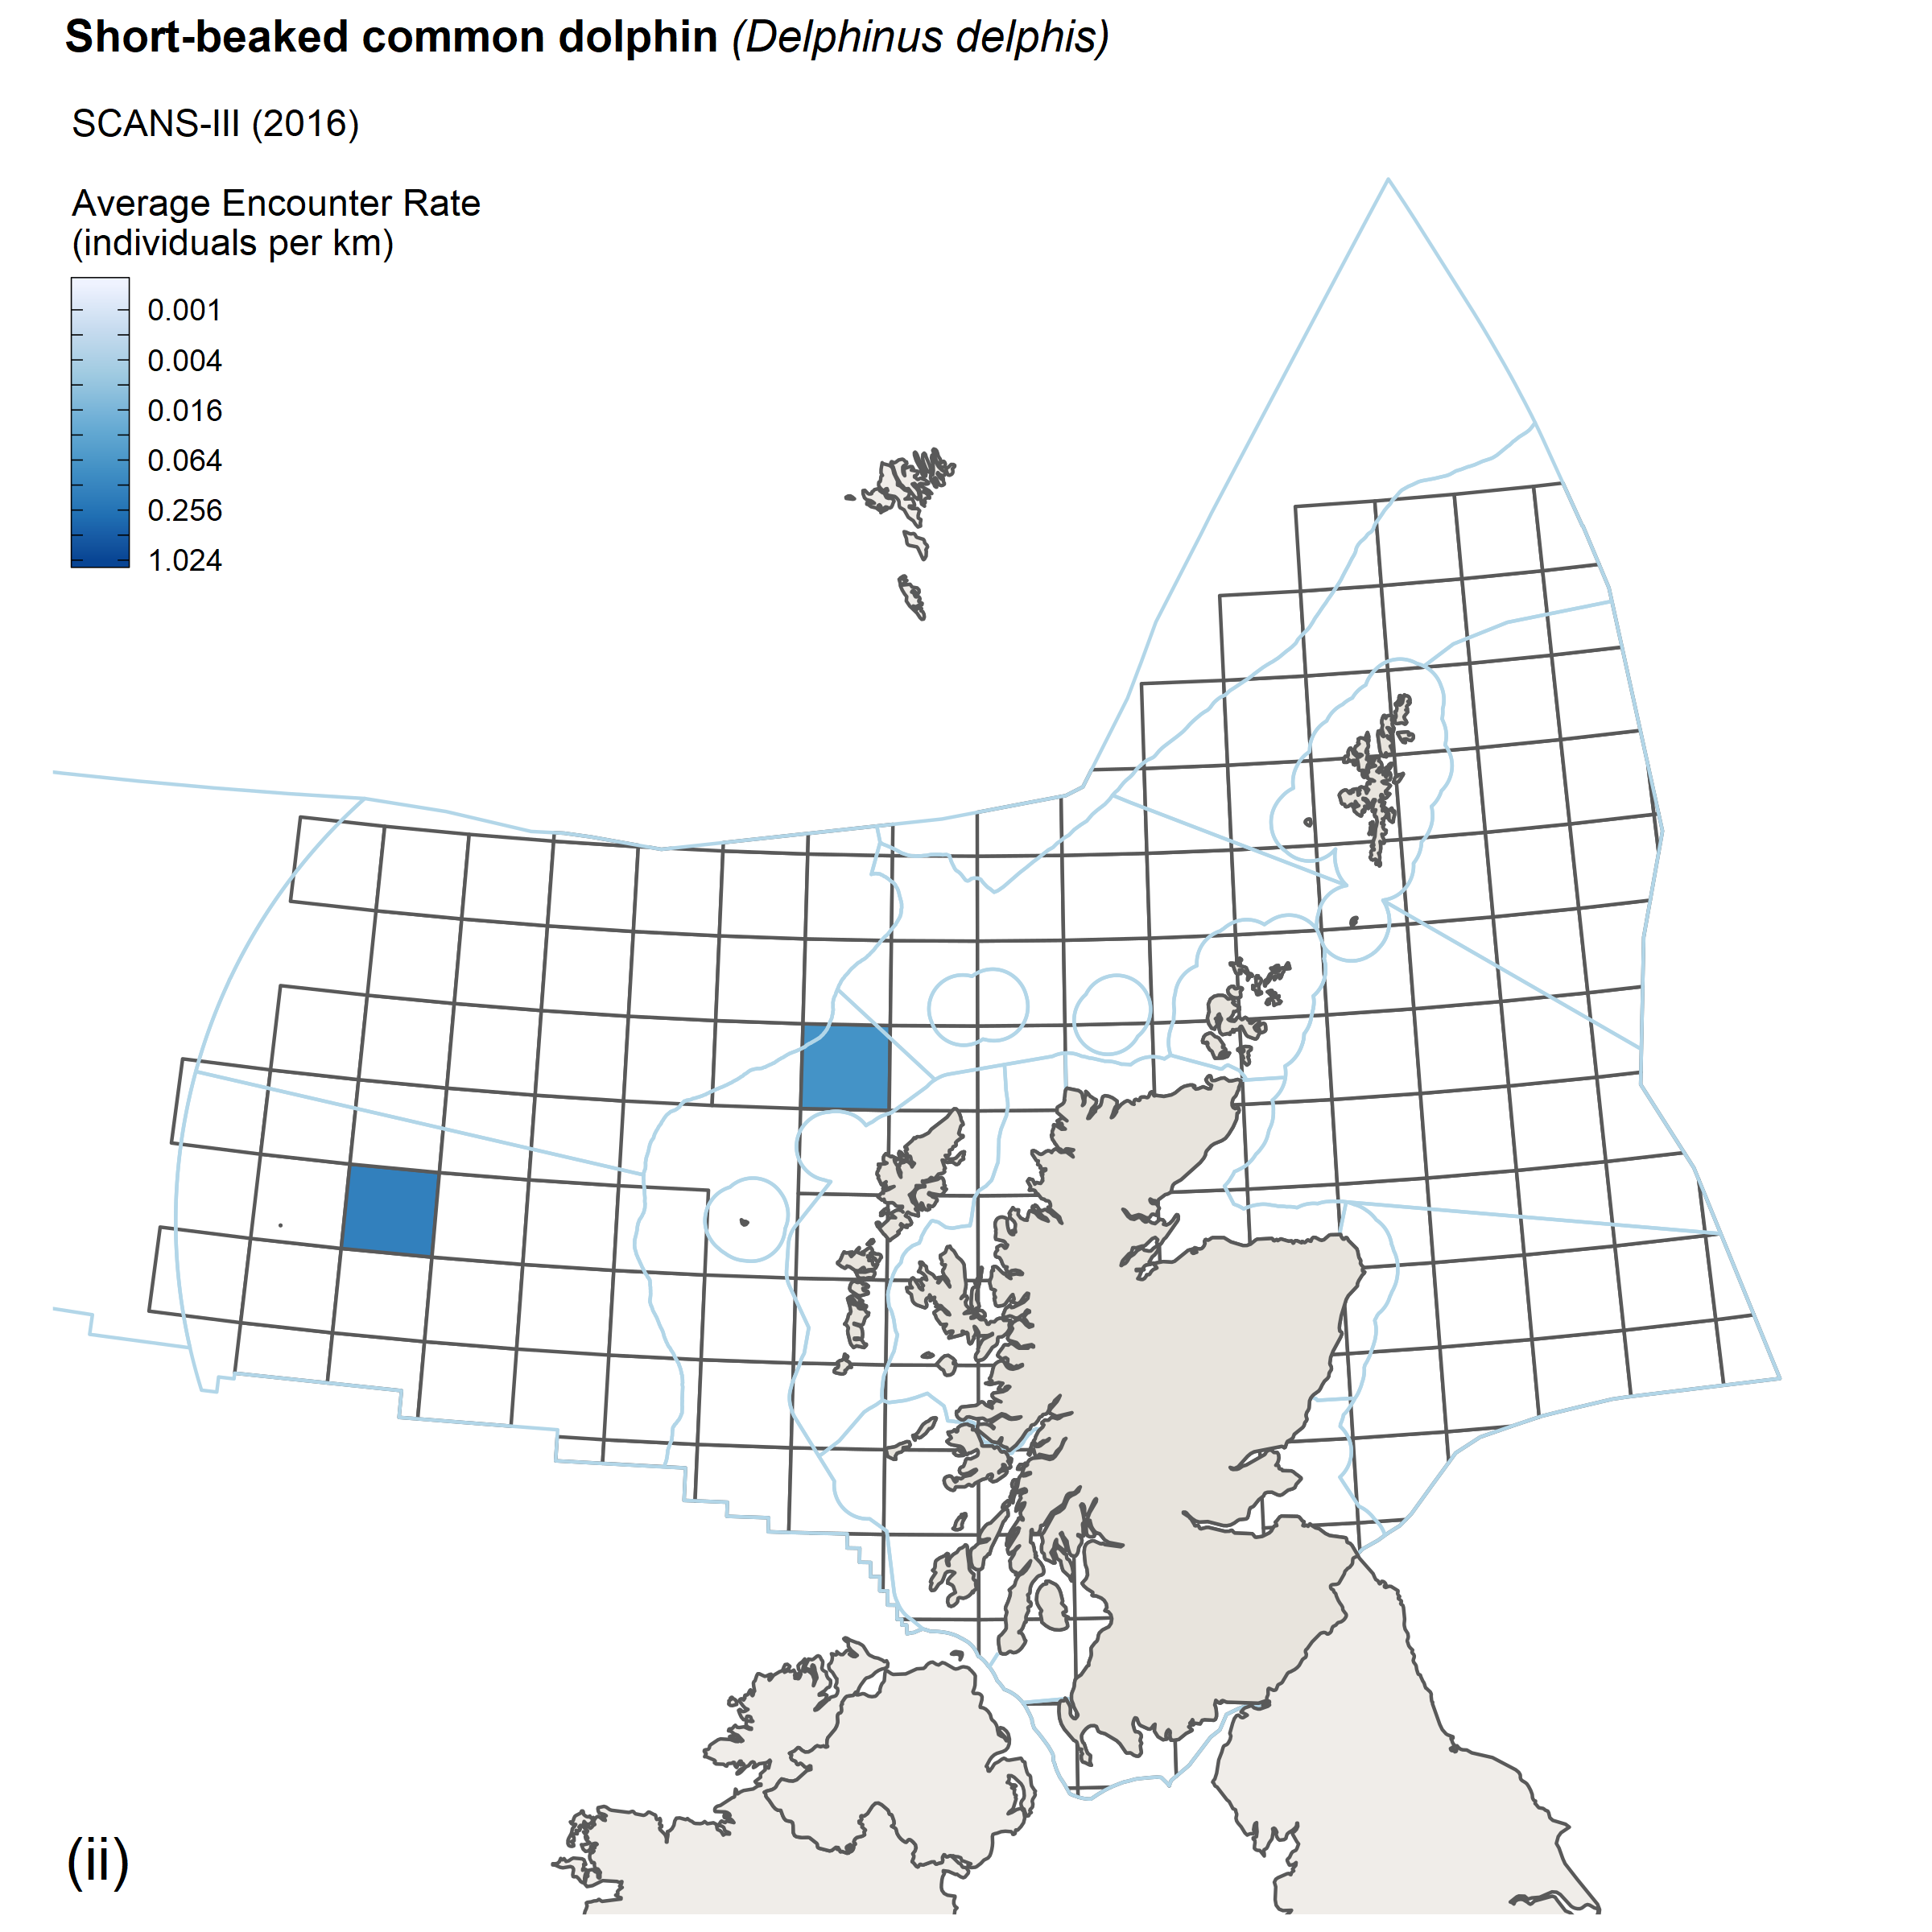 |
| Figure d: Encounter rates for short-beaked common dolphin from (i) SCANS II/CODA survey, 2005/2007 and (ii) SCANS III survey, 2016. |
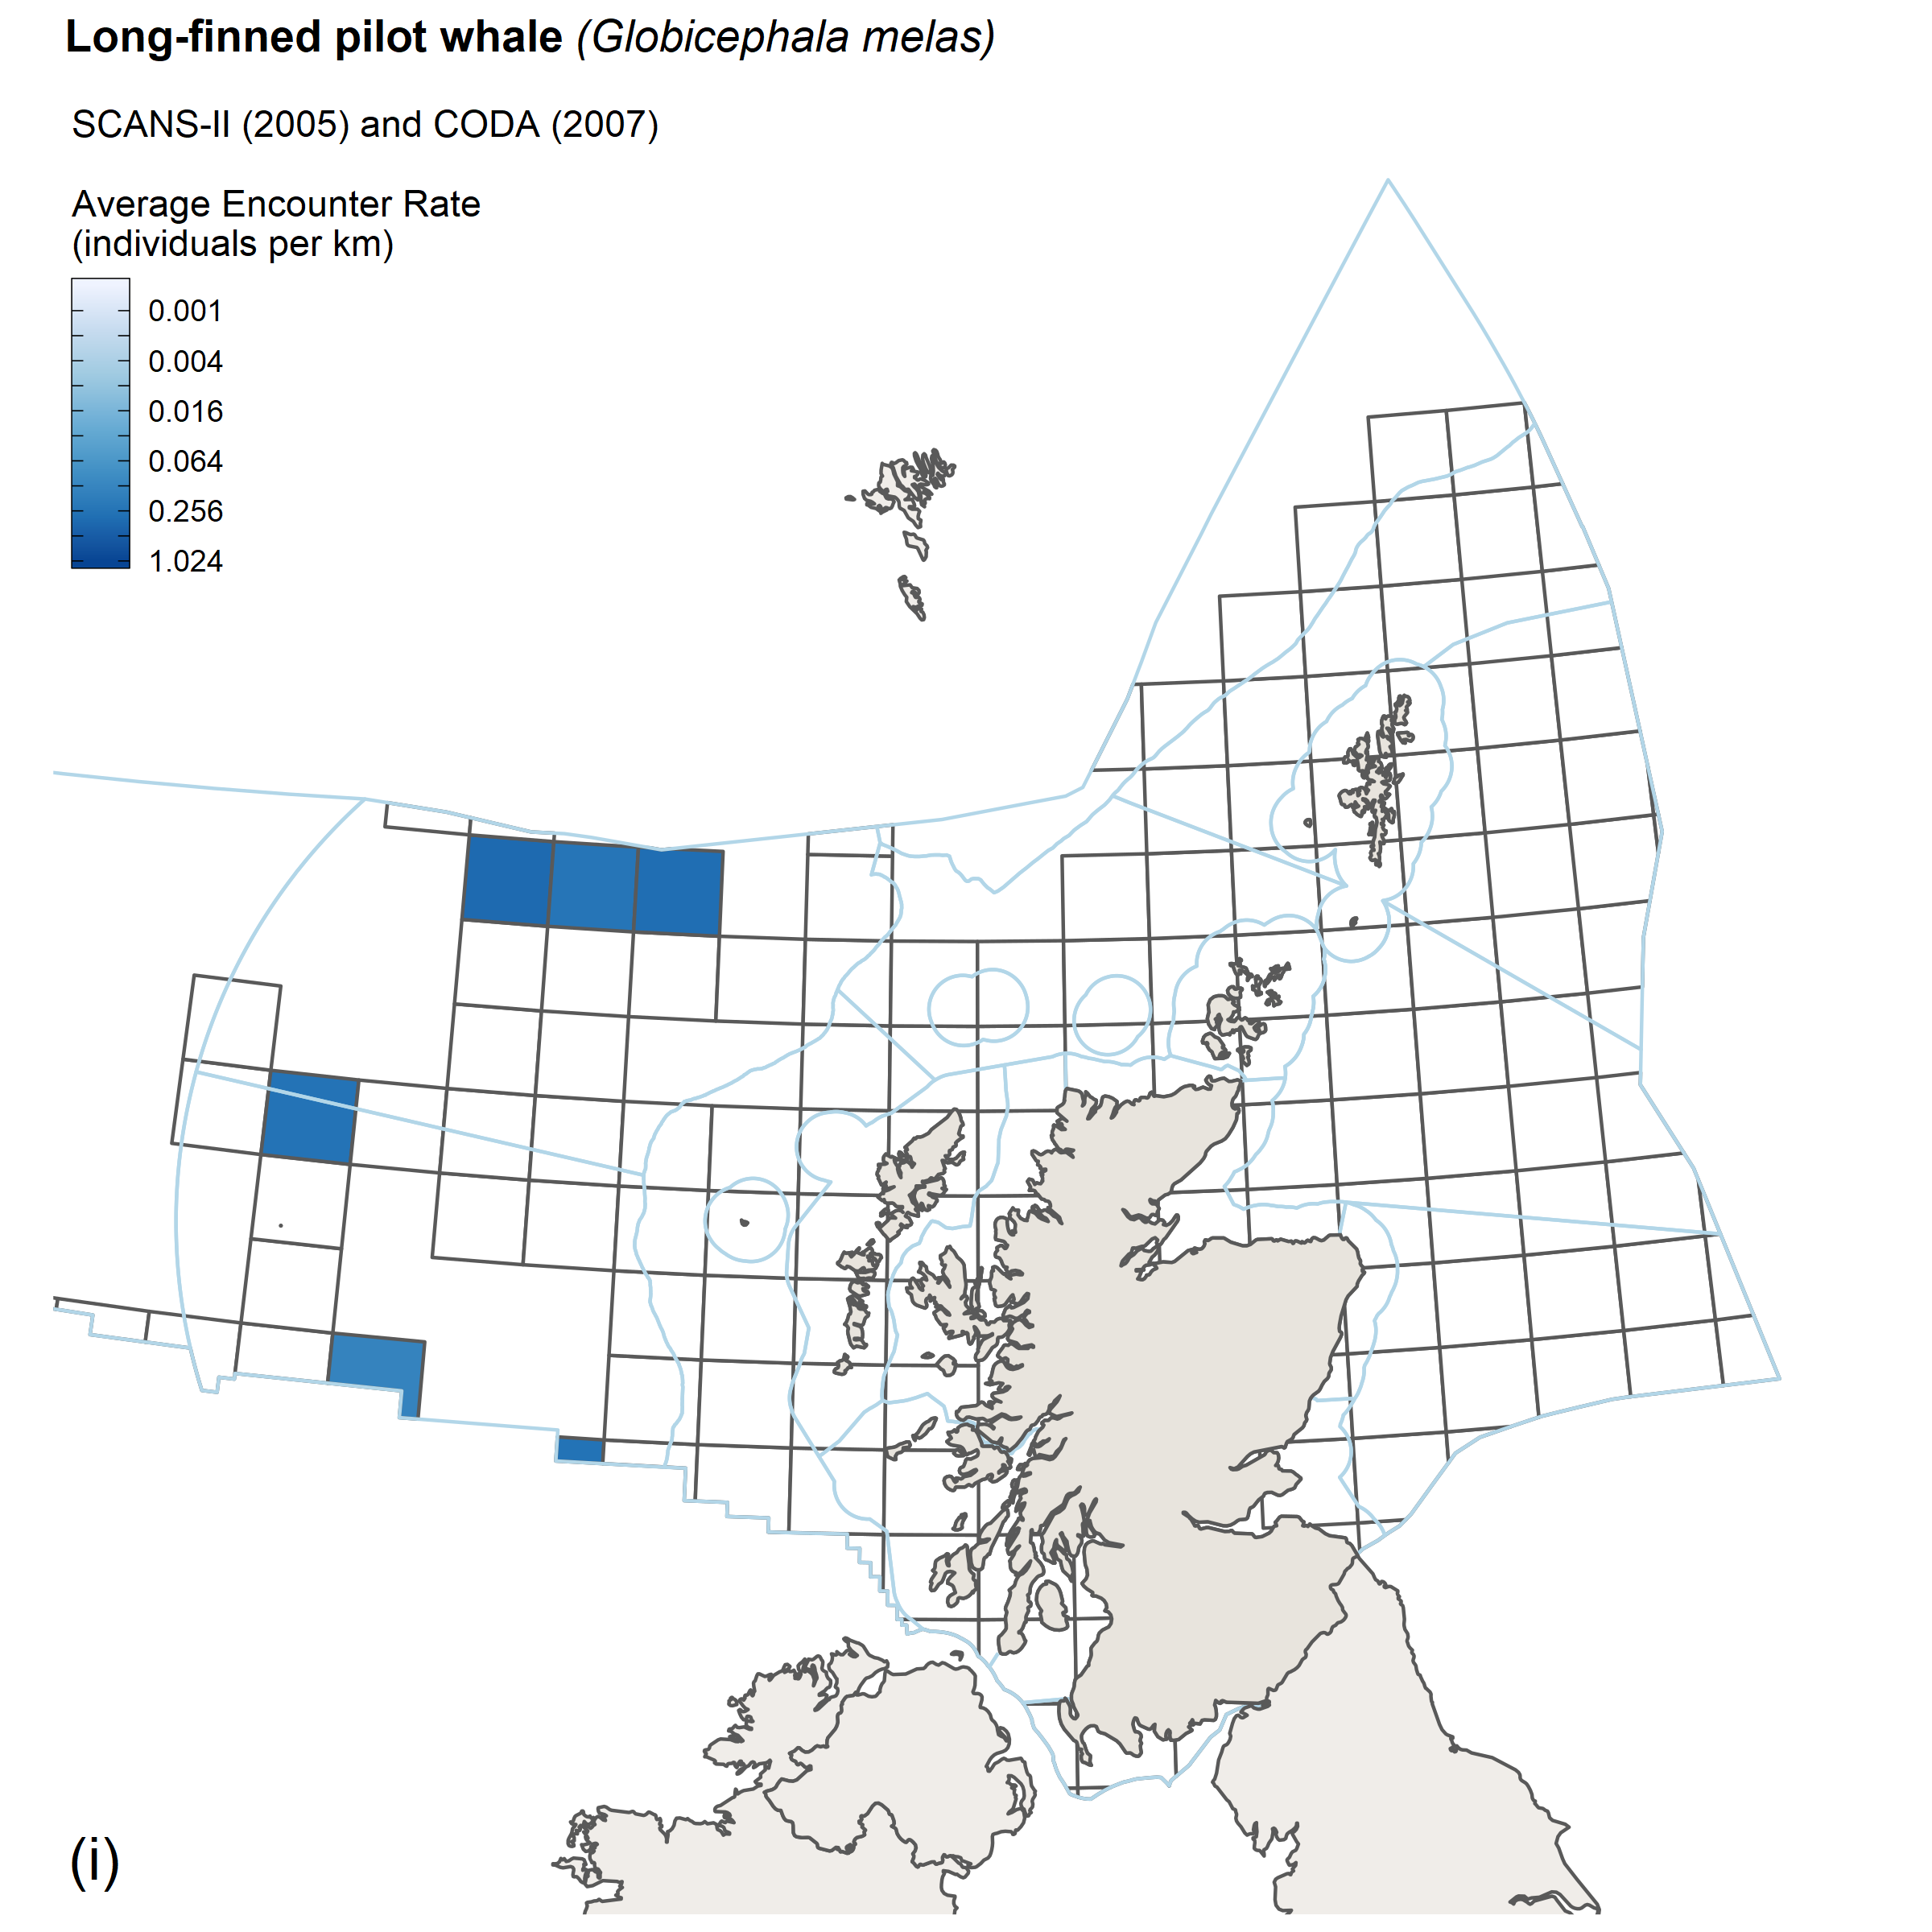
Long-finned pilot whale
The observed distribution of pilot whales was similar in 2016 to that observed in SCANS-II and CODA in 2005/07 (Rogan et al., 2017).
 |
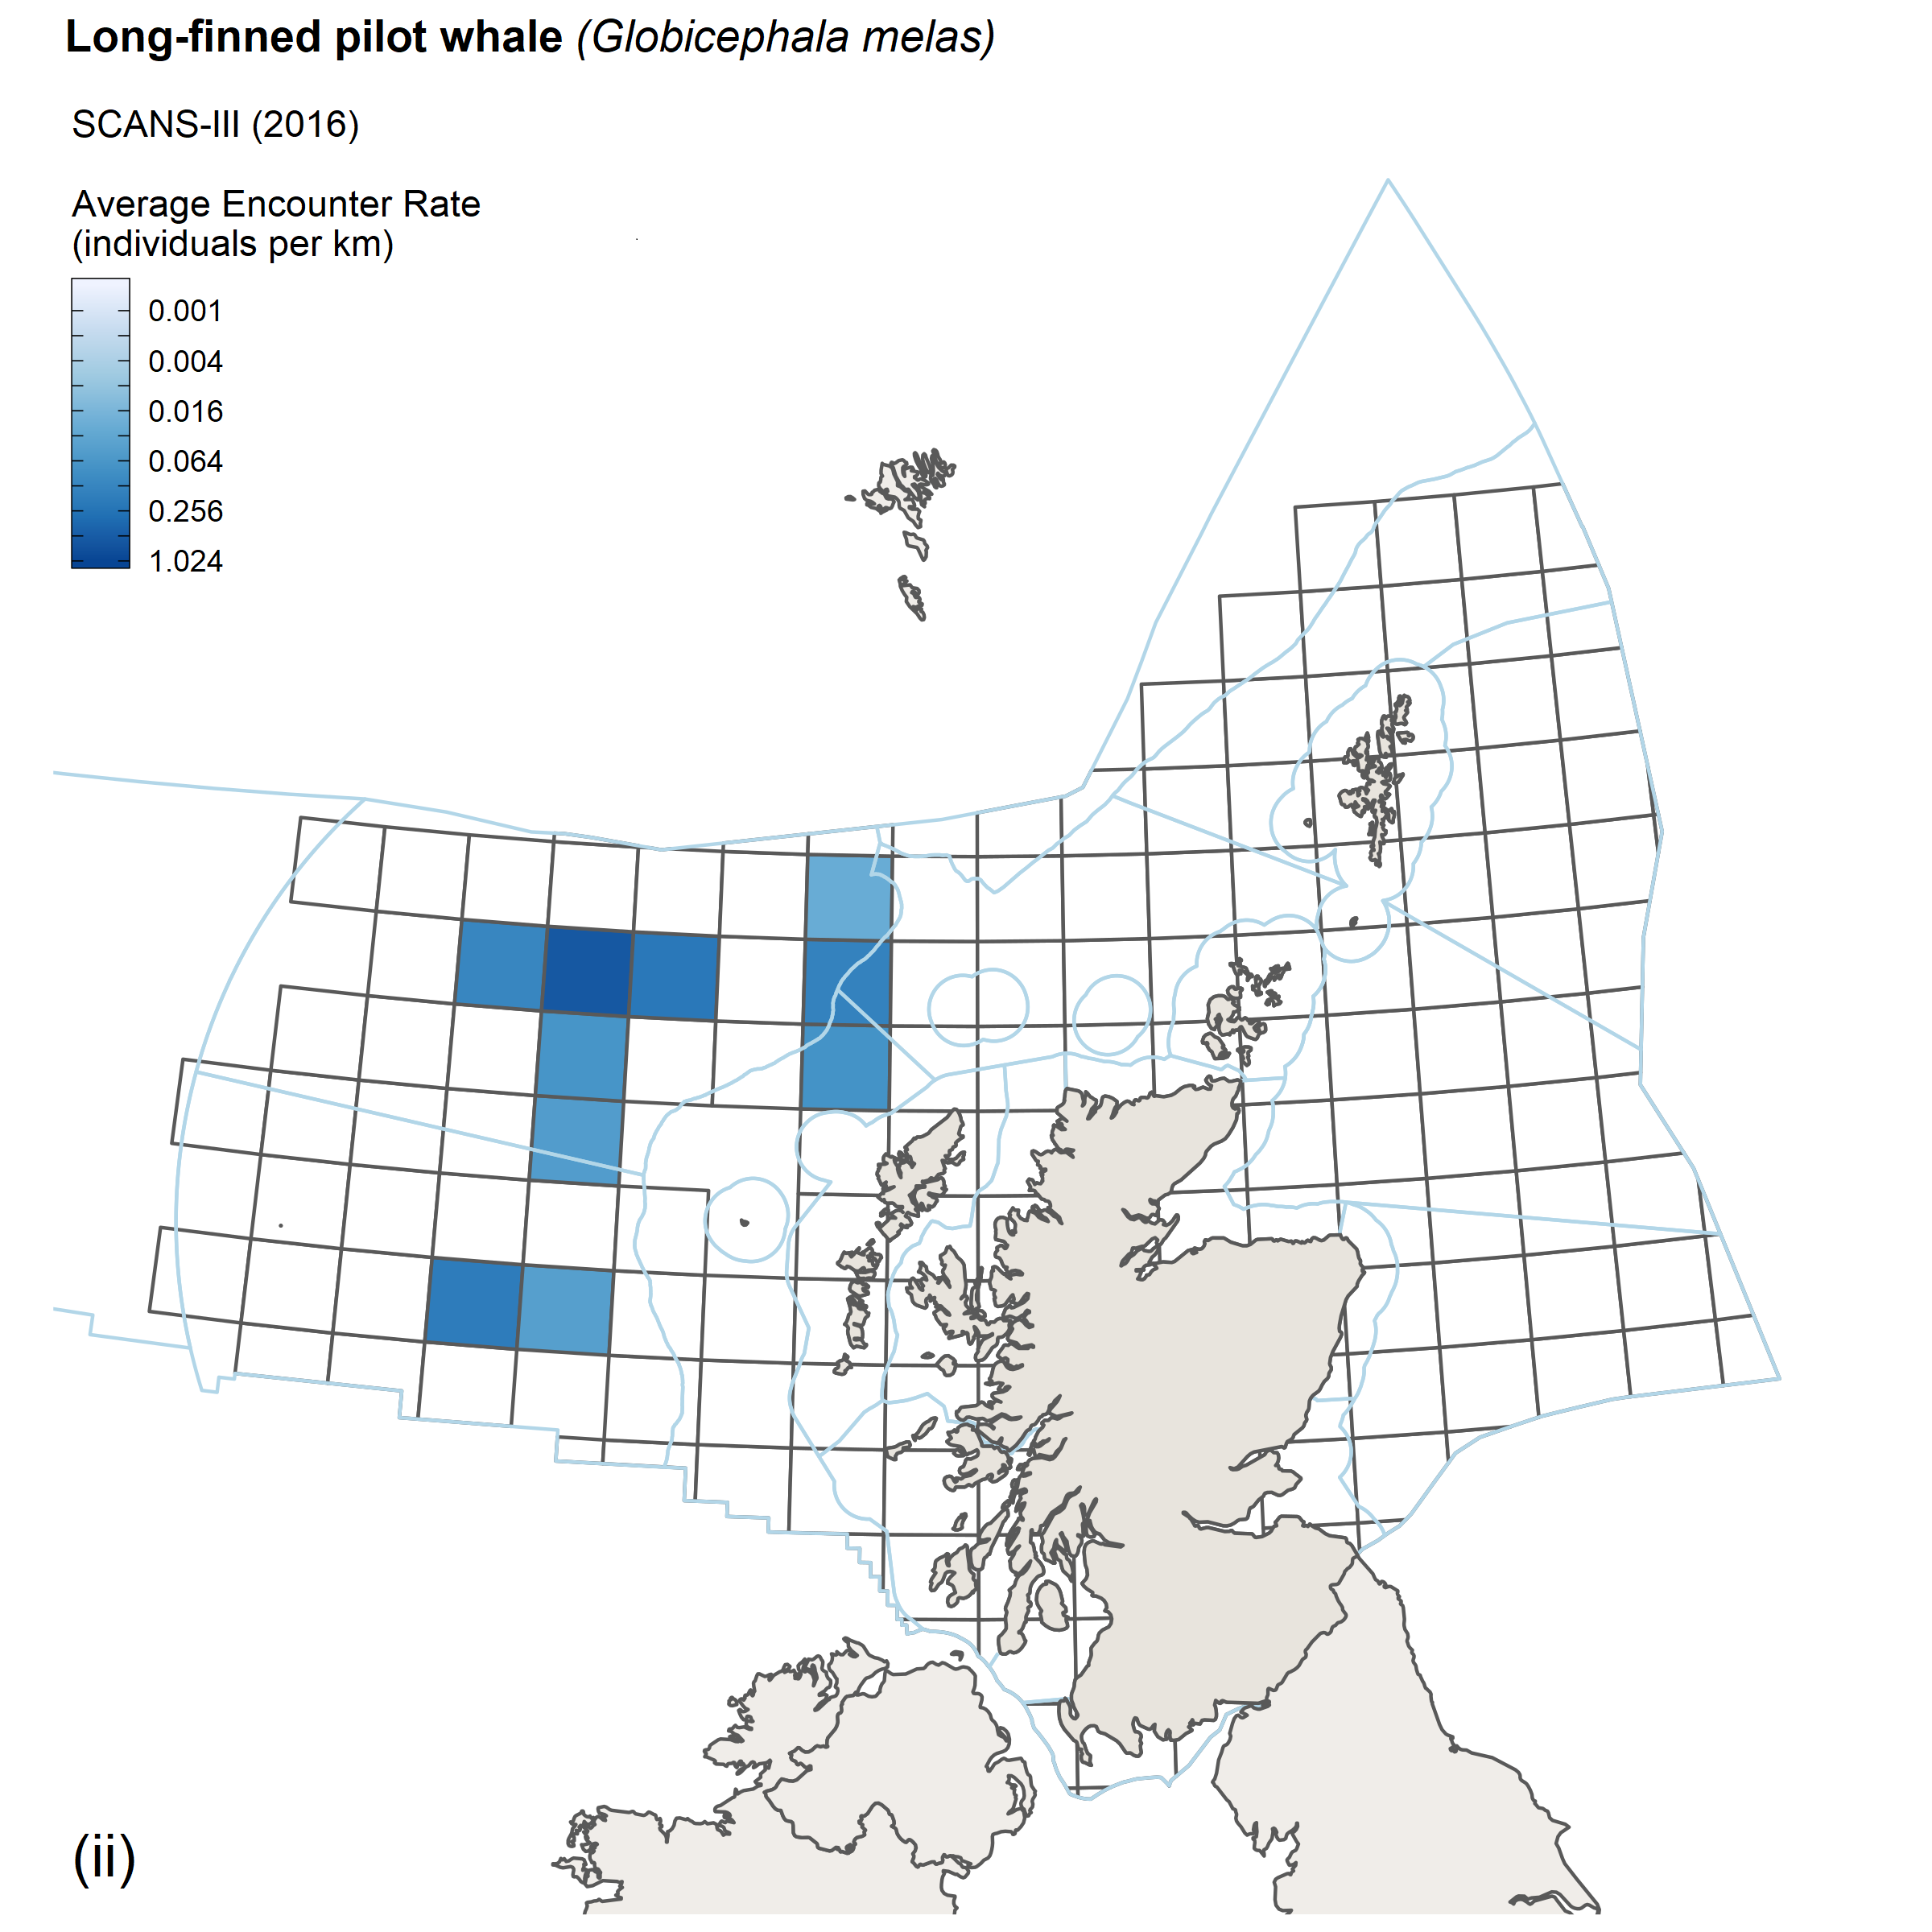 |
| Figure e: Encounter rates for long-finned pilot whale from (i) SCANS II/CODA survey, 2005/2007 and (ii) SCANS III survey, 2016. |
Beaked whales (all species)
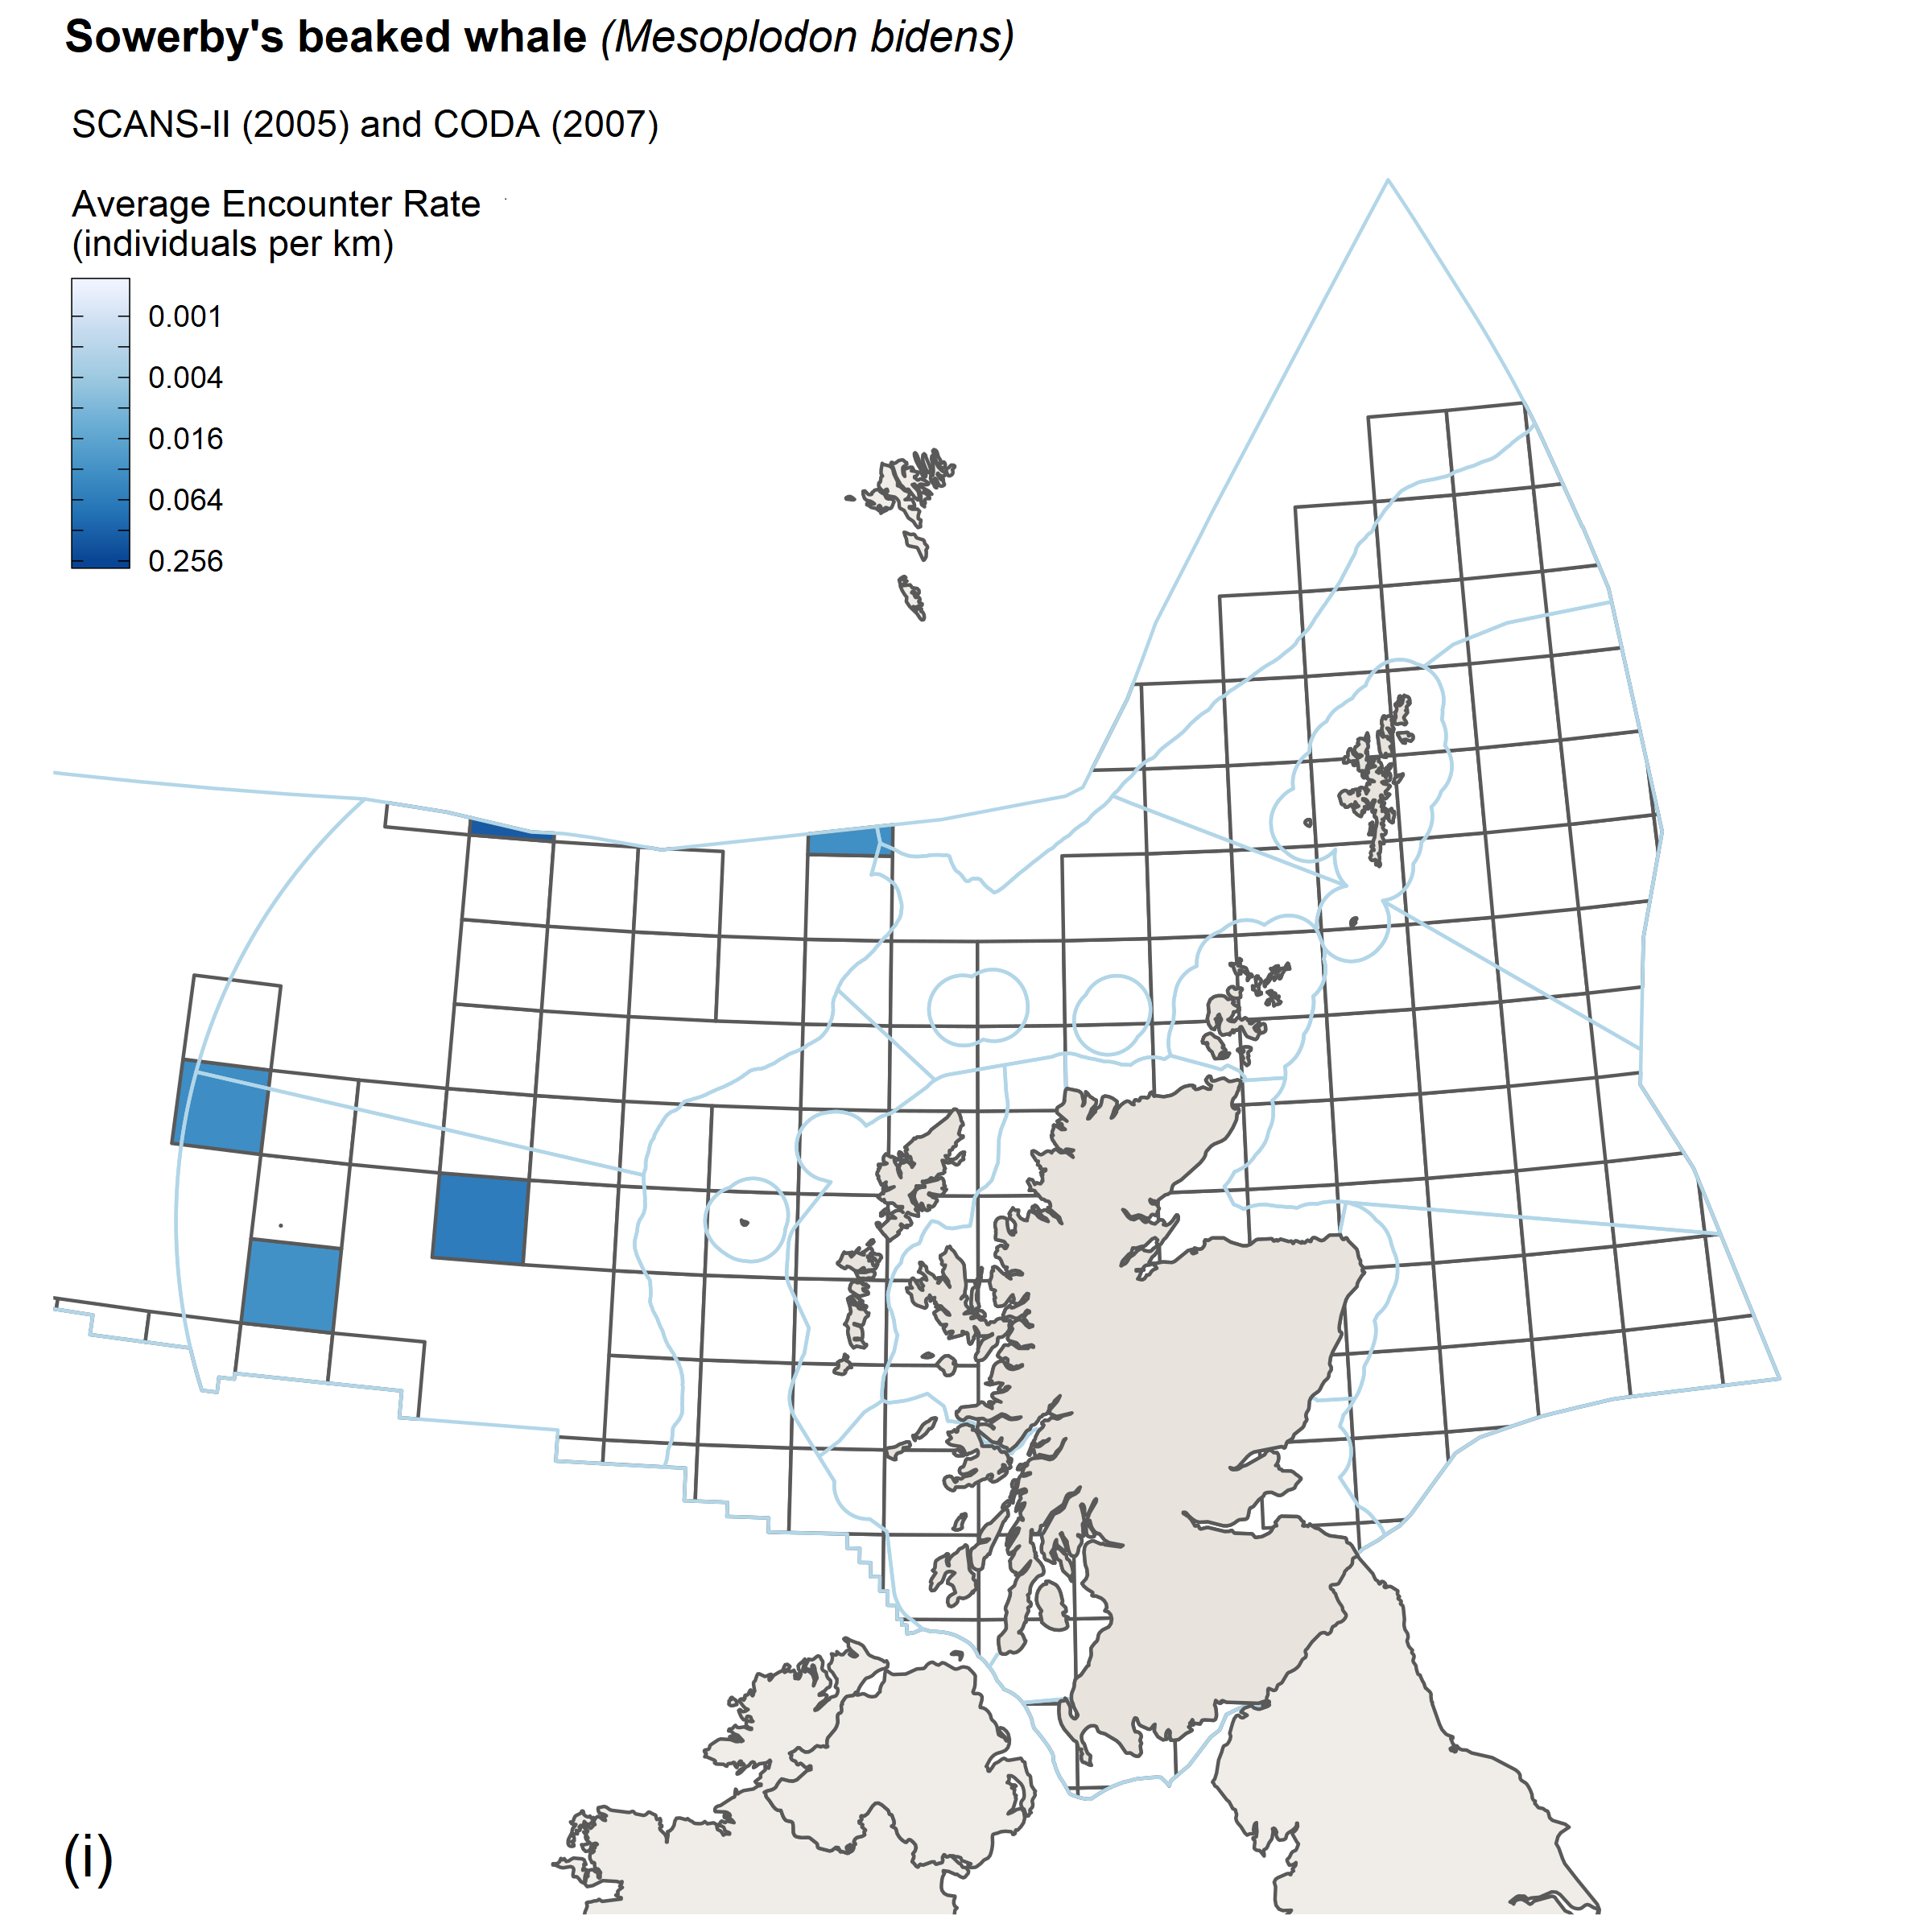
The observed distribution of beaked whales was similar in 2016 to that observed in CODA in 2007 (CODA, 2009; Rogan et al., 2017) and from opportunistic sightings (WGMME, 2016). Of some note is the recent high number of stranded beaked whales found on the Western Isles. Between August and November 2018, 98, mainly Cuvier’s beaked whales, have been found stranded, the highest number ever reported. The cause of this stranding event is still being investigated by the Scottish Marine Animal Strandings Scheme veterinary pathologists, but anthropogenic factors, such as underwater noise, cannot be ruled out. Maps for northern bottlenose whale and Sowerby’s beaked whale cover the main species of beaked whale in Scottish waters.
 |
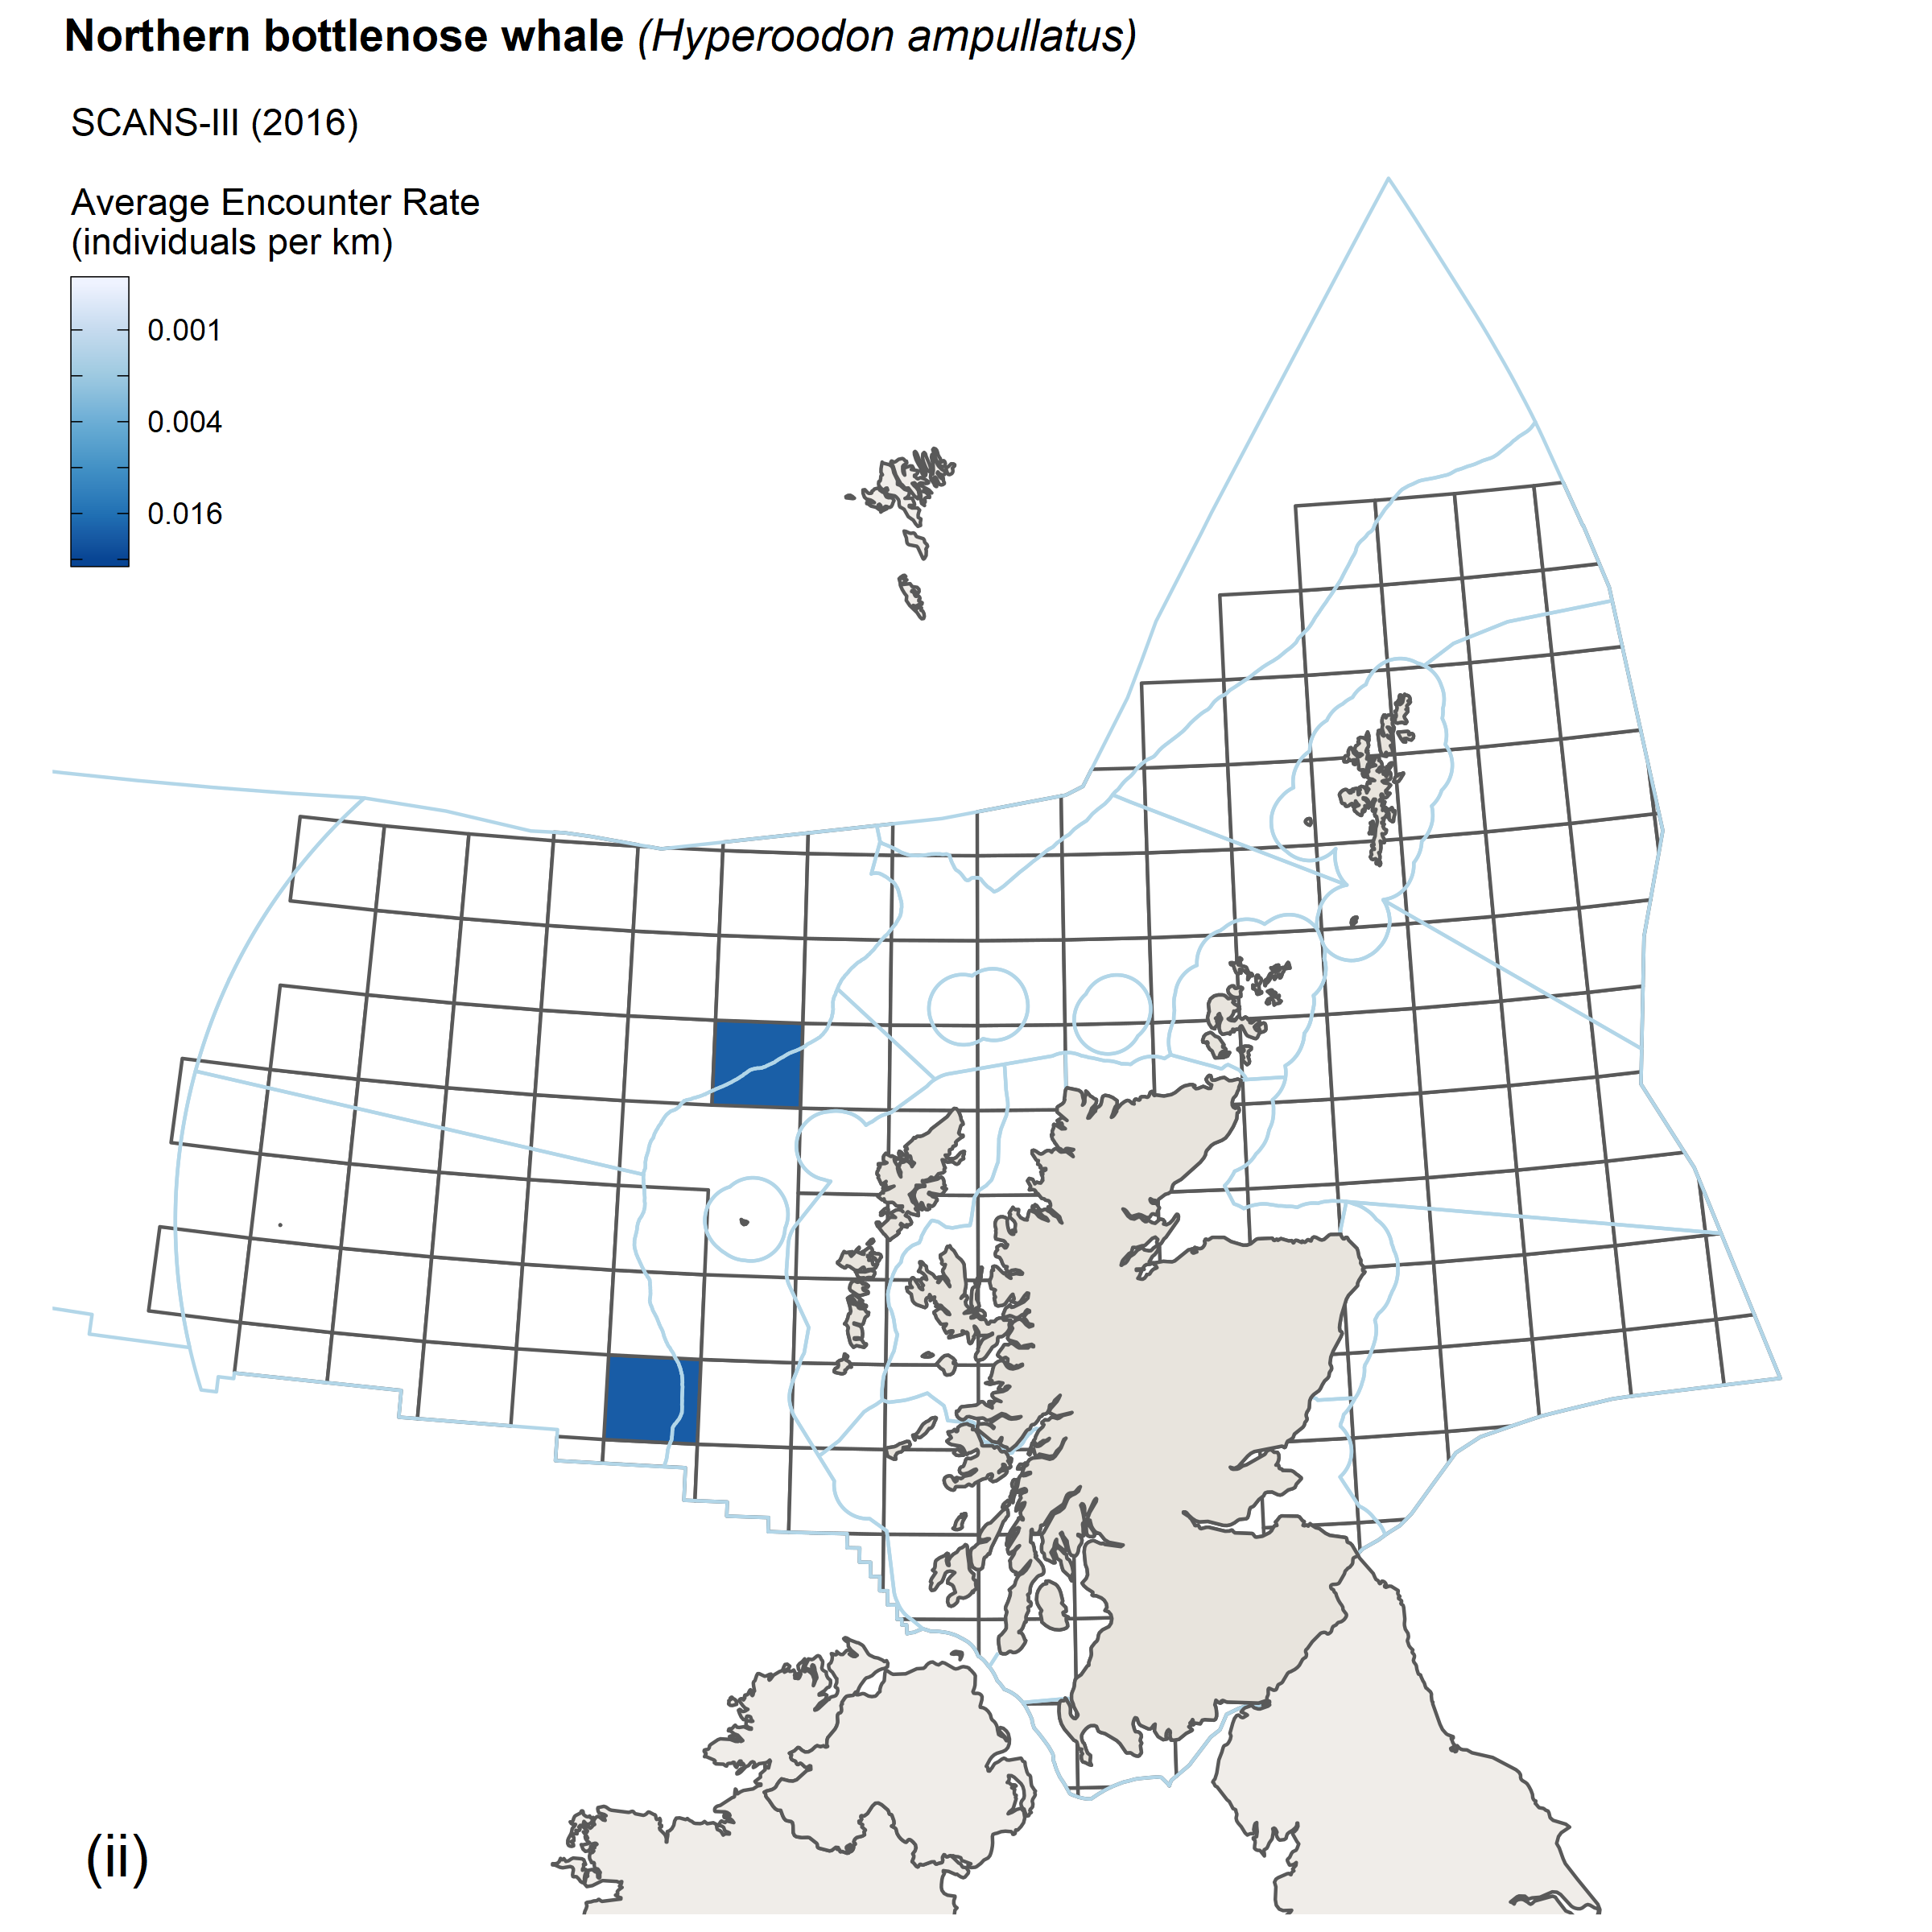 |
| Figure f: Encounter rates for northern bottlenose whale from (i) SCANS II/CODA survey, 2005/2007 and (ii) SCANS III survey, 2016. |
 |
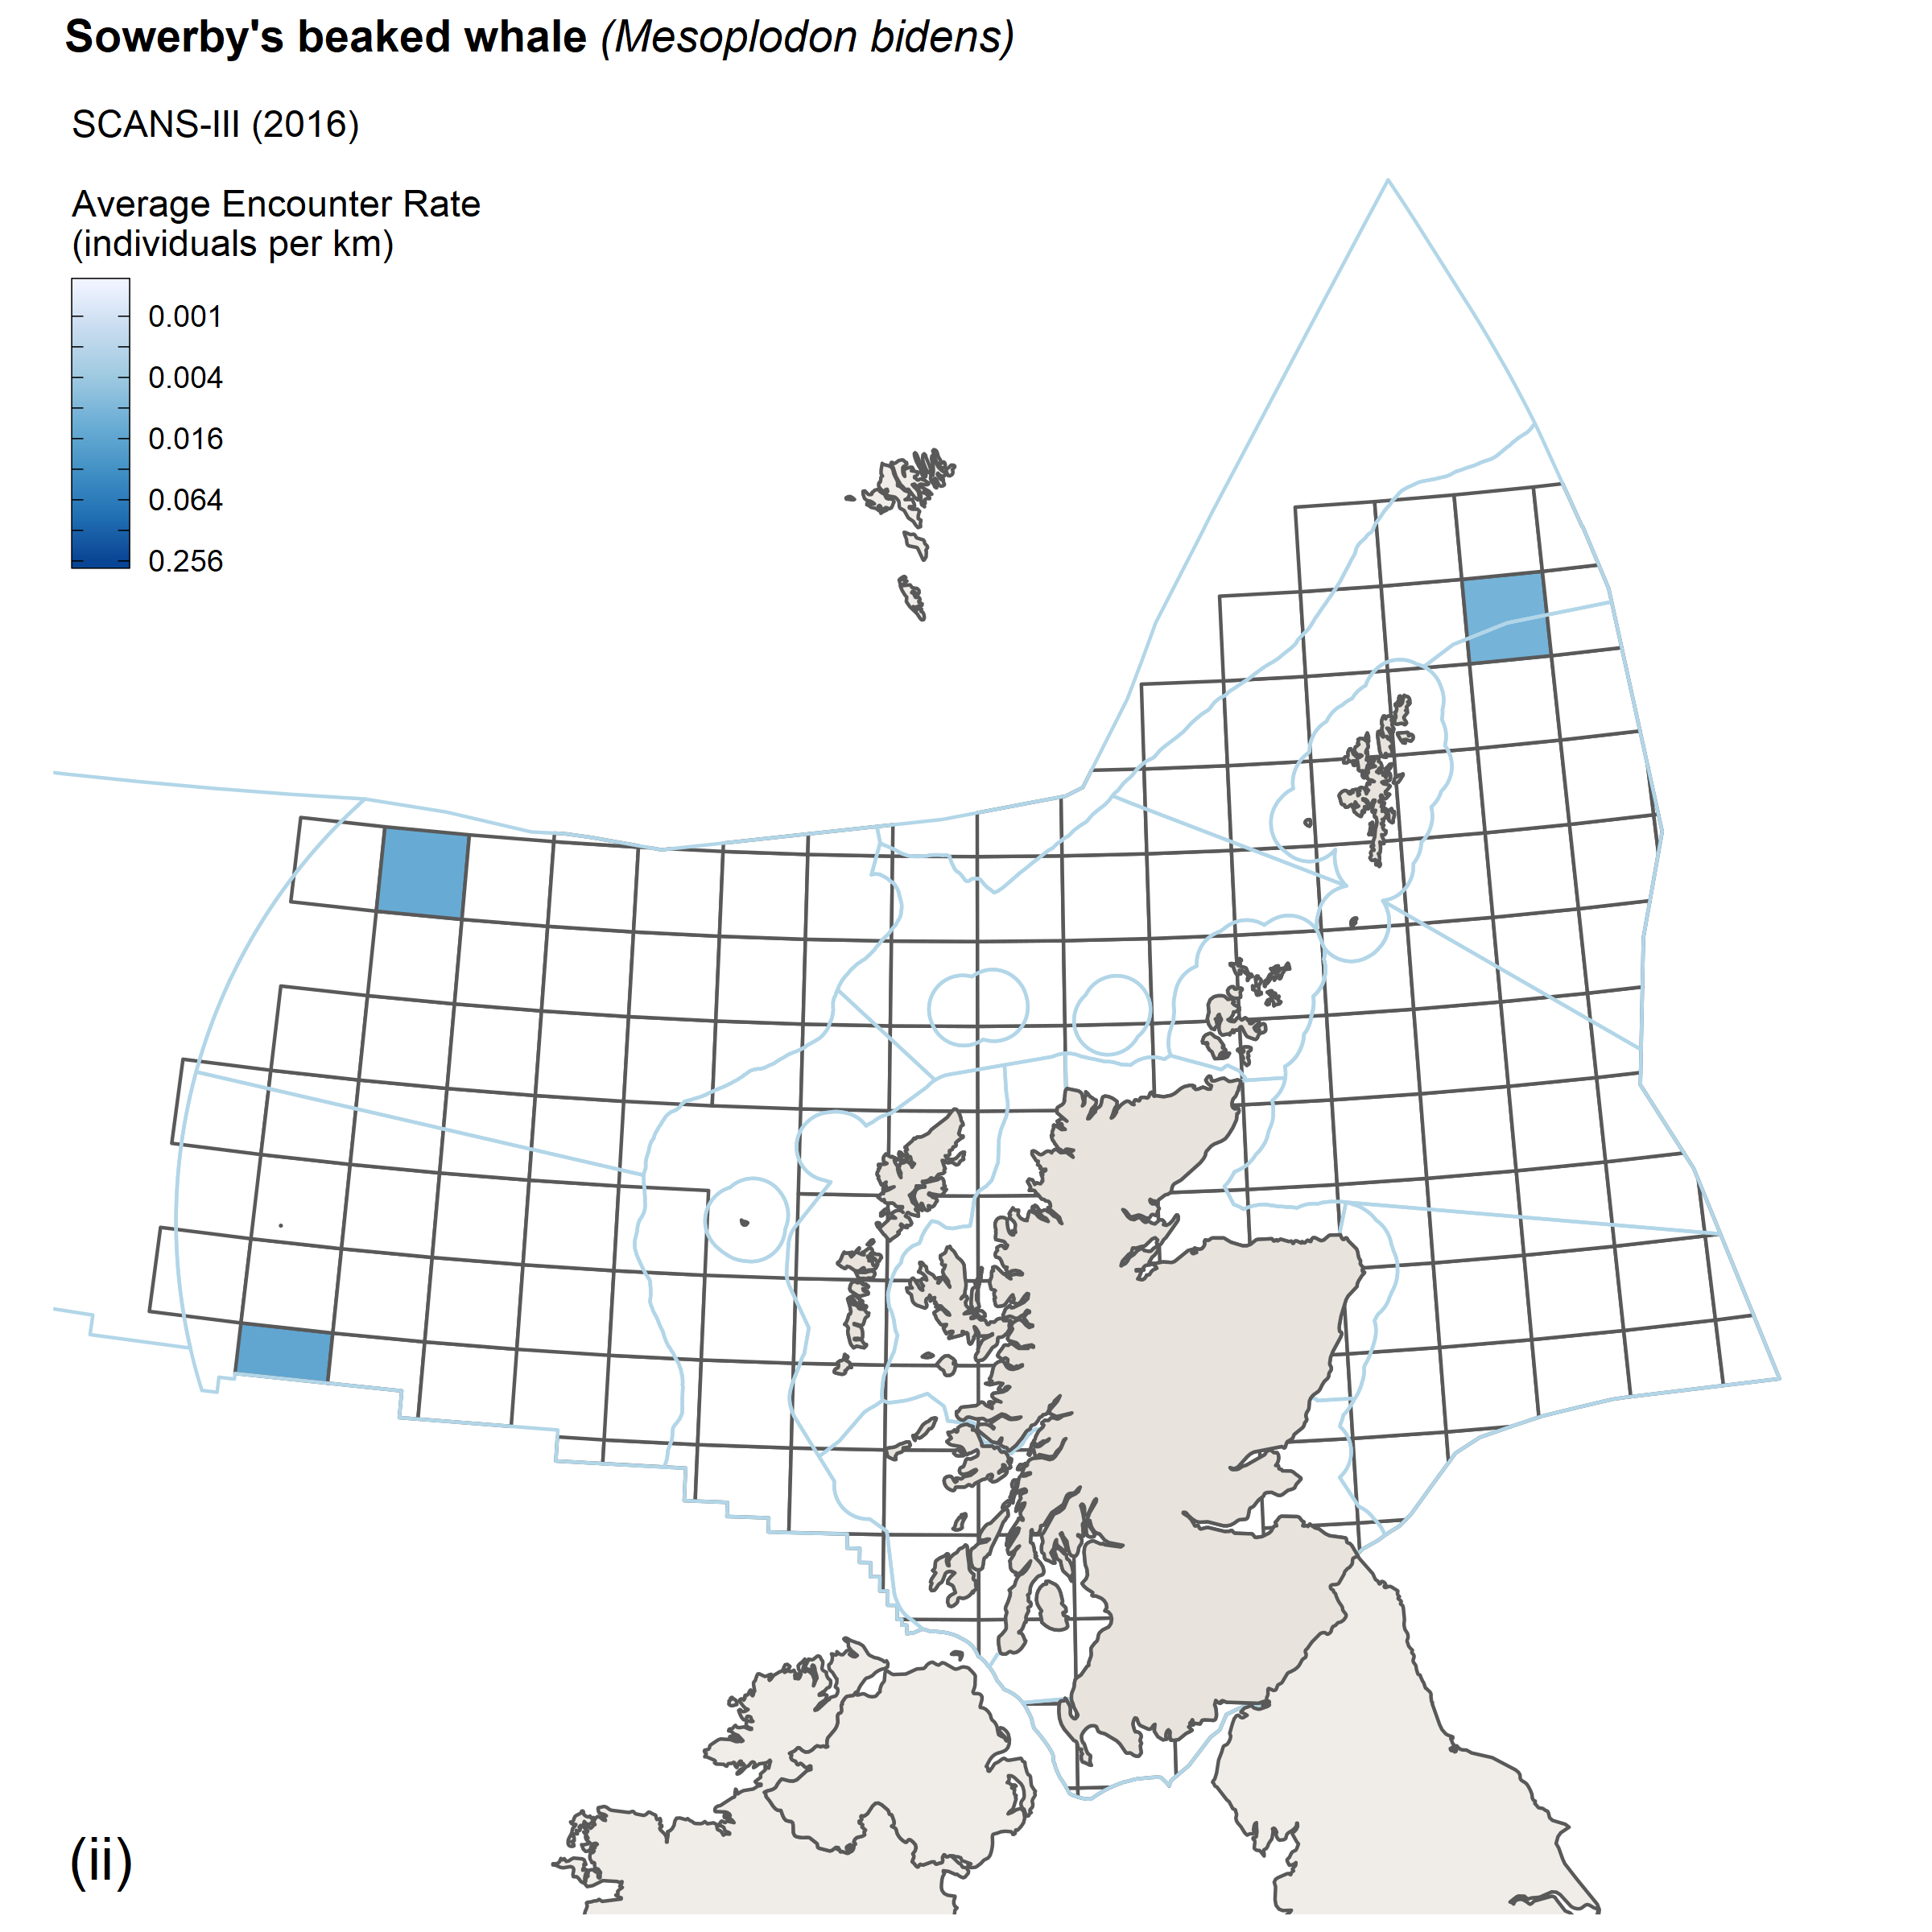 |
| Figure g: Encounter rates for Sowerby’s beaked whale from (i) SCANS II/CODA survey, 2005/2007 and (ii) SCANS III survey, 2016. |
Sperm whale
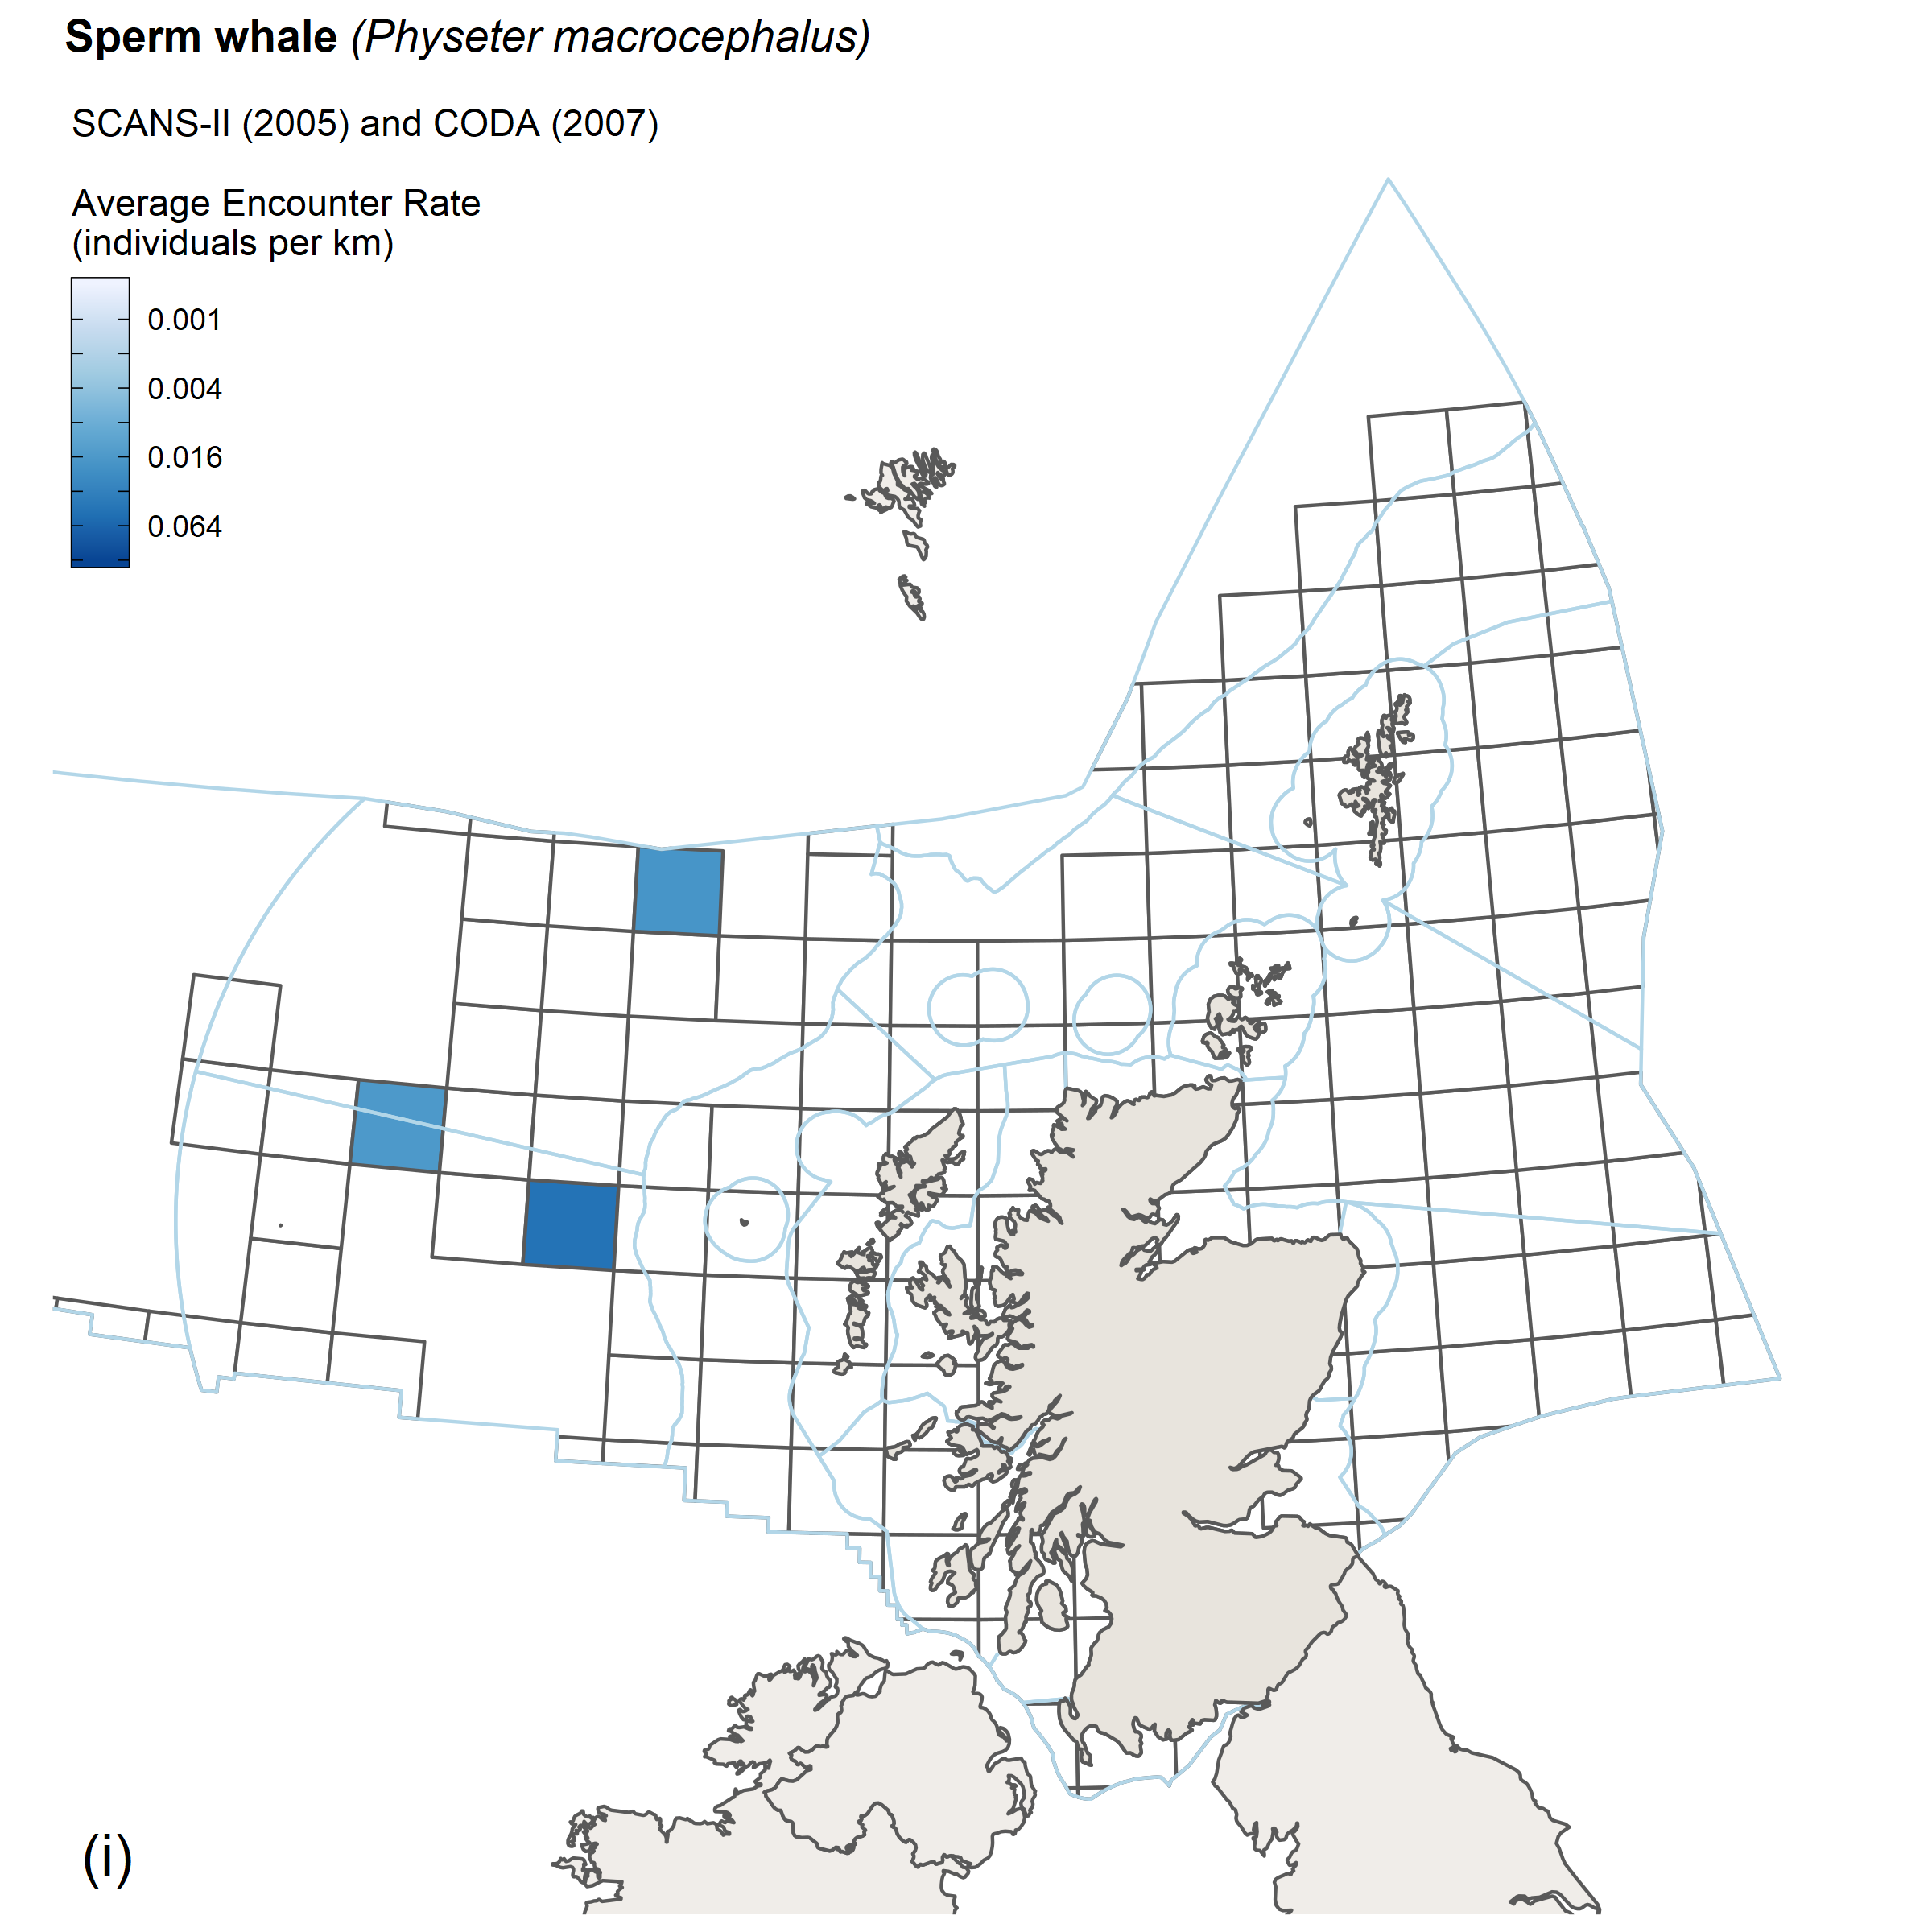
The observed distribution of sperm whales was similar in 2016 to that observed in CODA in 2007 (Rogan et al., 2017). The estimate of abundance in 2016 of 13,500 (CV = 0.41) is larger than the estimate from CODA in 2007 of 2,600 (CV = 0.26) for identified sperm whales and the estimate of 5,600 (CV = 0.32) if a proportion of unidentified large whales is included.
 |
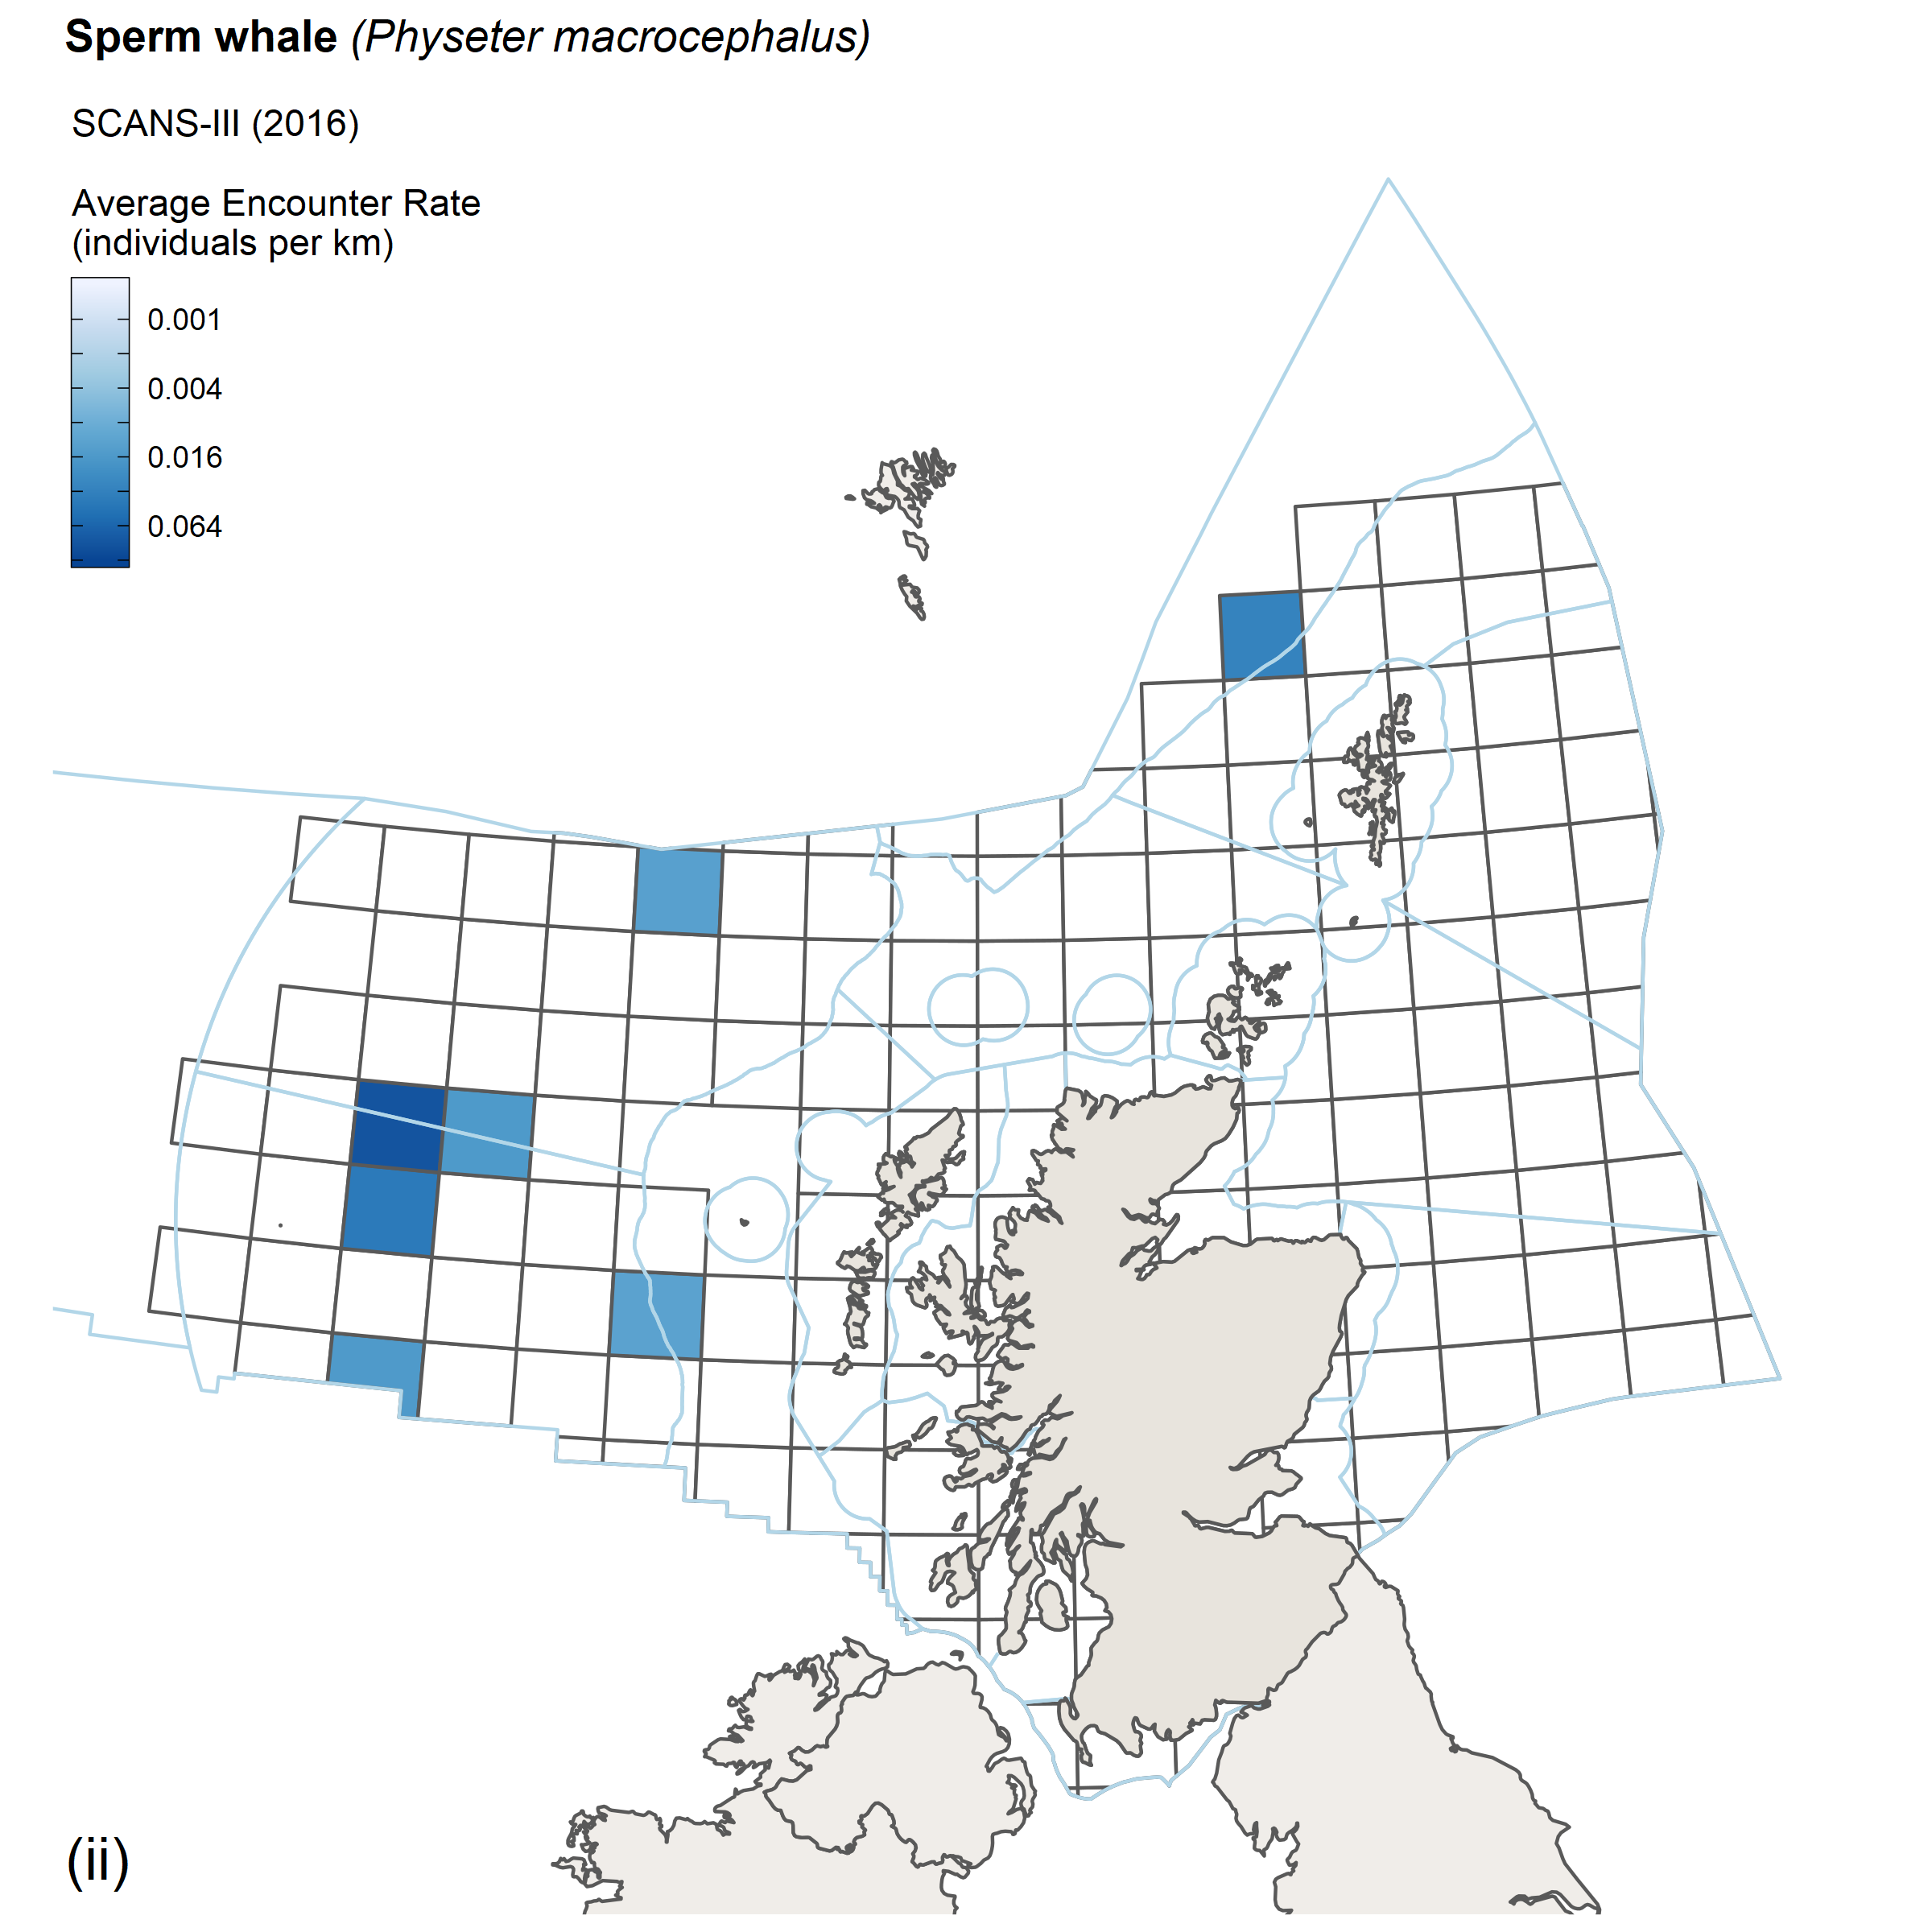 |
| Figure h: Encounter rates for sperm whale from (i) SCANS II/CODA survey, 2005/2007 and (ii) SCANS III survey, 2016. |
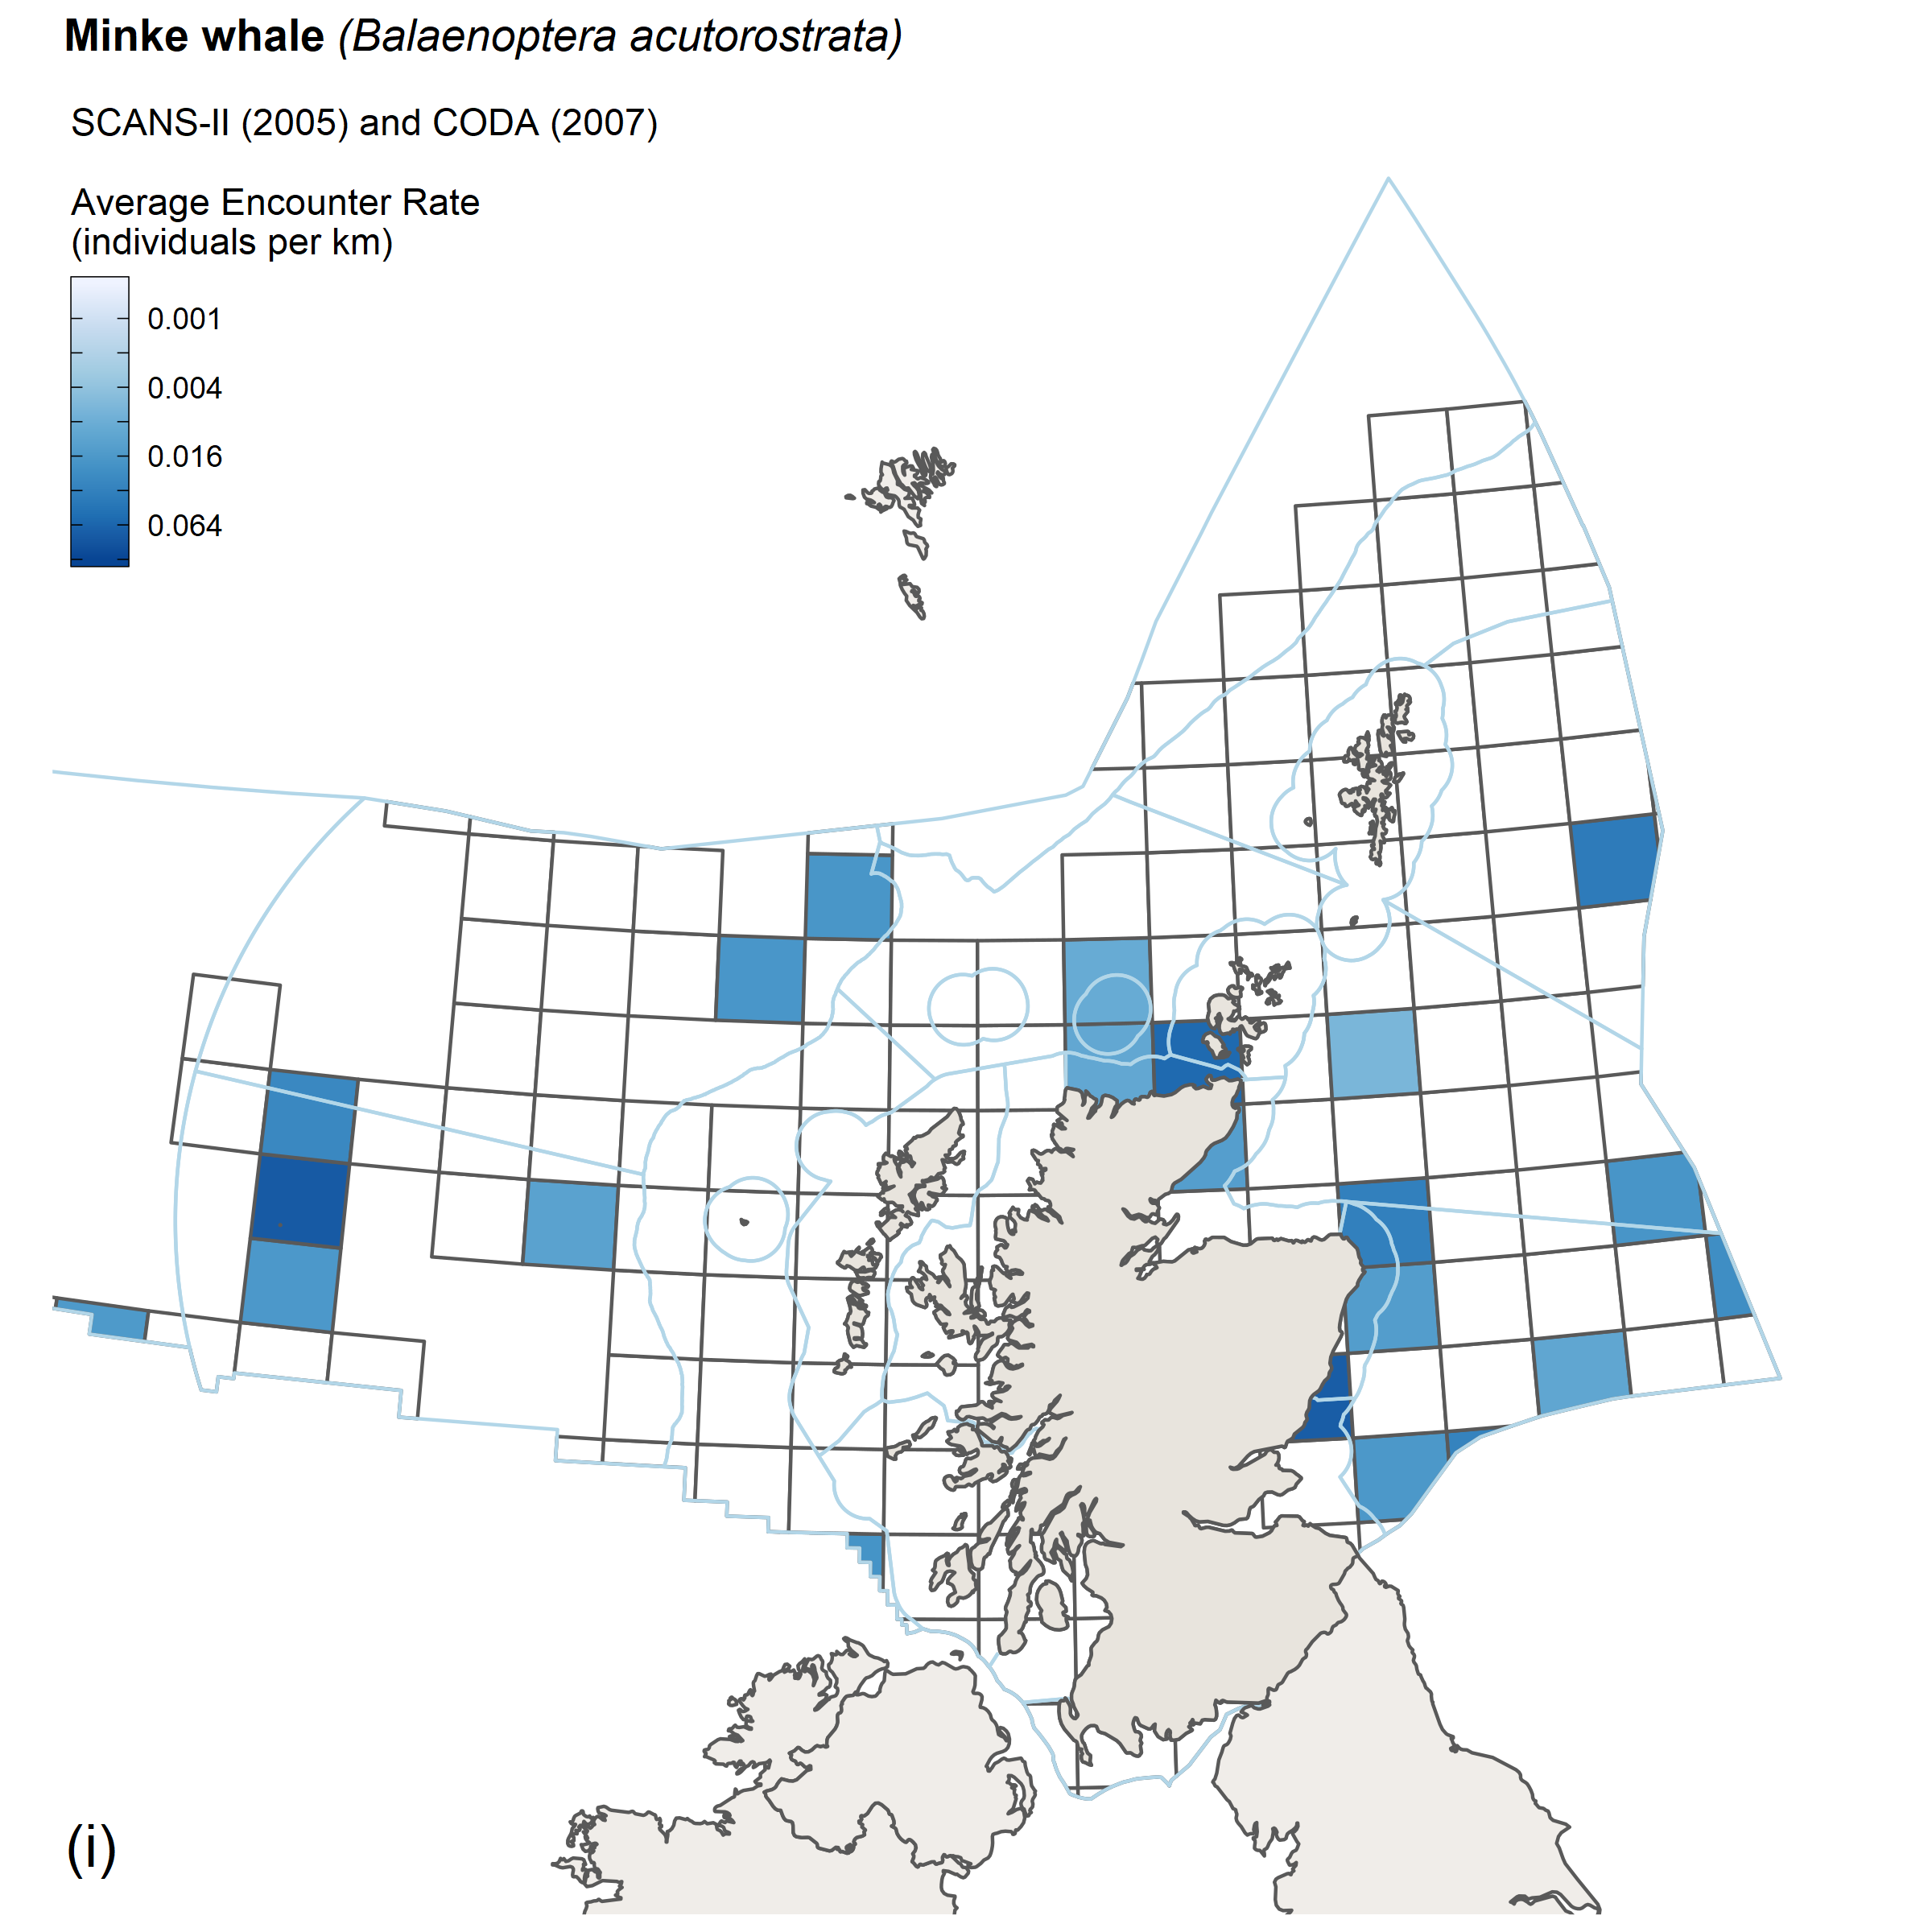
Minke whale
Between 1994 and 2005 there was some evidence that minke whale distribution in the North Sea had shifted to the south (Hammond et al., 2013). The observed distribution of minke whale in 2016 was similar to that observed in 2005 in the North Sea, and similar overall to that in 2005/07 (Hammond et al., 2013; Hammond et al., 2011).
The estimate of abundance in 2016 of 14,800 (CV = 0.33) is smaller than the estimate for 2005/07 of 26,800 (CV = 0.35) (revised from (Hammond et al., 2011). The estimate for 2016 in the North Sea was 8,900 (CV = 0.24), which is within the range of previous estimates from SCANS, SCANS-II and Norwegian surveys and results of the trend analysis of estimates in the North Sea show no support for changes in abundance since 1989 (Figure 4).
 |
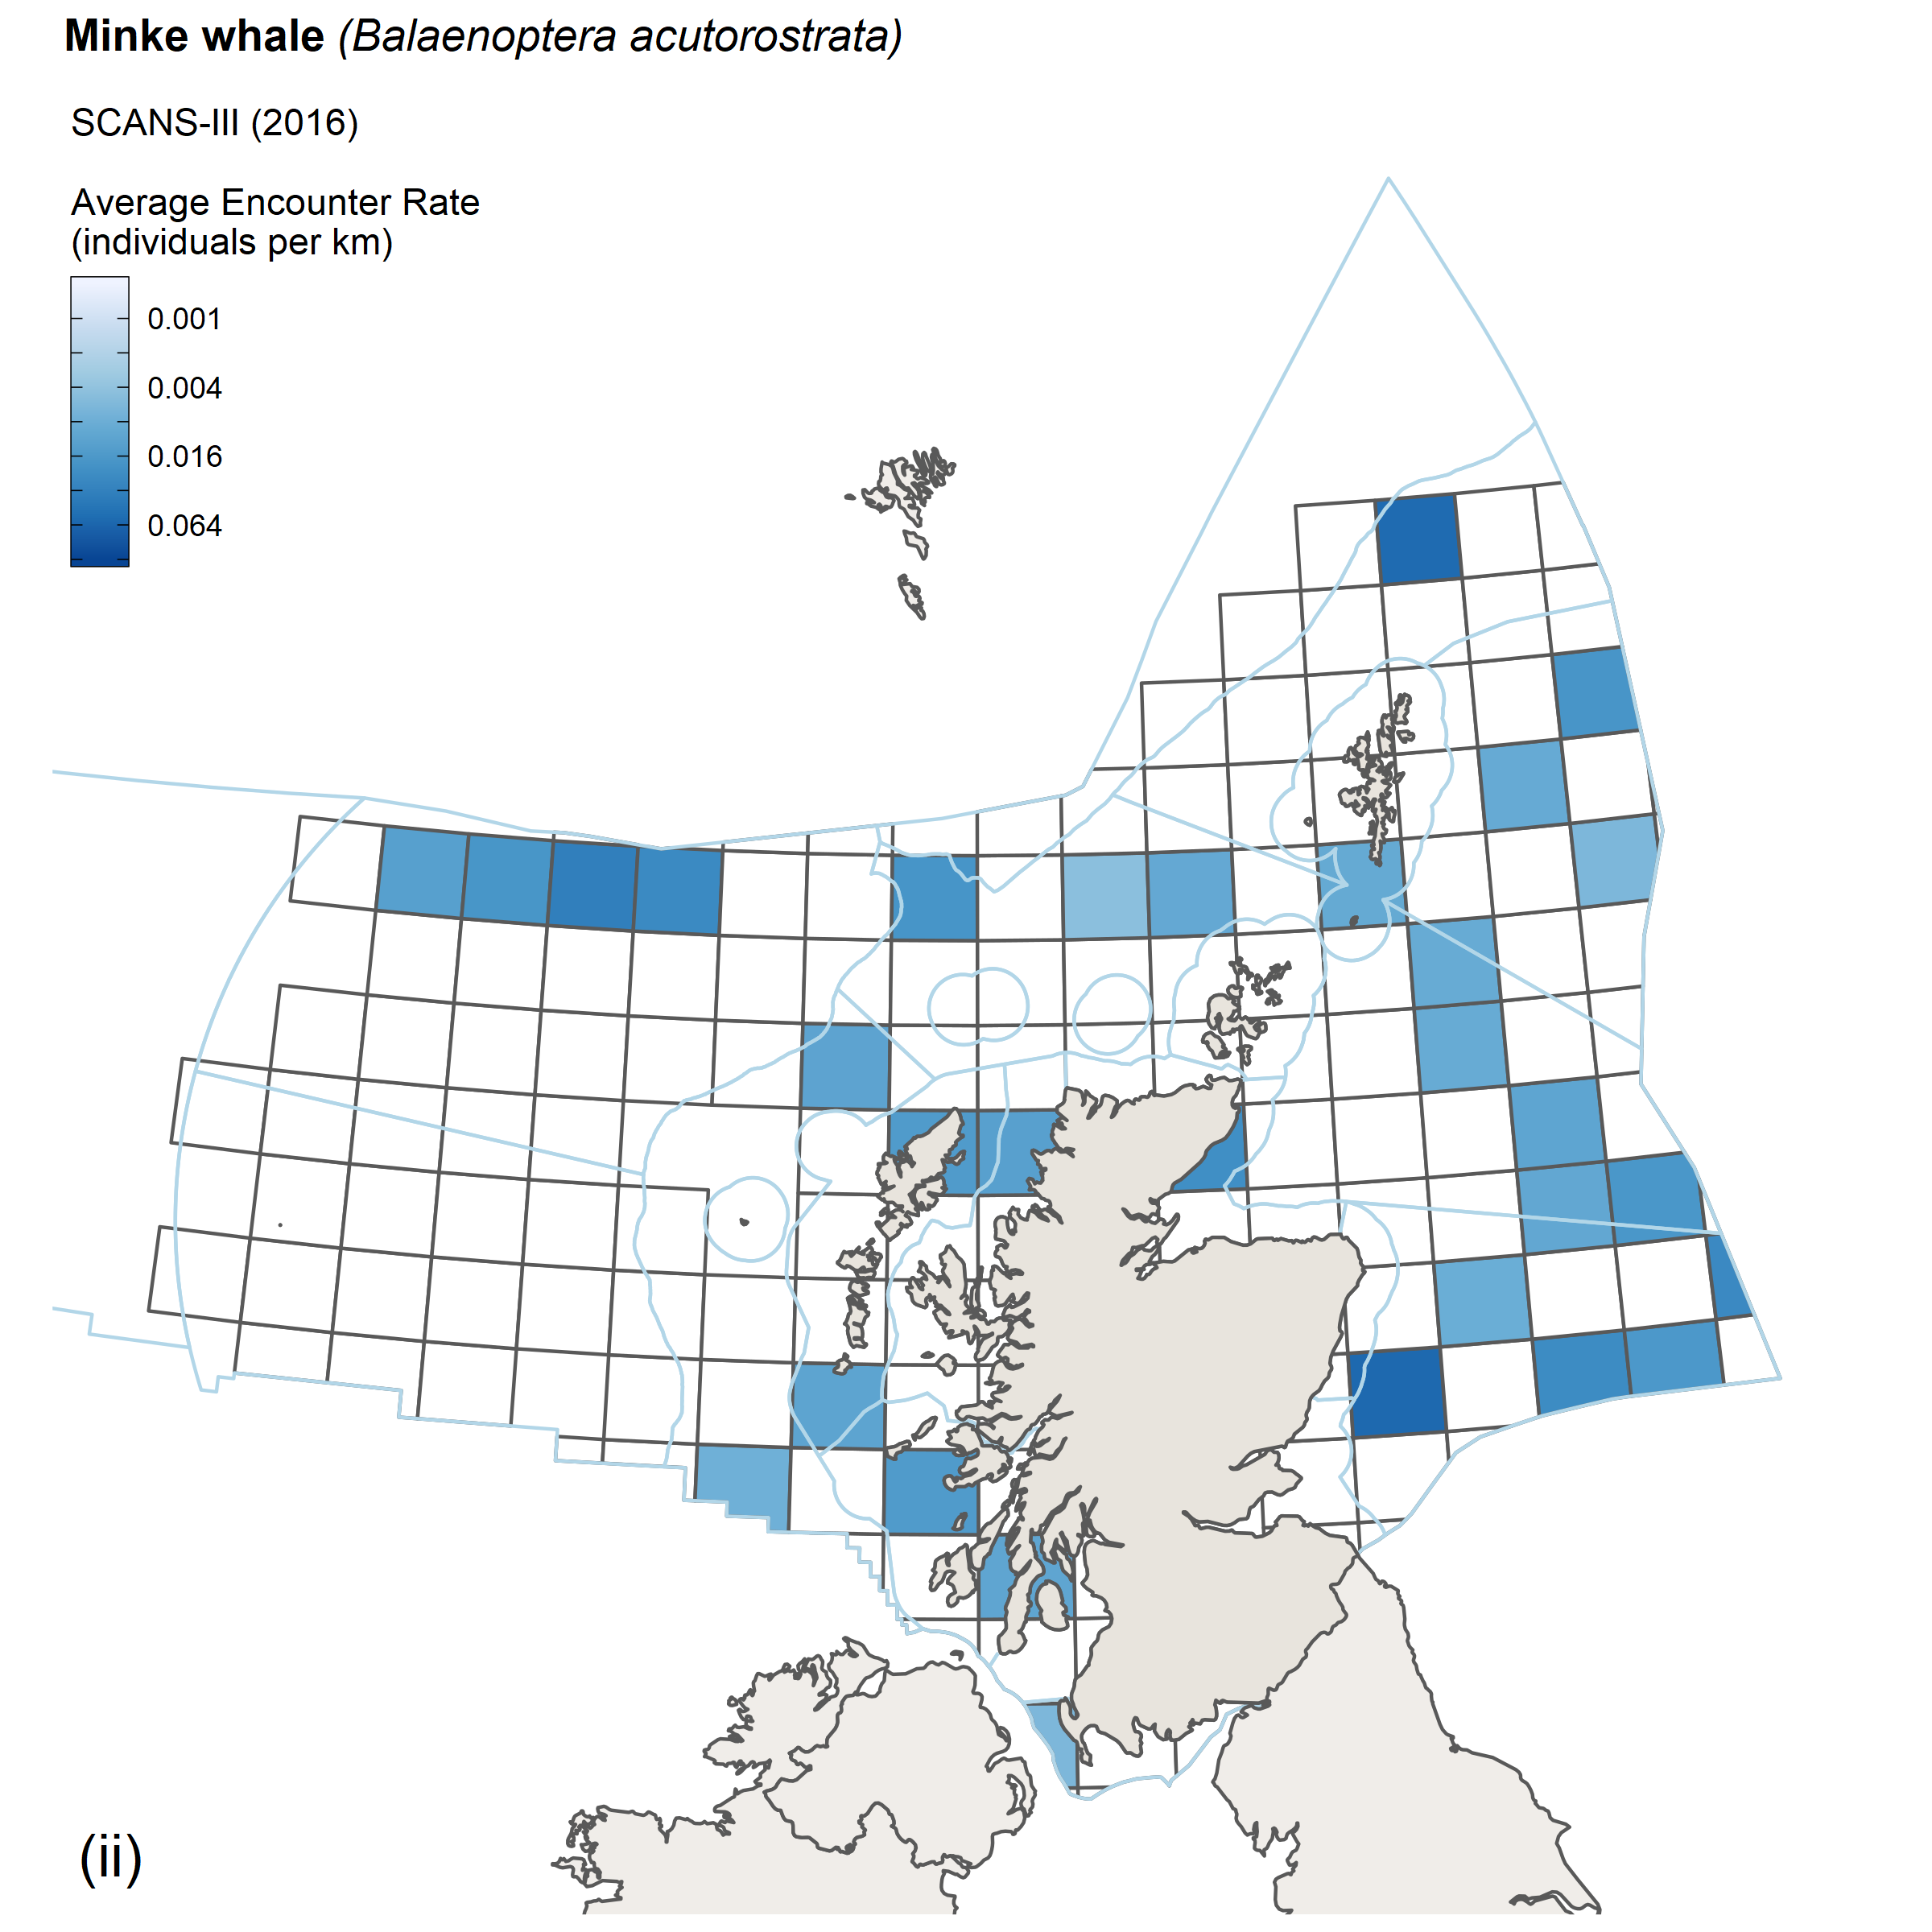 |
| Figure i: Encounter rates for minke whale from (i) SCANS II/CODA survey, 2005/2007 and (ii) SCANS III survey, 2016. |
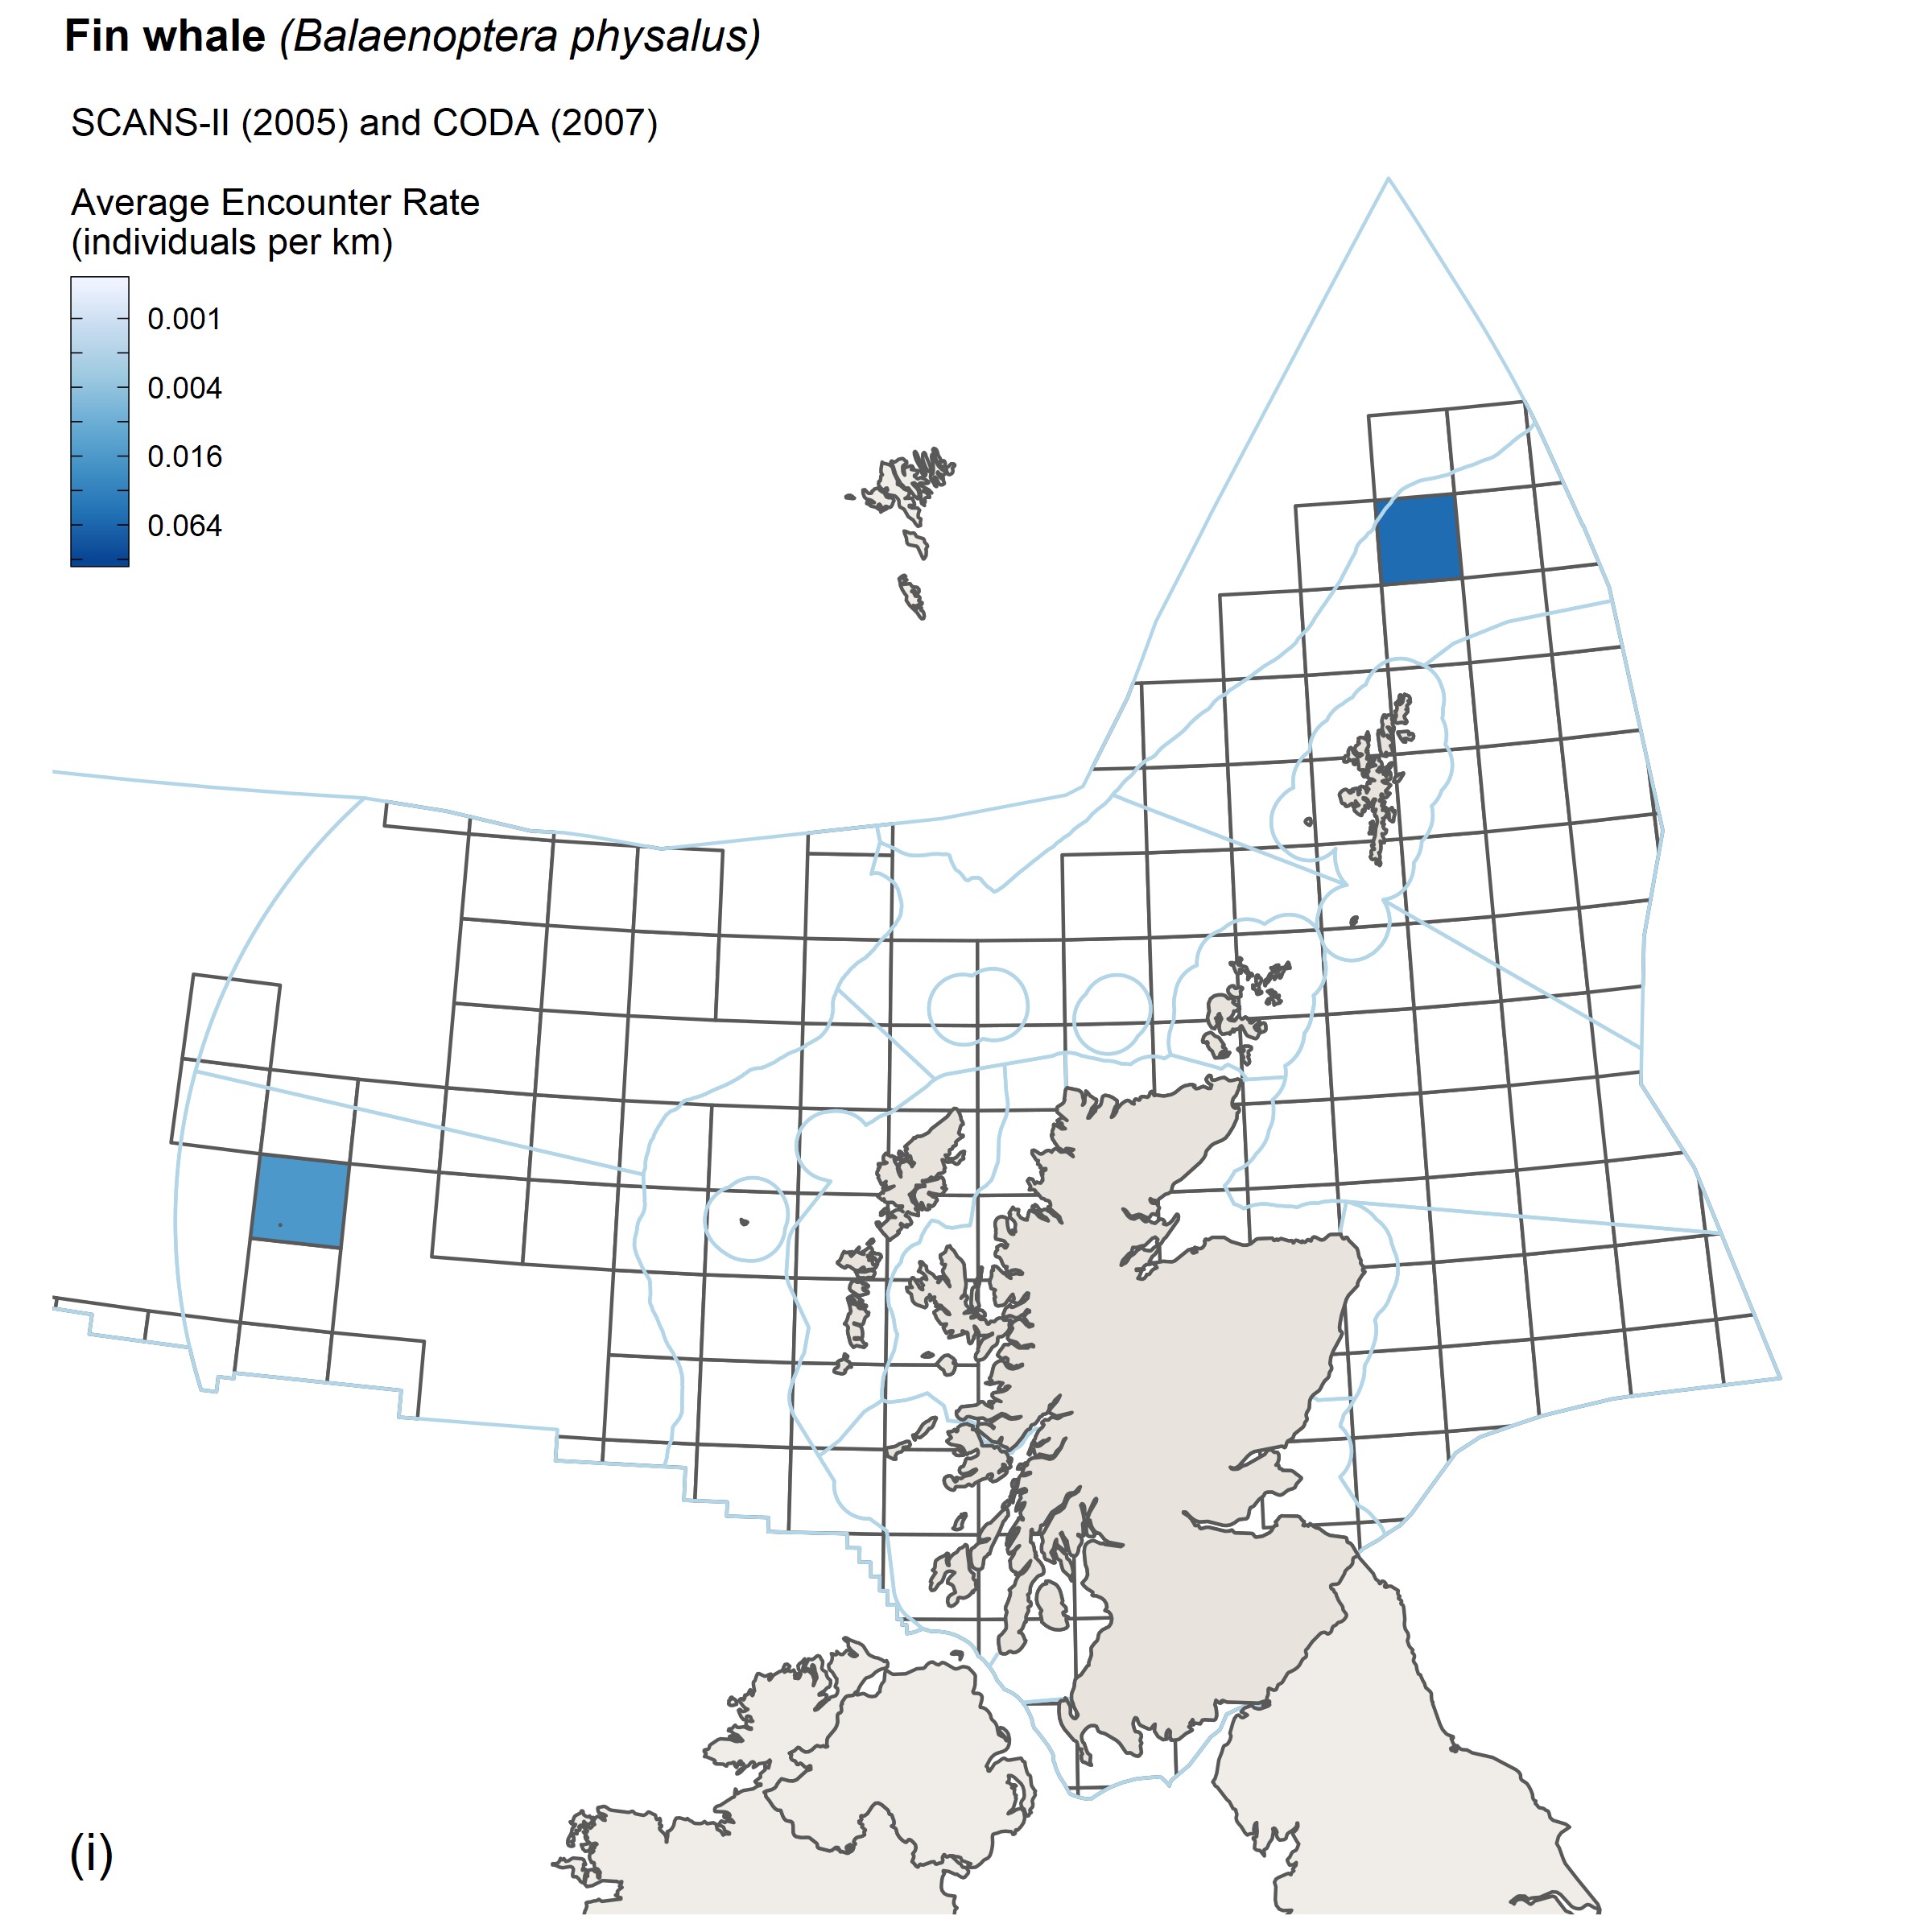
Fin whale
The observed distribution of fin whales in 2016 was similar to that observed in SCANS II 2005 and CODA in 2007 (Hammond et al., 2011). The estimate of abundance in 2016 of 18,200 (CV = 0.32) is very similar to the estimate from 2007 of 19,400 (CV = 0.24) for identified fin whales but smaller than the estimate for 2007 that included a proportion of unidentified large whales of 29,500 (CV = 0.21) (Hammond et al., 2011). Analyses to account for unidentified large whales have not yet been undertaken for the SCANS-III data.
 |
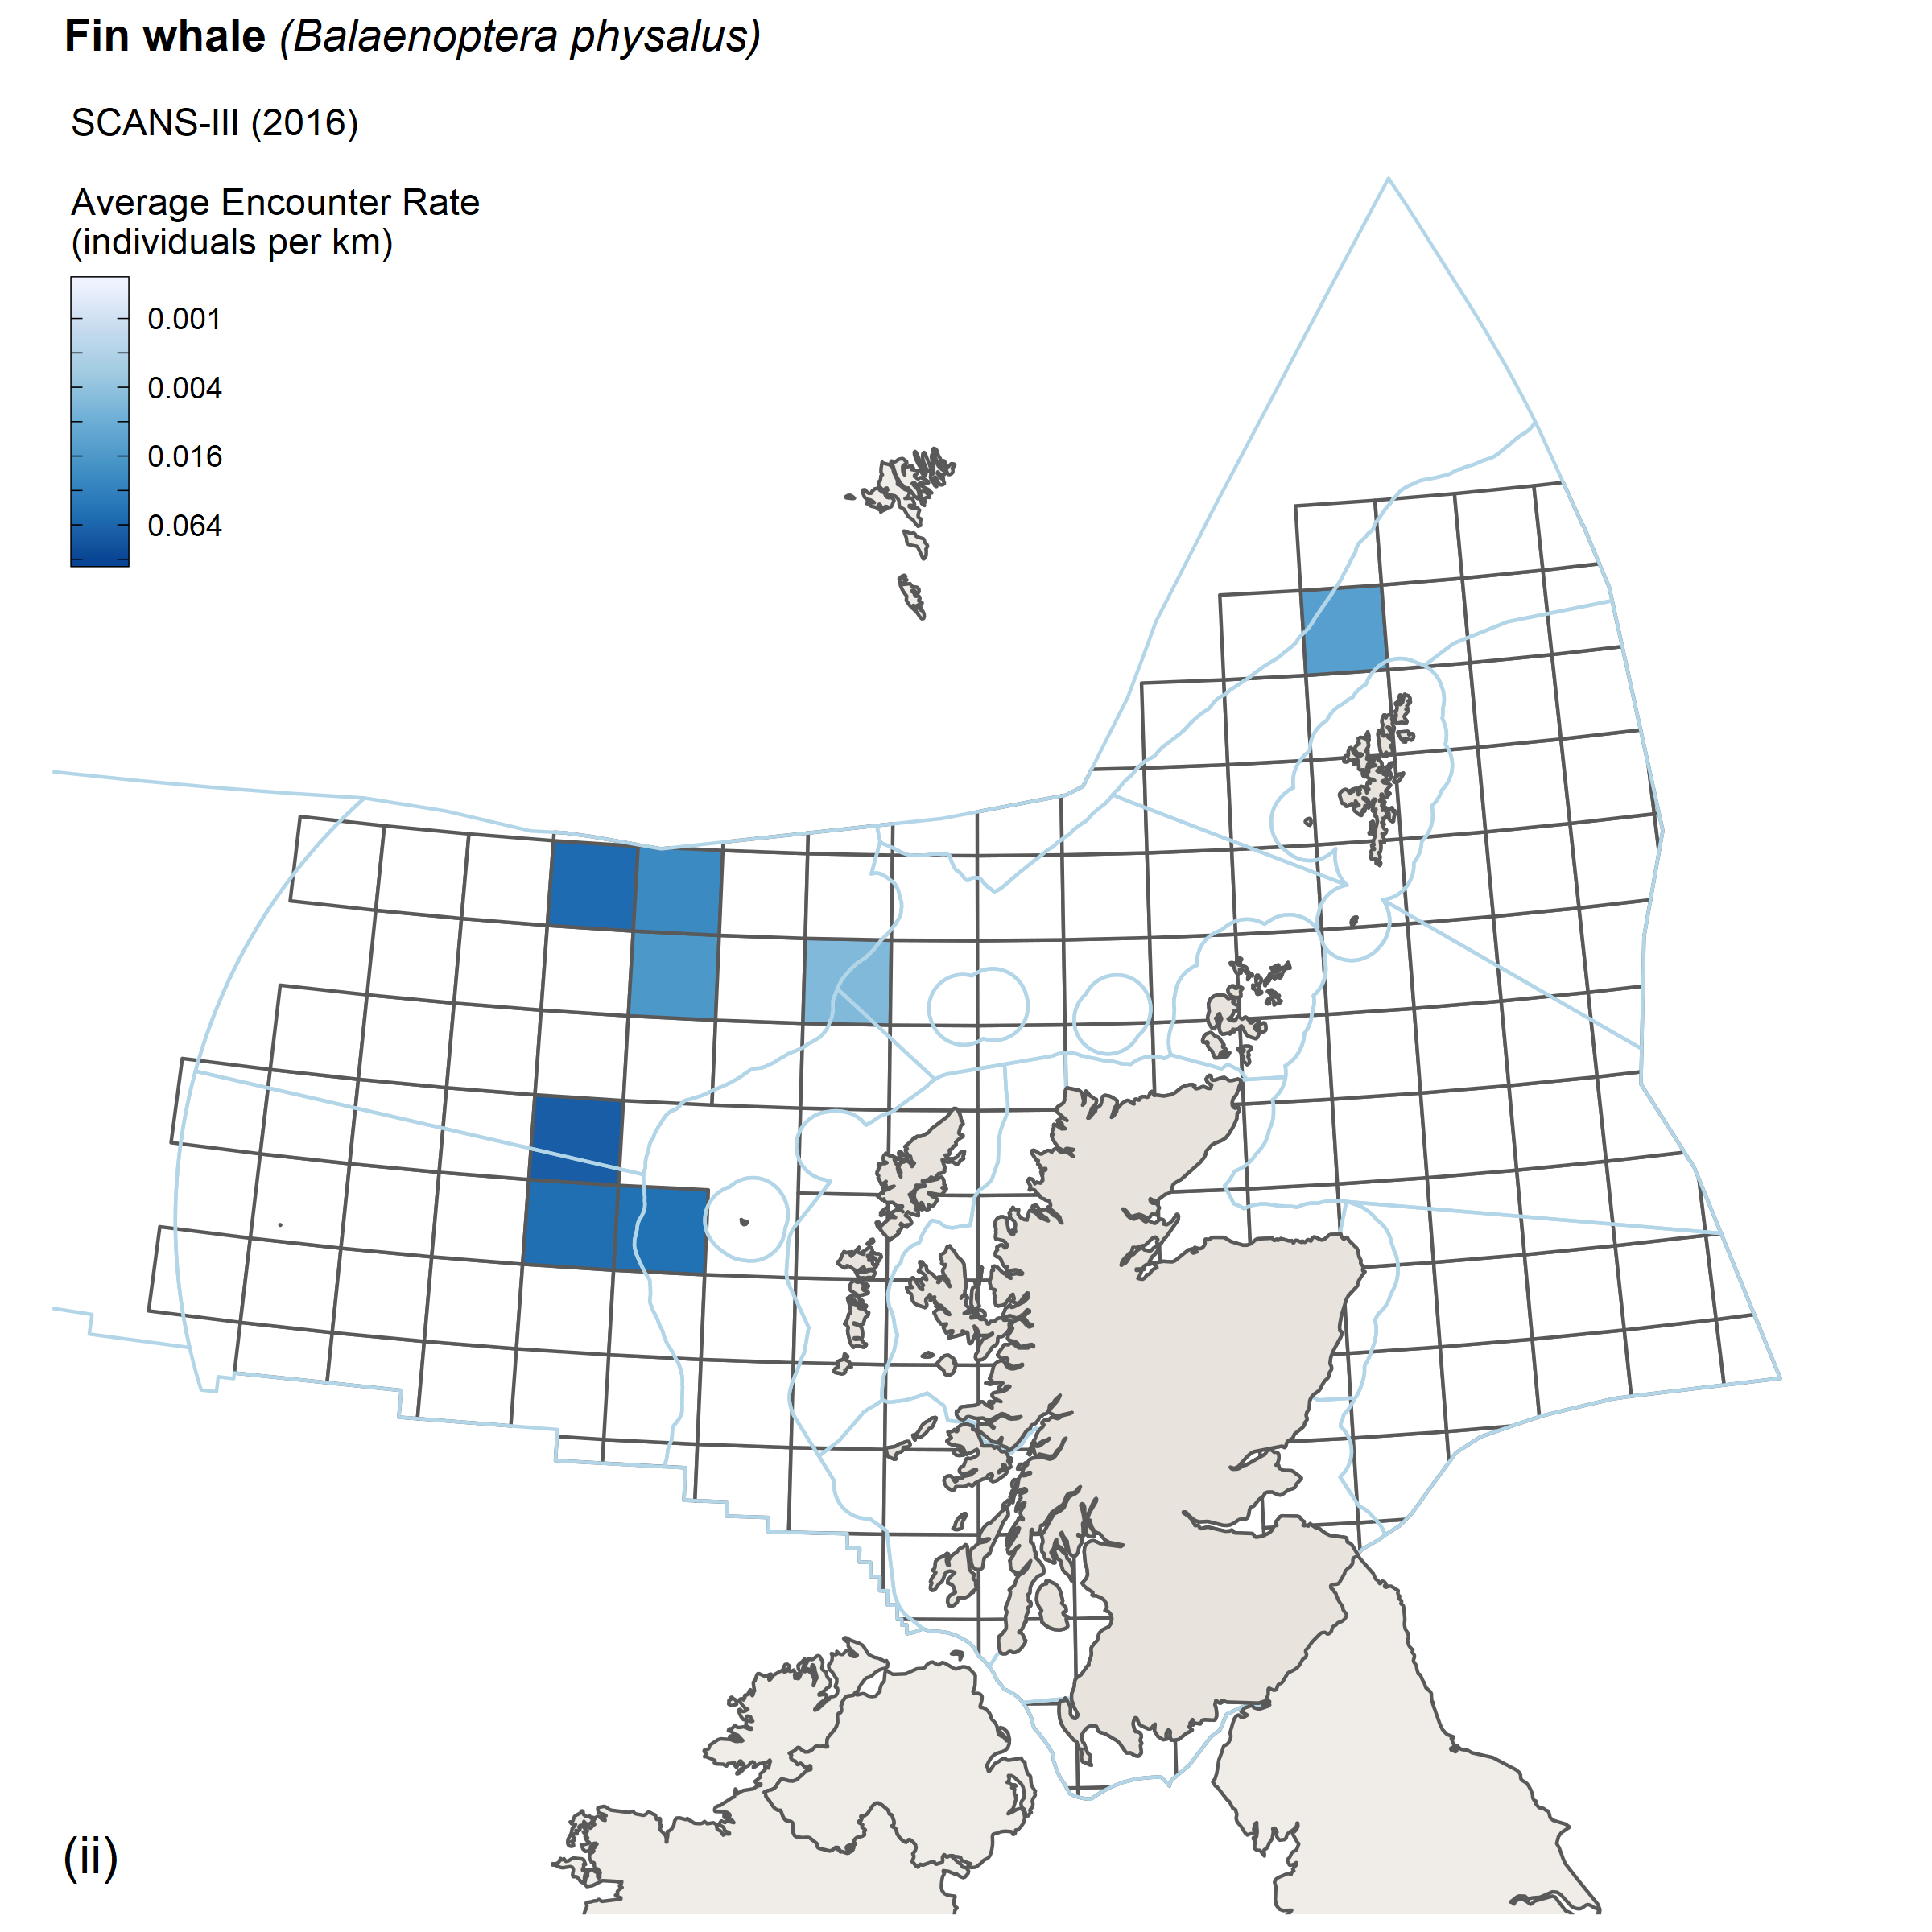 |
| Figure j: Encounter rates for fin whale from (i) SCANS II/CODA survey, 2005/2007 and (ii) SCANS III survey, 2016. |
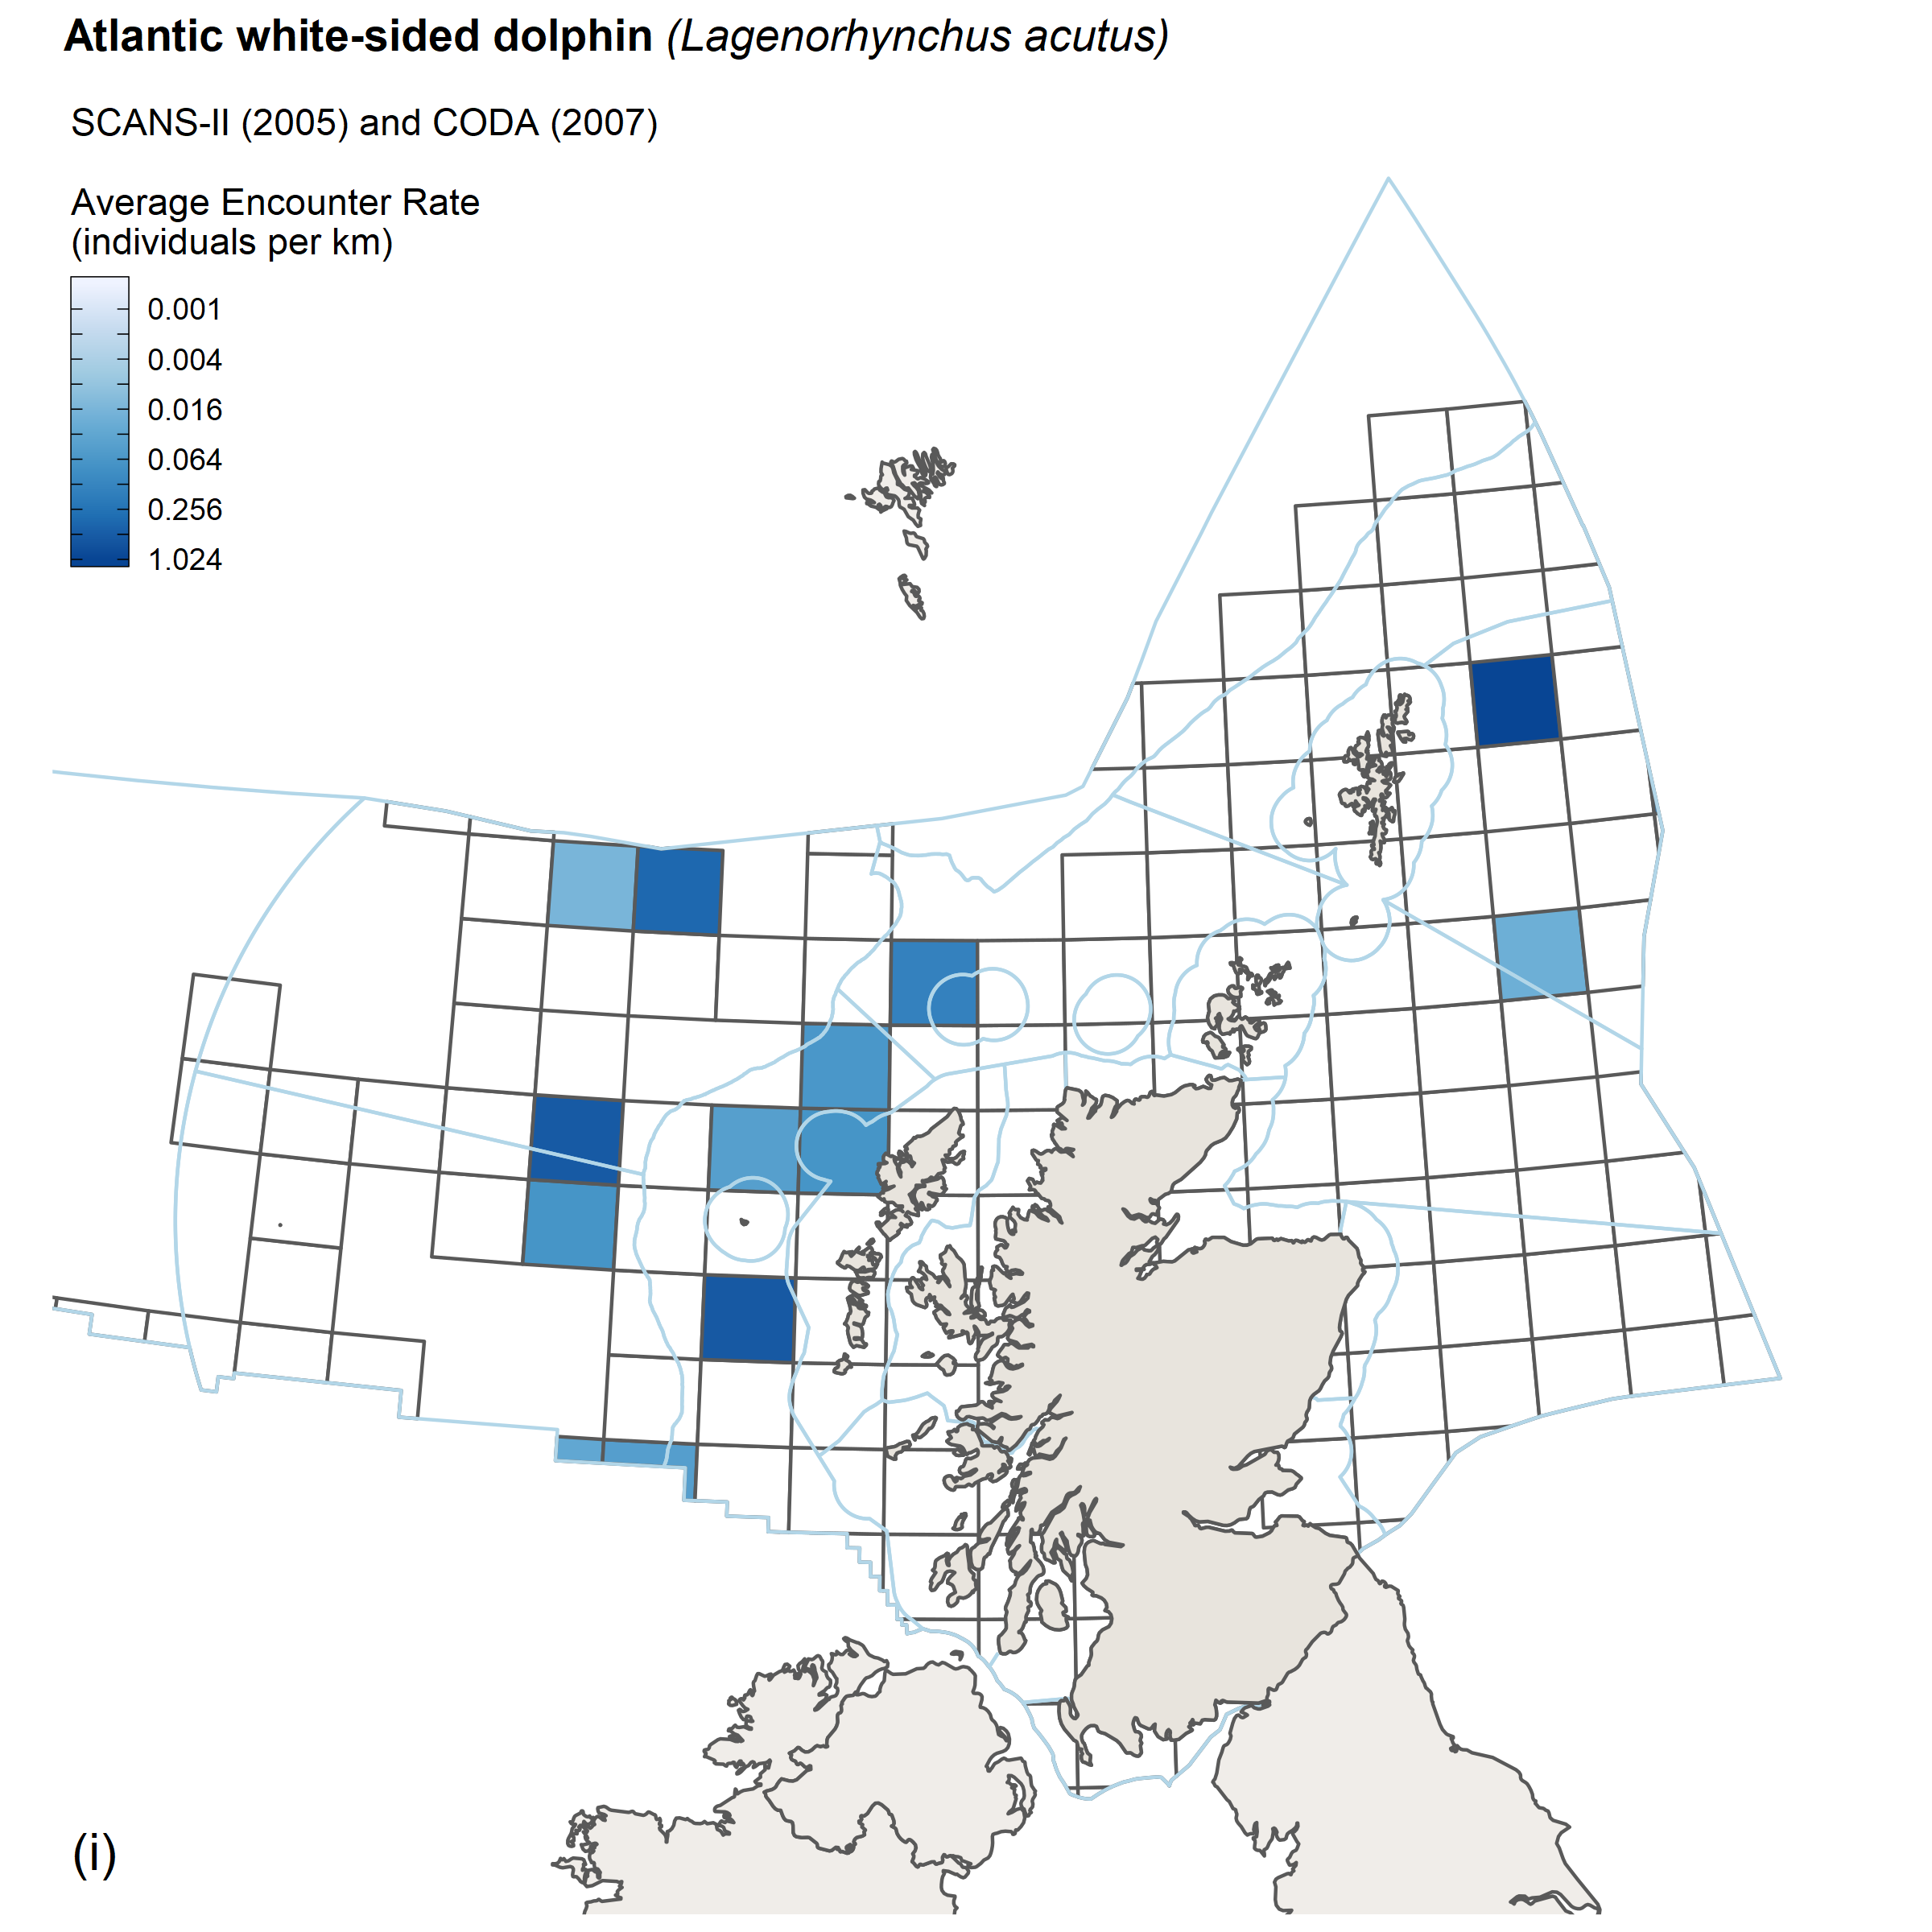
Atlantic white-sided dolphin
The observed encounter rates of Atlantic white-sided dolphins was similar in the SCANS II and SCANS III surveys with most sightings being to the west and north west of Scotland.
 |
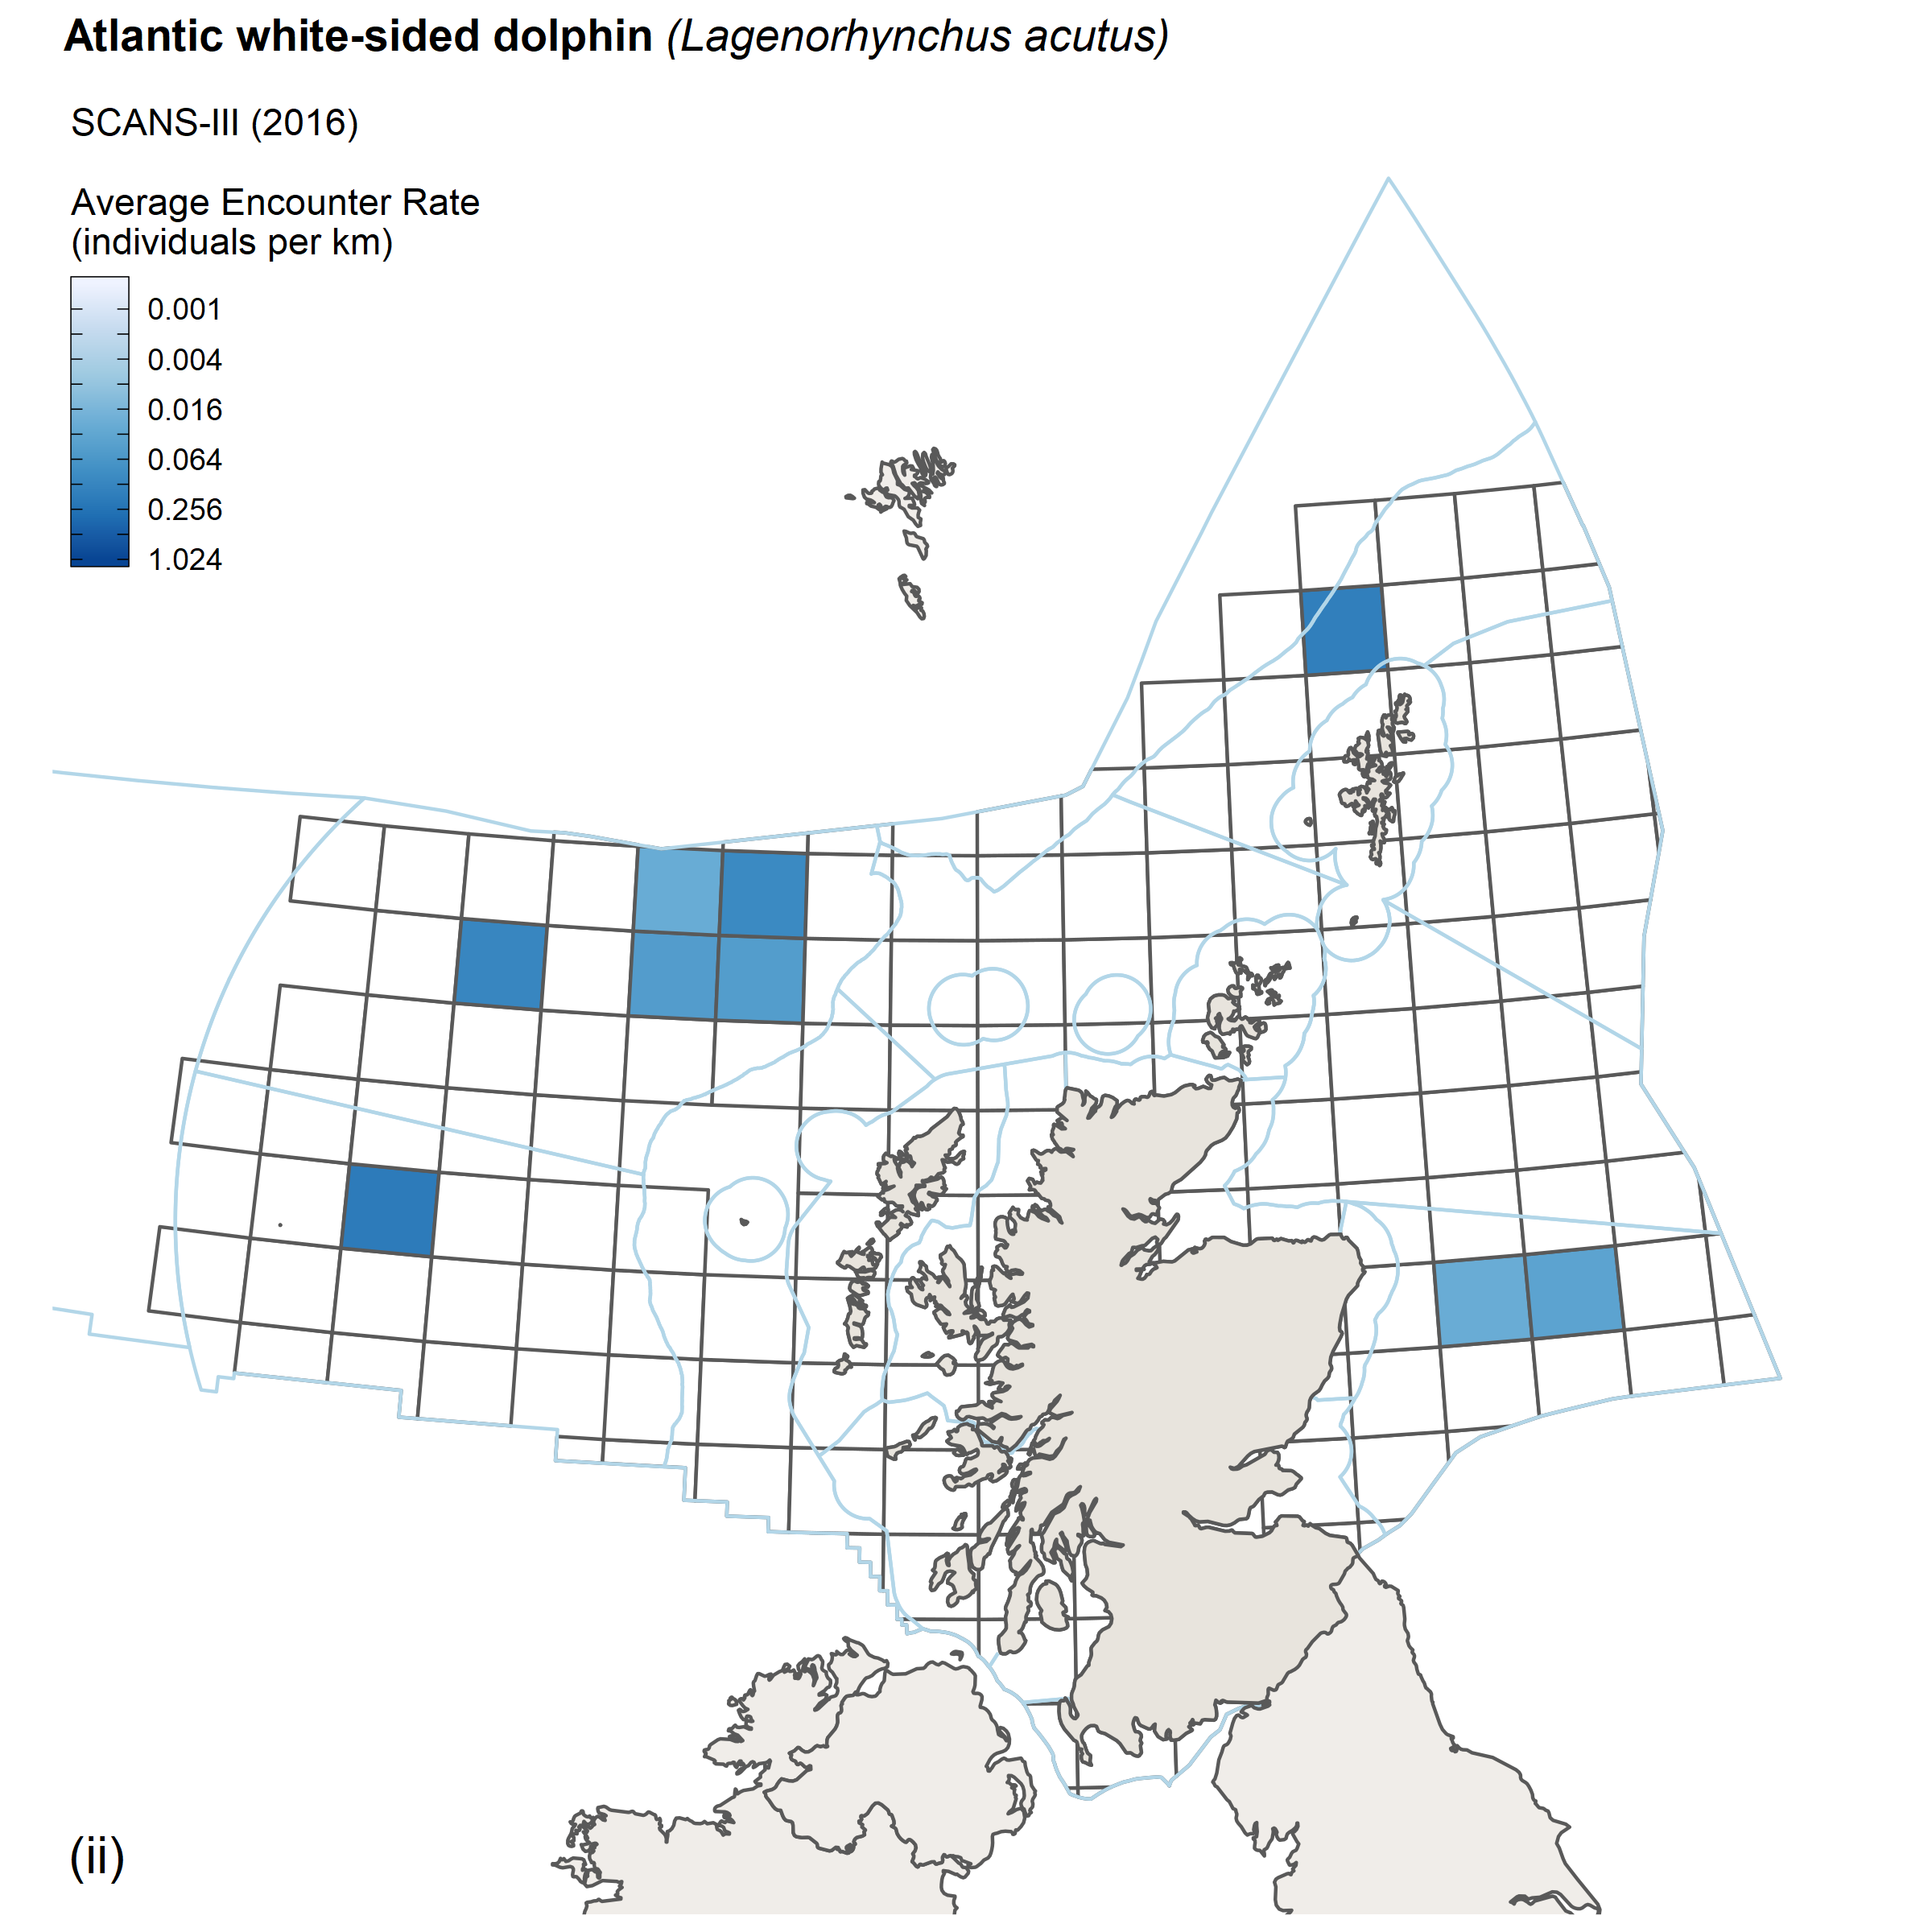 |
| Figure k: Encounter rates for Atlantic white-sided dolphins from (i) SCANS II/CODA survey, 2005/2007 and (ii) SCANS III survey, 2016. |
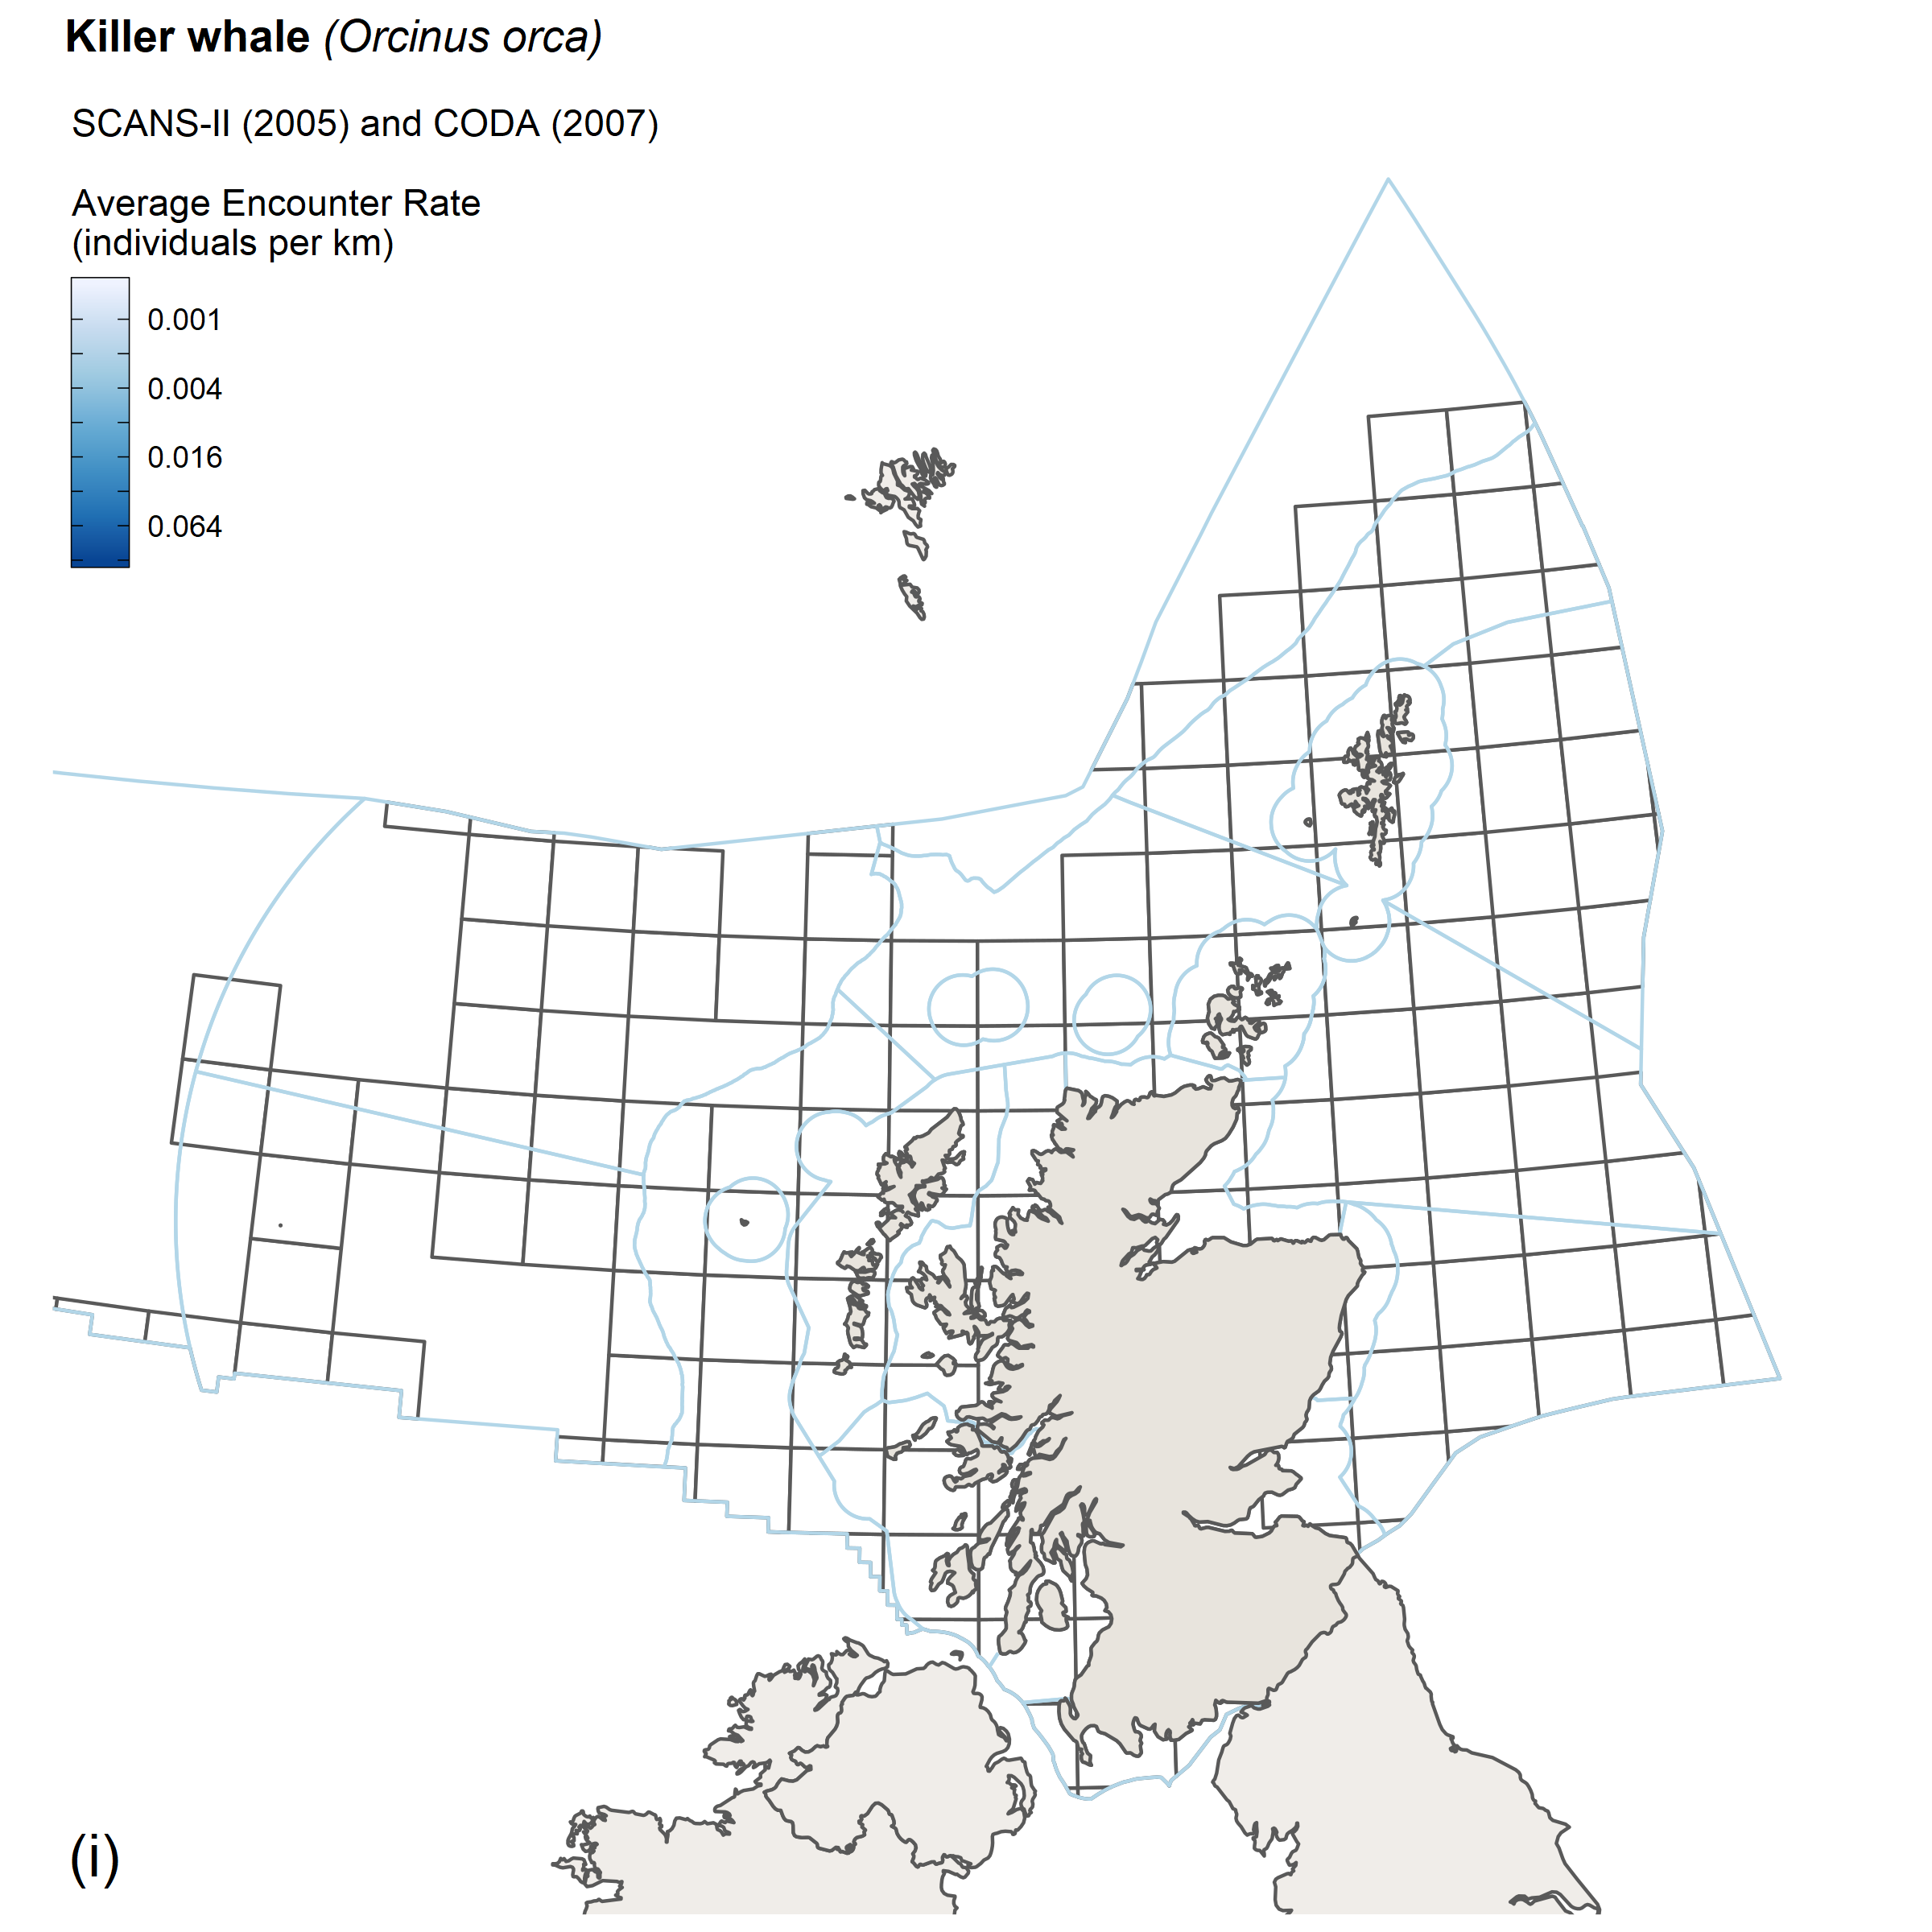
Killer whale
There were no killer whale encounters in 2005/2007 surveys and only a few sightings around Shetland in 2016.
 |
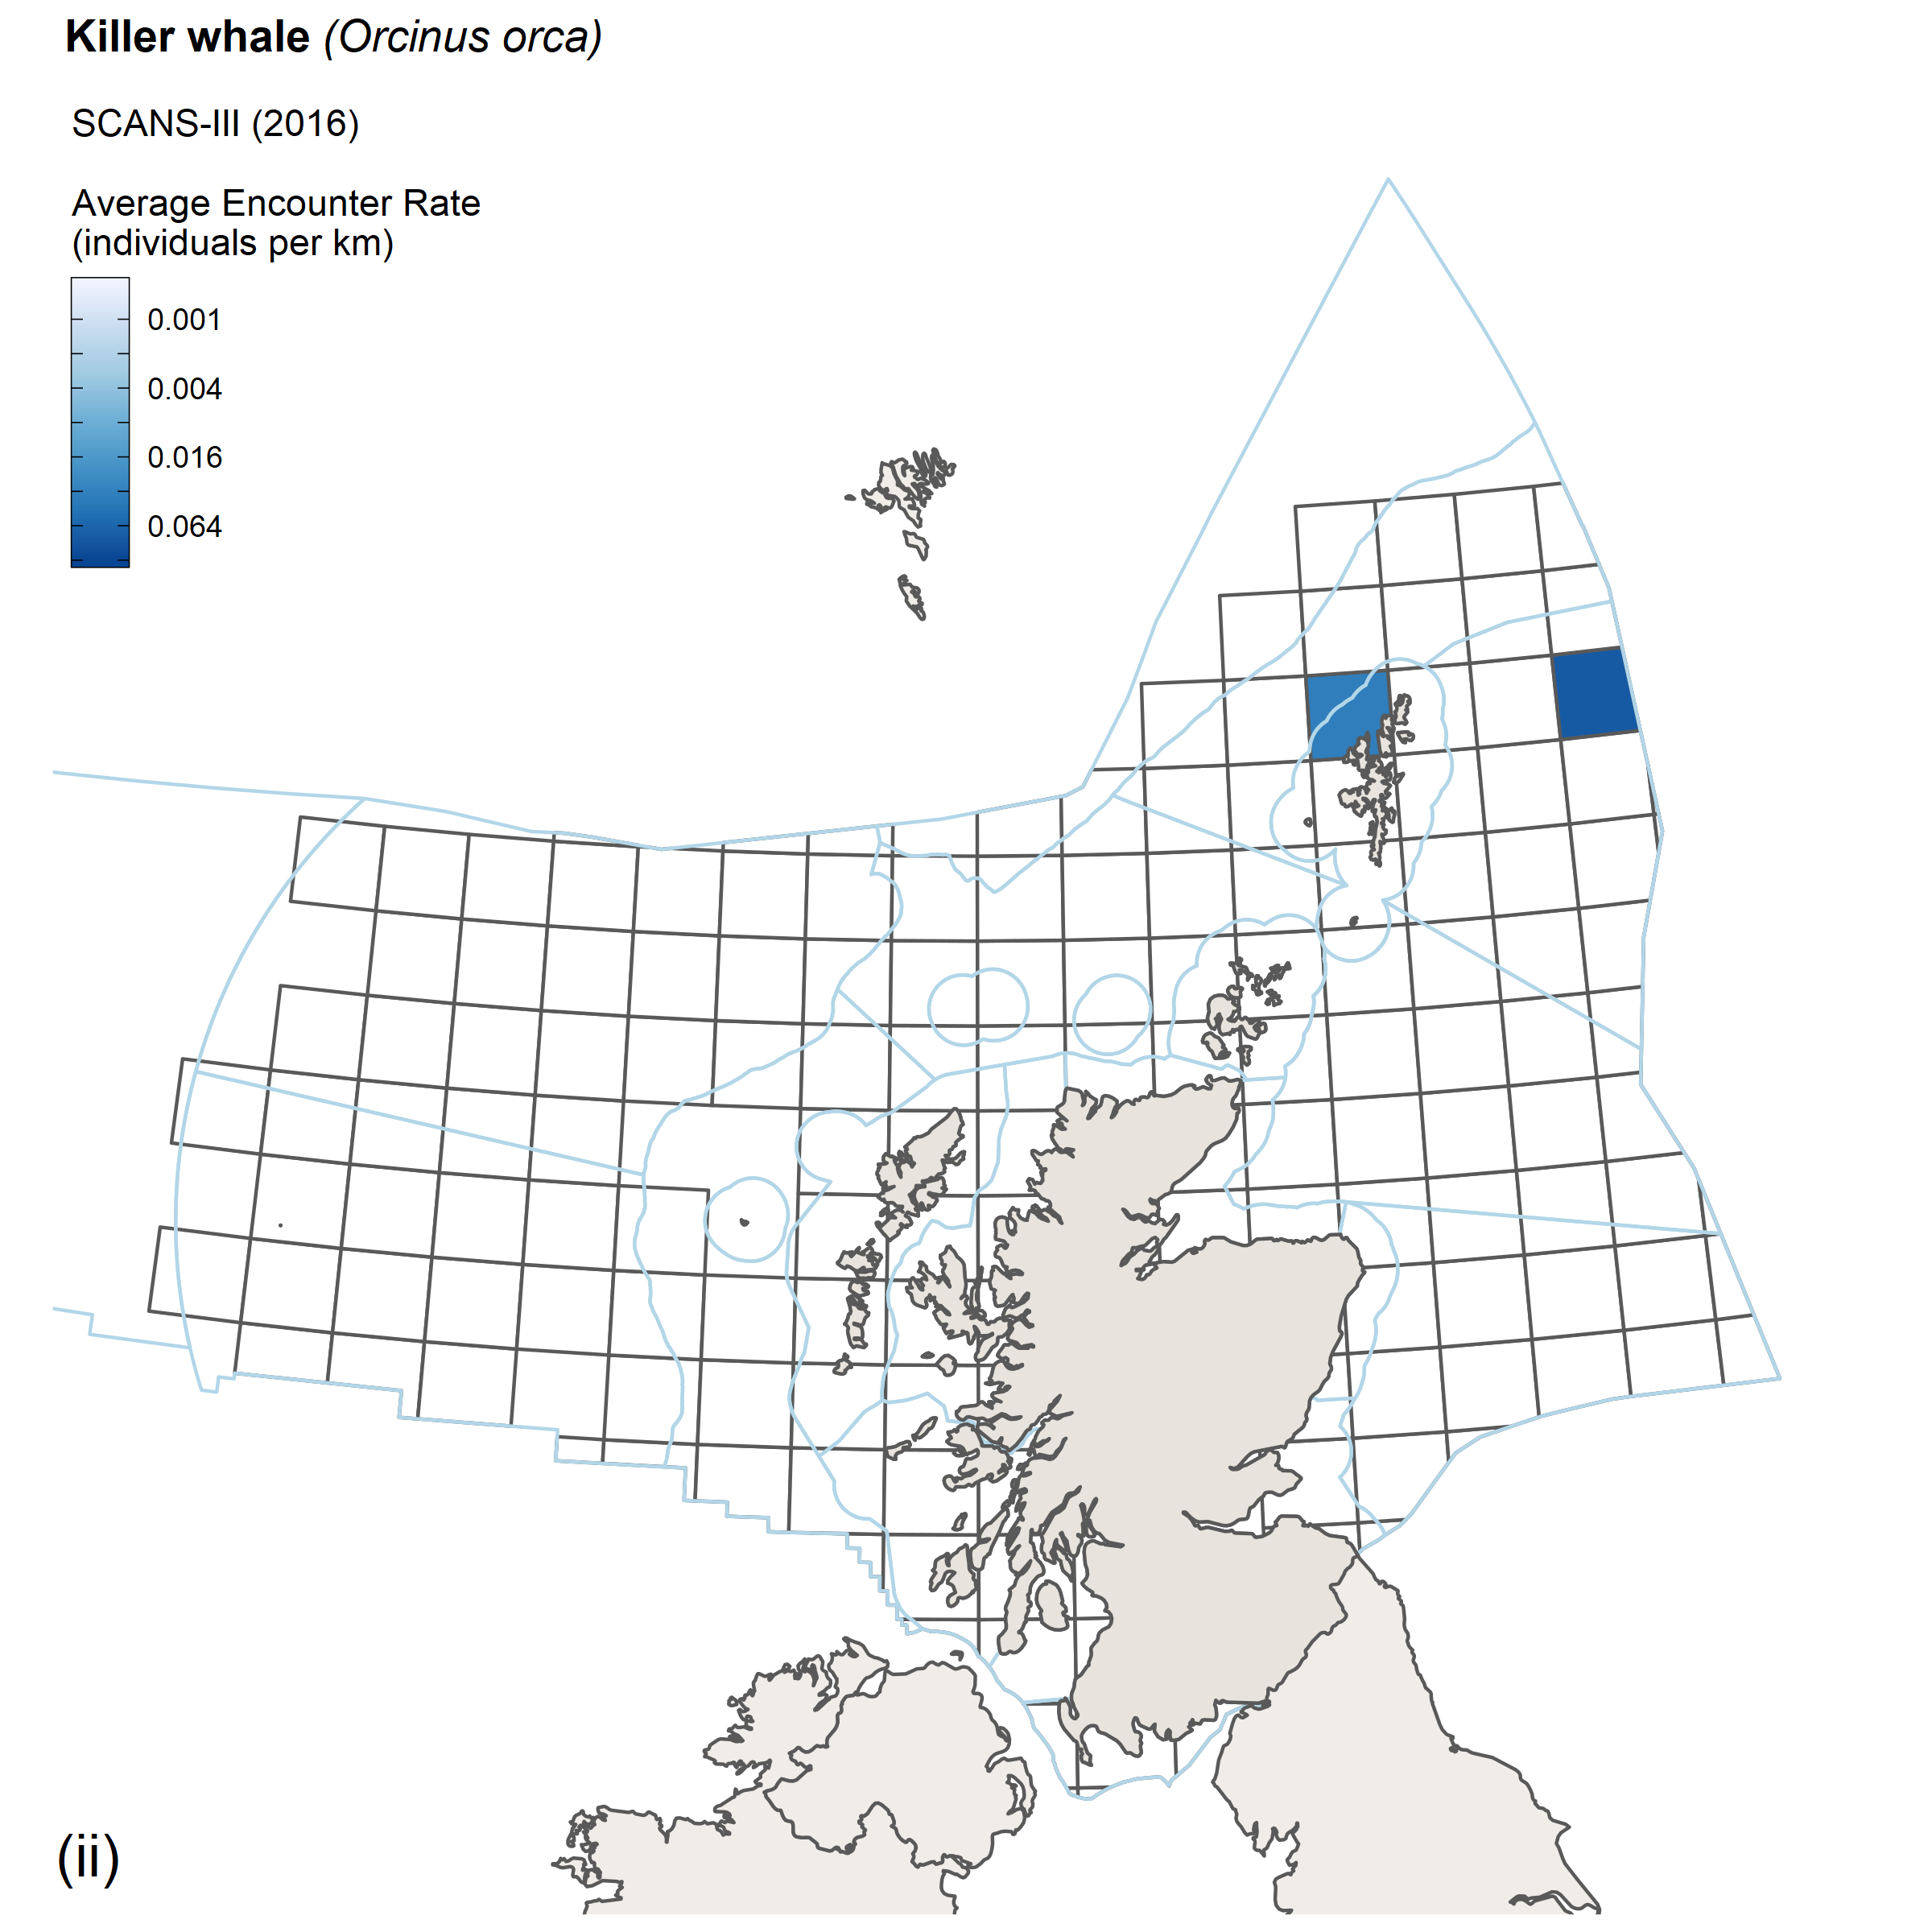 |
| Figure l: Encounter rates for killer whale from (i) SCANS II/CODA survey, 2005/2007 and (ii) SCANS III survey, 2016. |
Risso’s dolphin
In the 2005/2007 surveys Risso’s dolphins were encountered offshore to the west of Scotland and a few to the north and south west.
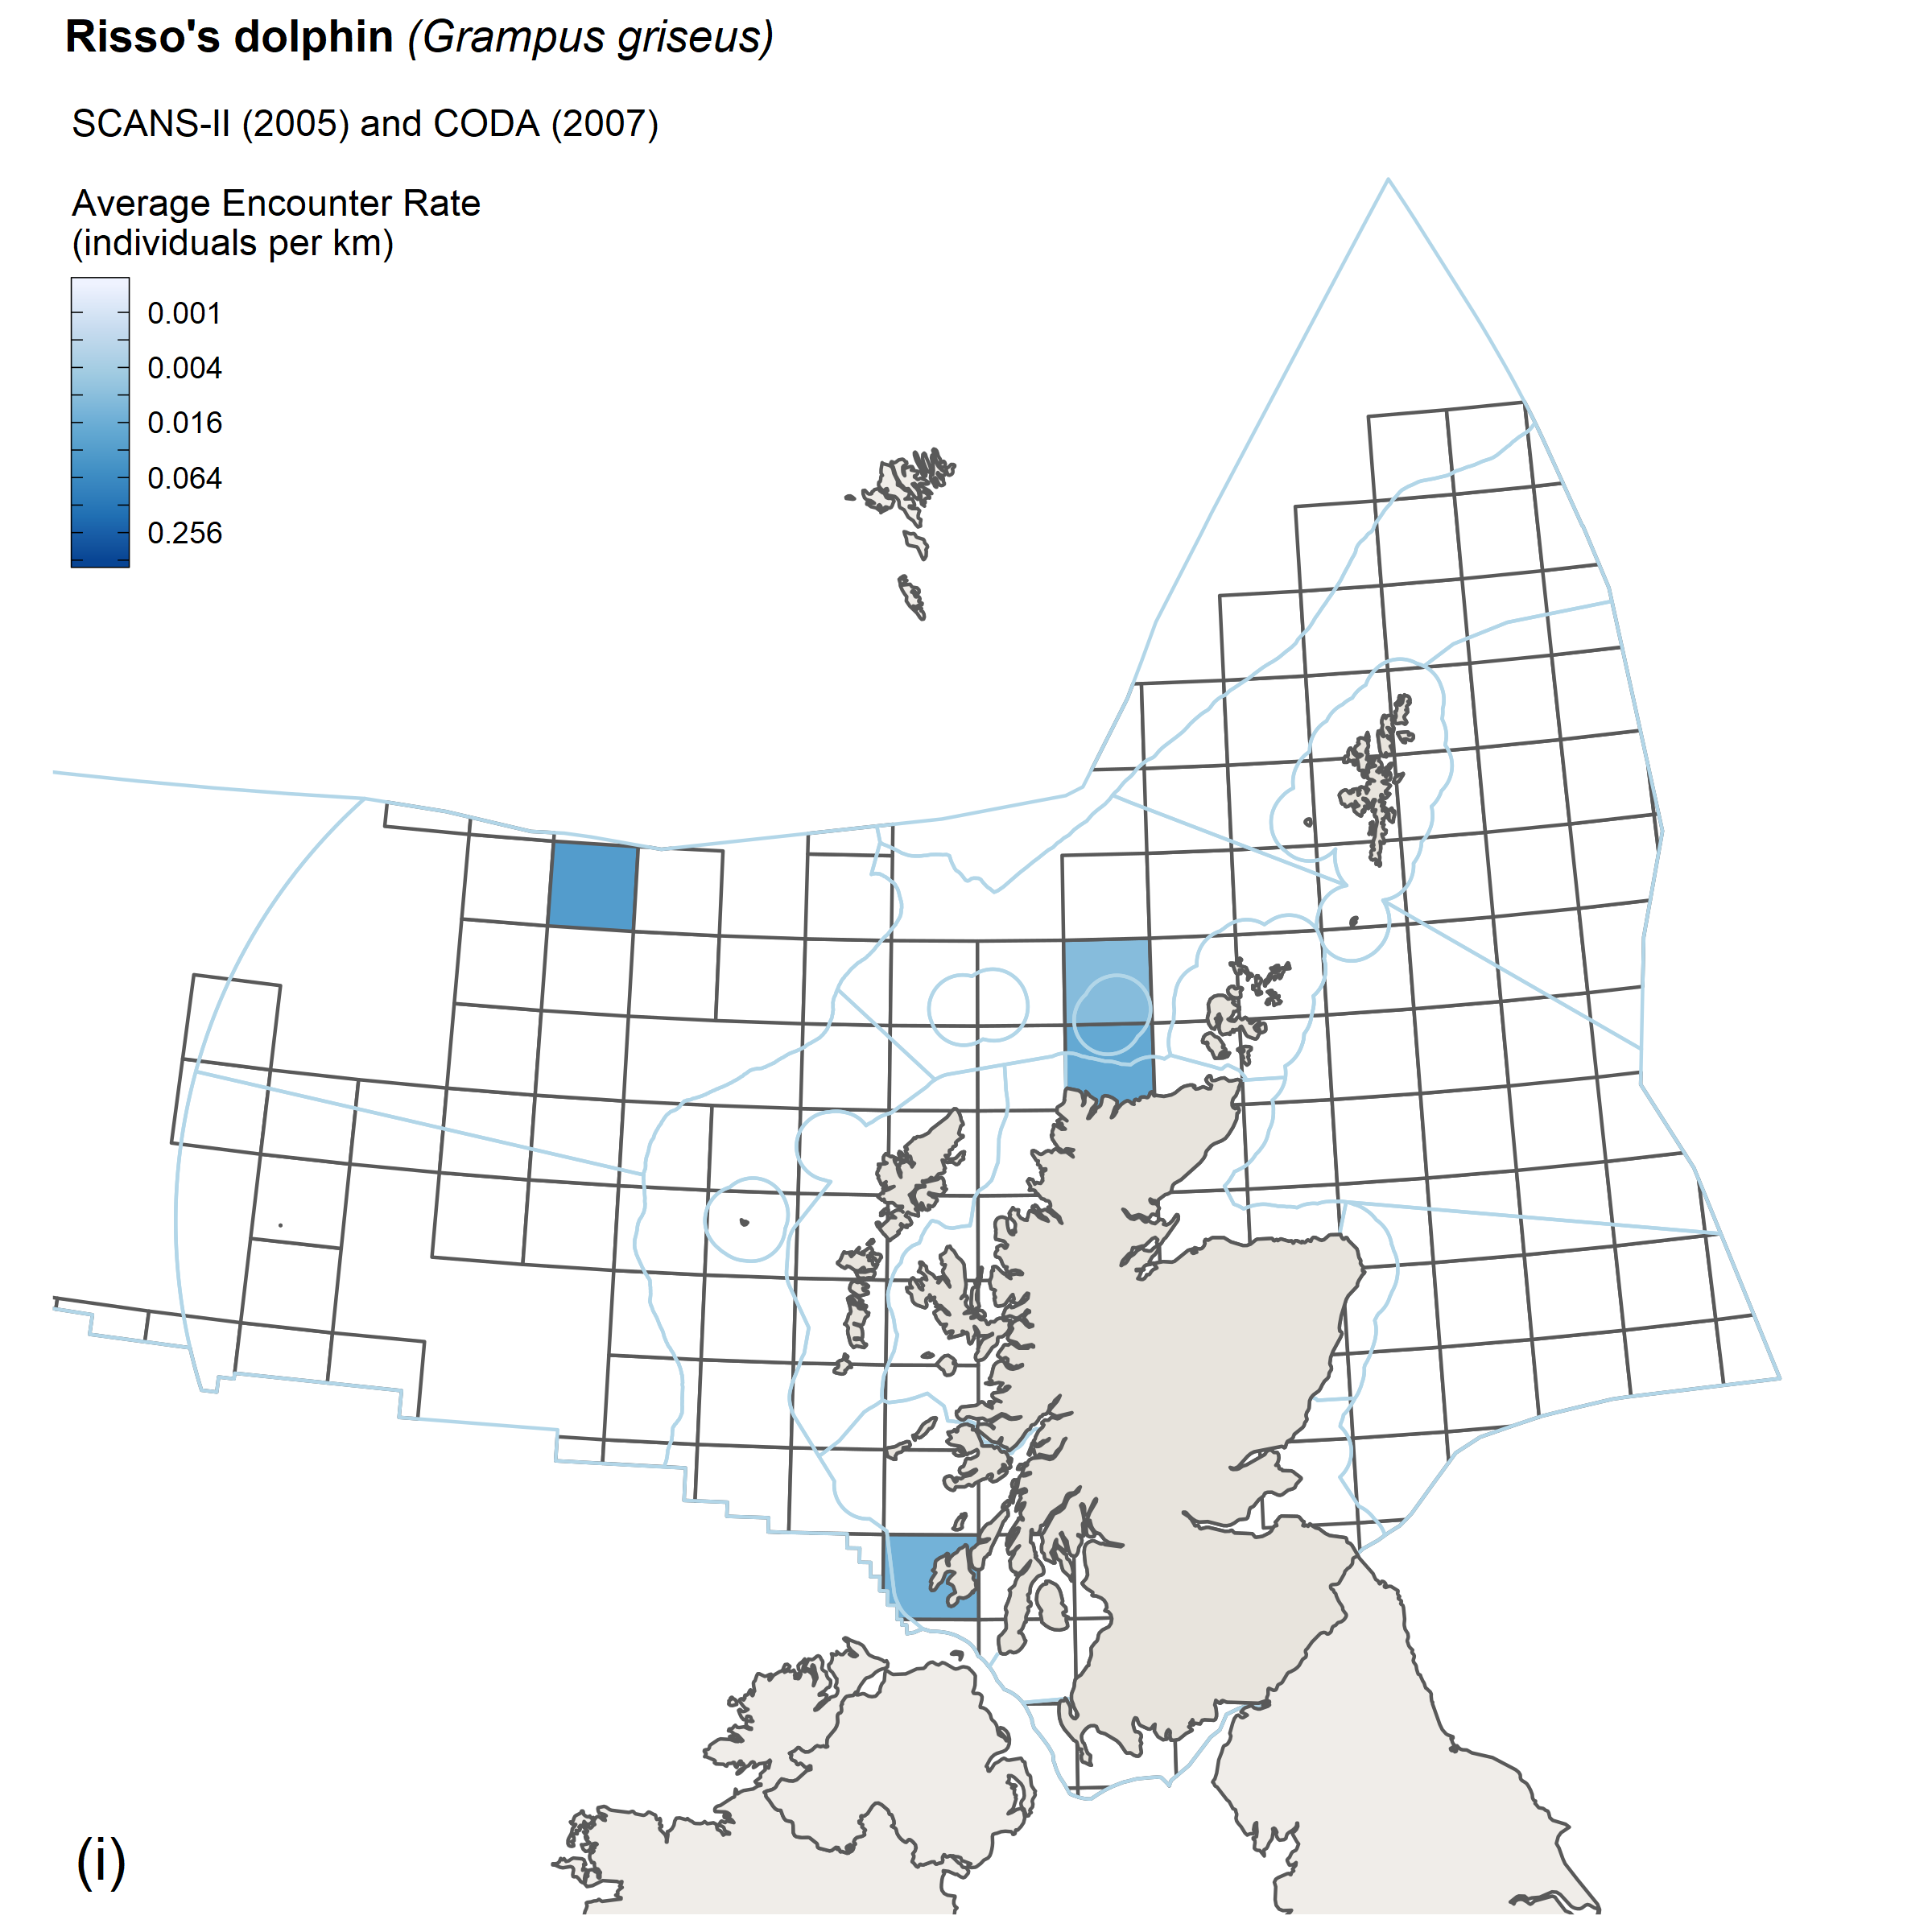 |
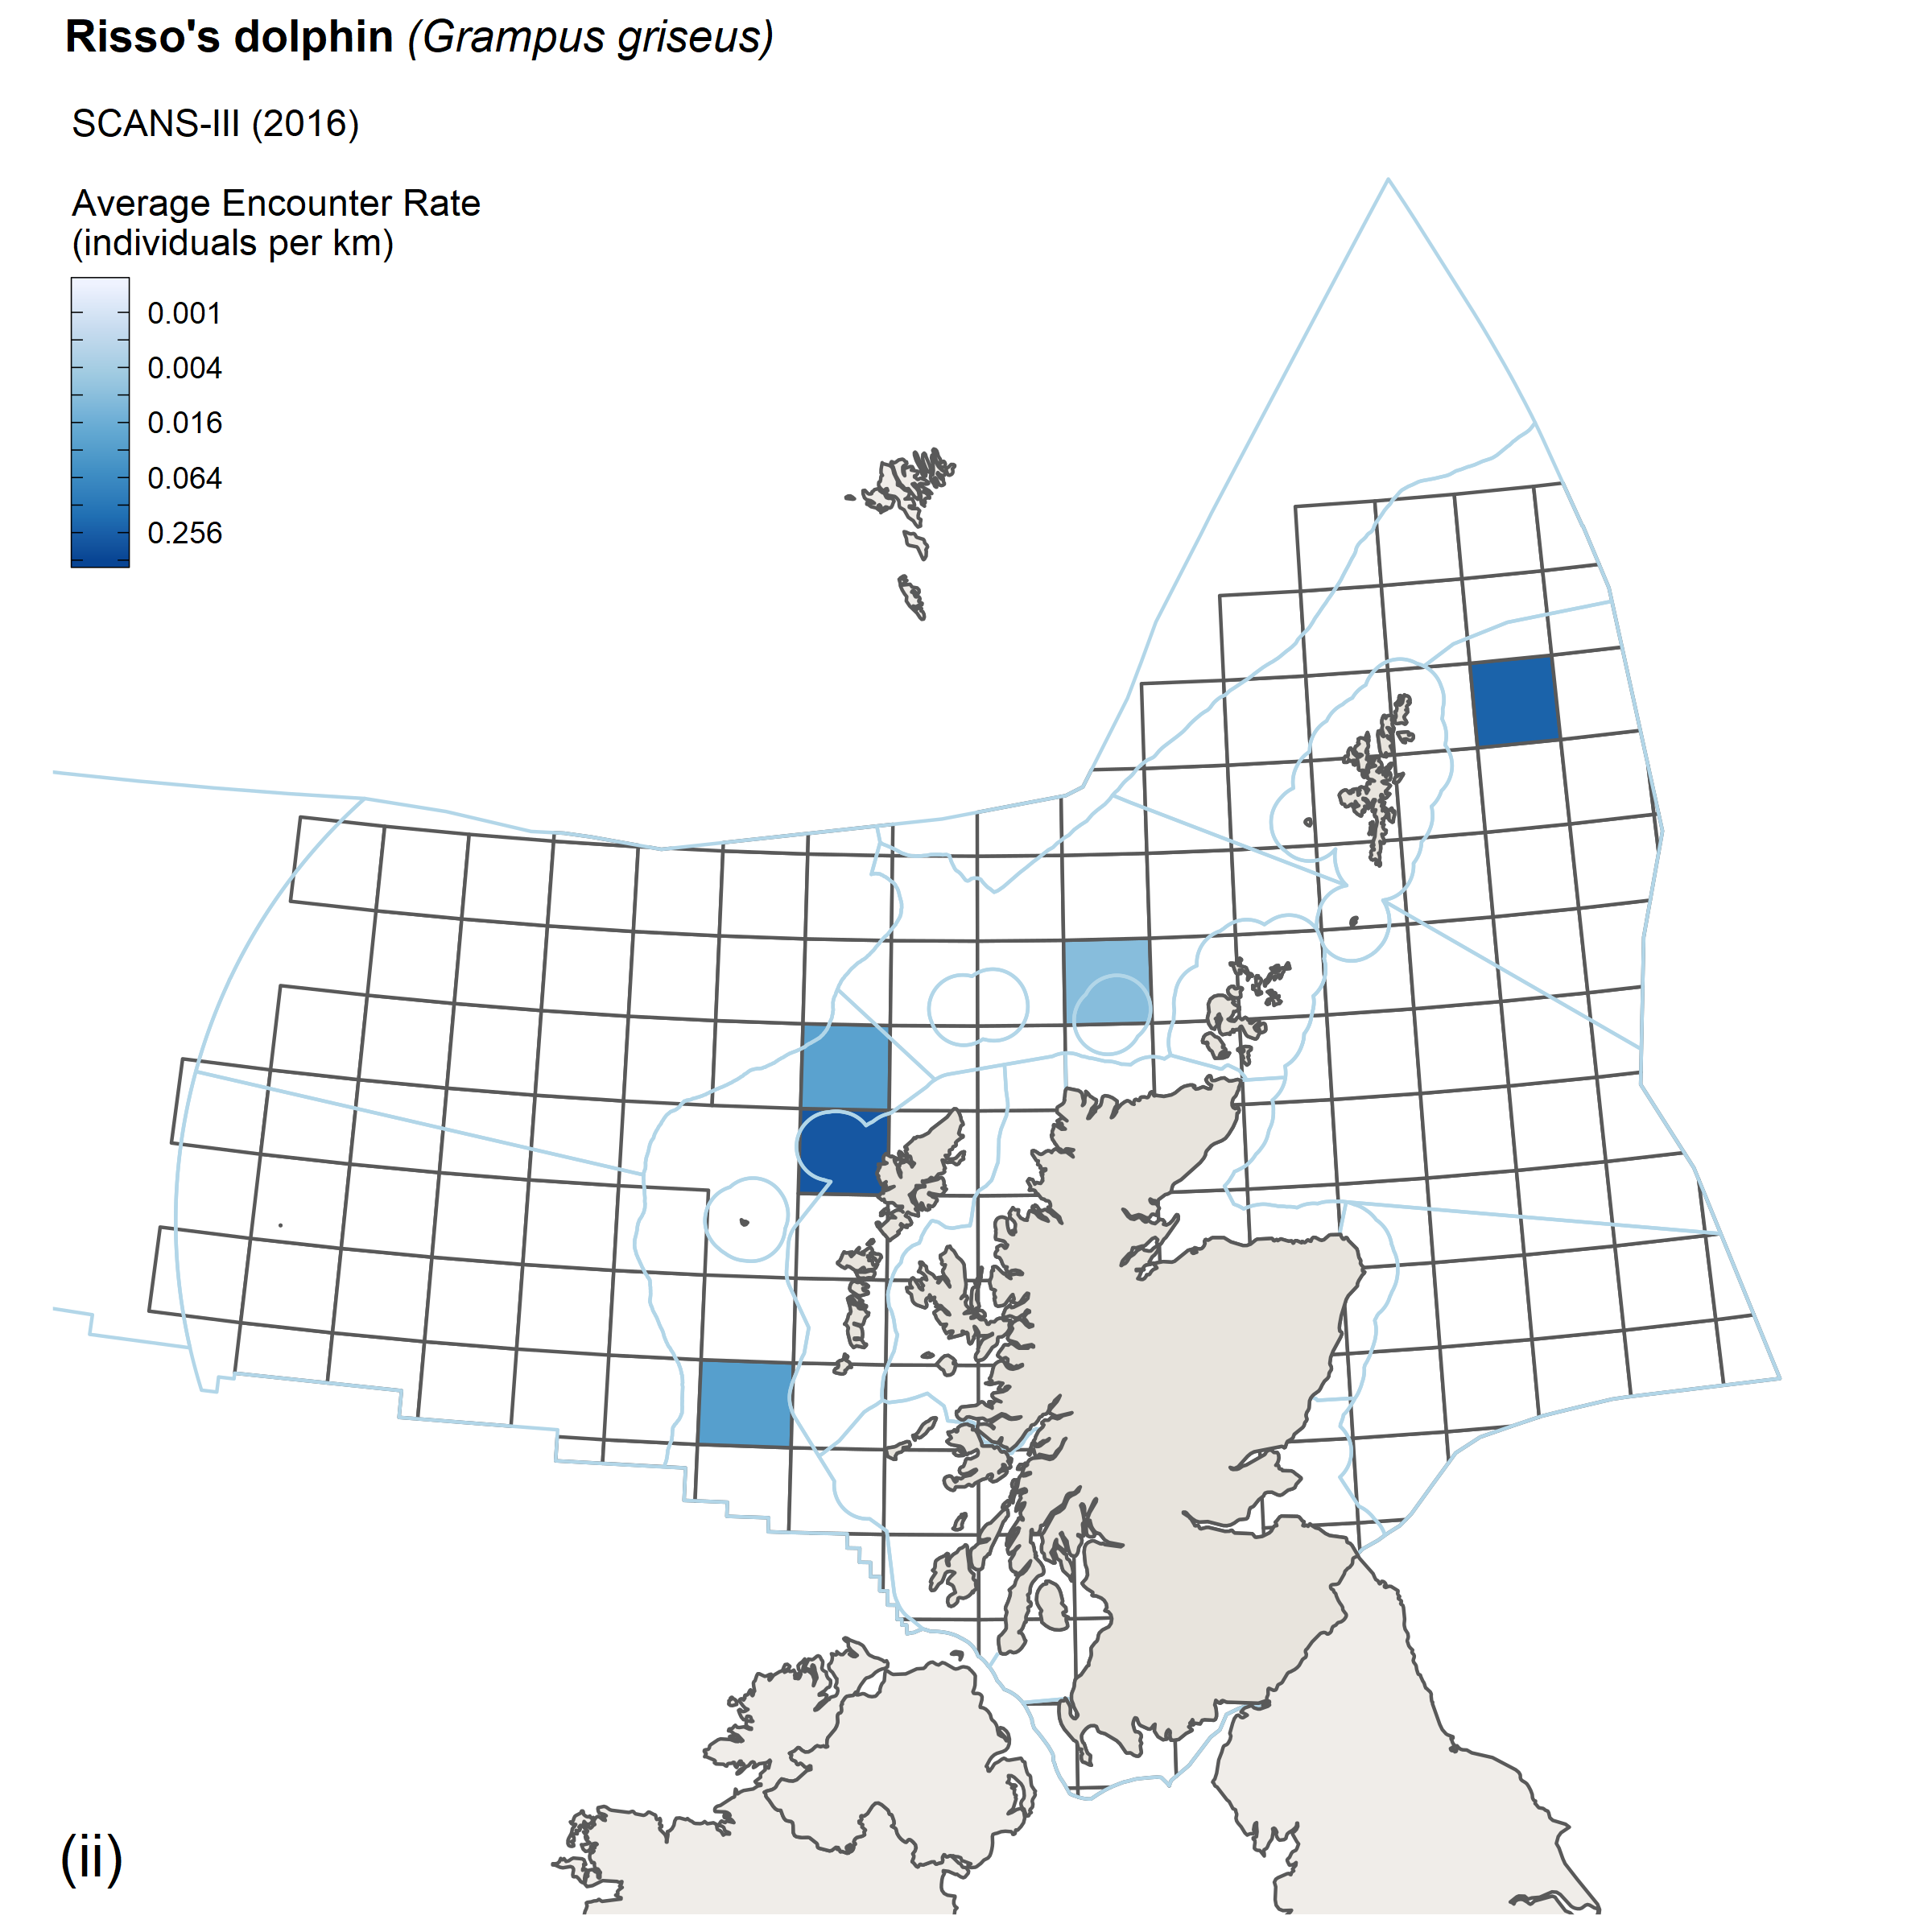 |
| Figure m: Encounter rates for Risso’s dolphins from (i) SCANS II/CODA survey, 2005/2007 and (ii) SCANS III survey, 2016. |
Coastal bottlenose dolphins
The largest population of coastal bottlenose dolphins in Scotland is found along the east coast, primarily between the Moray Firth and the Firth of Forth (Cheney et al., 2013), although bottlenose dolphins from this population do occur beyond this range and into English waters. Initial monitoring began in the 1990s and was restricted to the Moray Firth, at that time the core area for the population. In the 2000s it became apparent that the population was expanding its range southwards (Wilson et al., 2004). Population monitoring is now being regularly carried out in the Moray Firth SAC and in St Andrews Bay and the Tay estuary population is increasing (Arso Civil et al., 2019; Cheney et al., 2018) (Figure 5). Movements of individual dolphins between the east and west coasts, and even into Irish waters, have also been reported (Robinson et al., 2012).
Based on data from 2006-2007, a small resident community of around 15 bottlenose dolphins inhabits the Sound of Barra in the Outer Hebrides and approximately 30 range throughout the Inner Hebrides (Cheney et al., 2013), with prolonged (at least 2006-2013) social and geographic isolation between these communities (van Geel, 2016). The dolphins inhabiting the Sound of Barra show long-term summer site-fidelity, as well as year-round residency, and their population size has remained stable until 2013 when regular monitoring ceased (van Geel, 2016). No updated abundance estimate for the Inner Hebridean community has been attempted since then. The Scottish Association for Marine Science and the Hebridean Whale and Dolphin Trust are currently updating the west coast photo-ID catalogue, which will allow for minimal numbers to be obtained, based on annual census.
The summer abundance of coastal bottlenose dolphin on the east coast of Scotland has been estimated by Arso Civil et al. (2019) for the period 2009 to 2015 (Figure n).
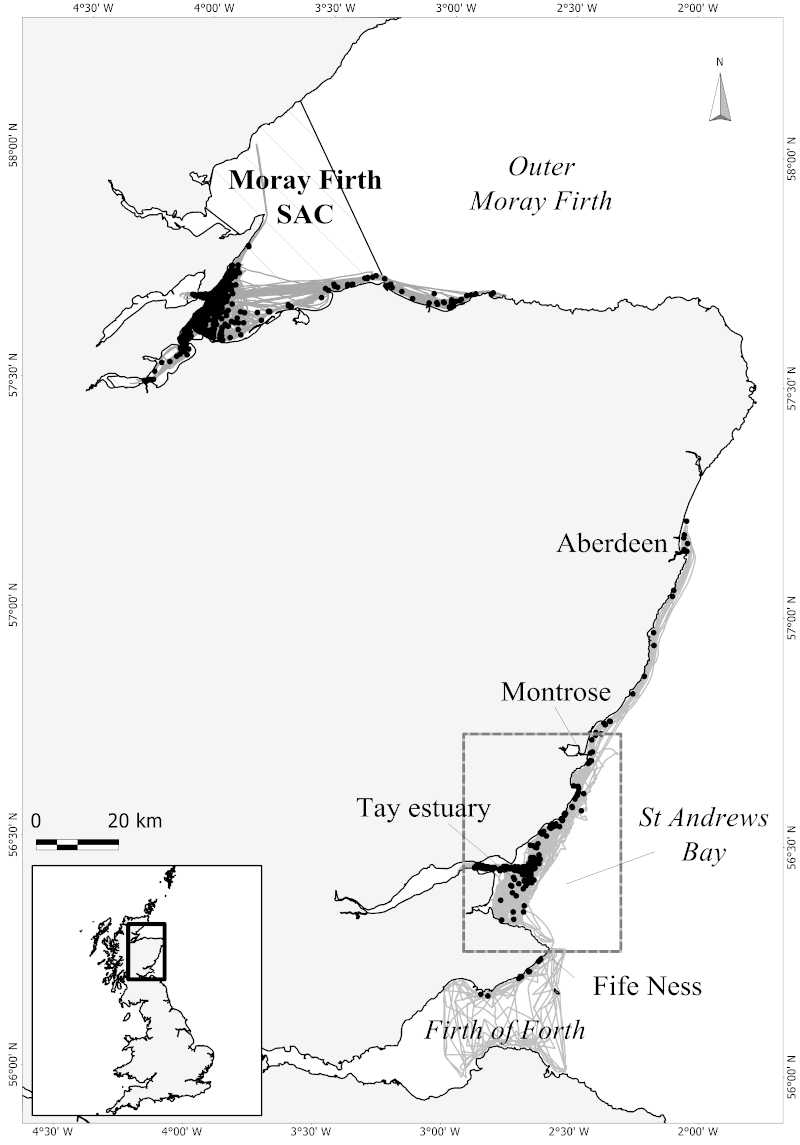
Figure n: Survey effort conducted from 2009 to 2015 (grey lines) with locations of bottlenose dolphin encounters (black dots), used to estimate summer abundance of bottlenose dolphins on the east coast of Scotland. (Source: Arso Civil et al., 2019).
The abundance of animals within the Moray Firth SAC has been stable between 2001 and 2016, while the overall population has increased and therefore the proportion of the population using the SAC has declined (Cheney et al., 2018). The St Andrews Bay and Tay Estuary as a combined area outside the SAC is now consistently used, on average, by 52.5% of the population every summer, with incomplete spatial mixing of individuals in the short term between this area and the Moray Firth SAC (minimum of ~6% of marked individuals seen in both areas per year and ~30% over the study period of 2009-2015, Figure o) (Arso Civil et al., 2019). The St Andrews Bay and the Tay Estuary combined area is now equally as important (in terms of presence of individuals in the summer) as the Moray Firth SAC. The modelling of presence-absence data in this part of the distributional range identifies the entrance to the Firth of Tay and waters around Montrose as areas of consistent high use by bottlenose dolphins (Figure p) (Arso Civil et al., 2019).Whilst small numbers of animals also inhabit the west coast of Scotland, they are not regularly monitored.
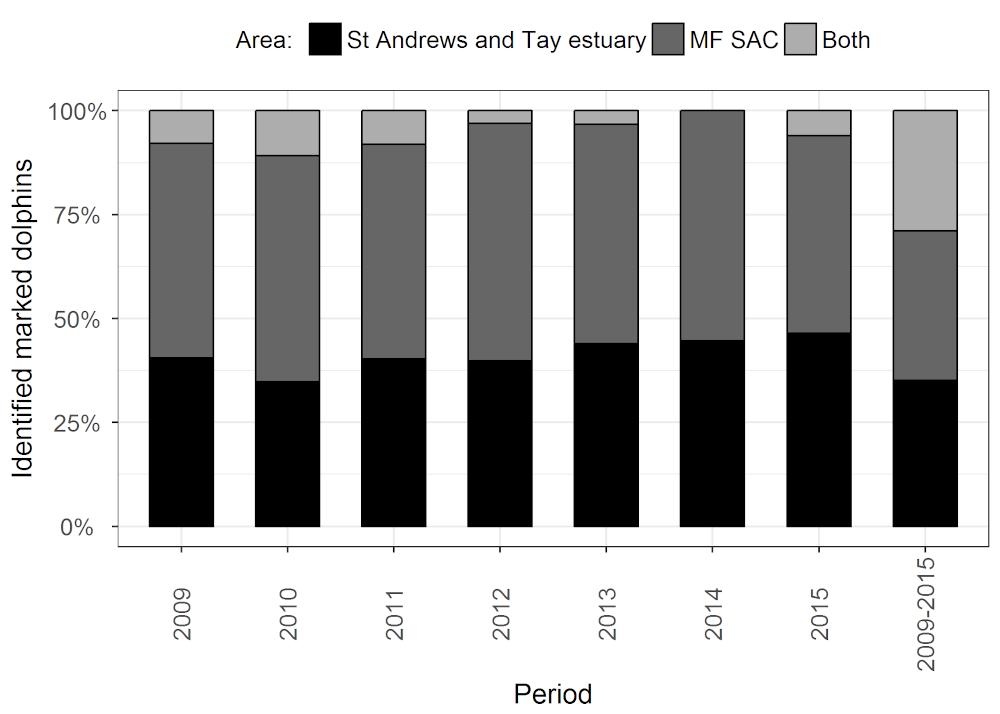
Figure o: Proportion of marked dolphins seen in each or in both sampling areas per year and overall between 2009 and 2015. (Source: Arso Civil et al., 2019).
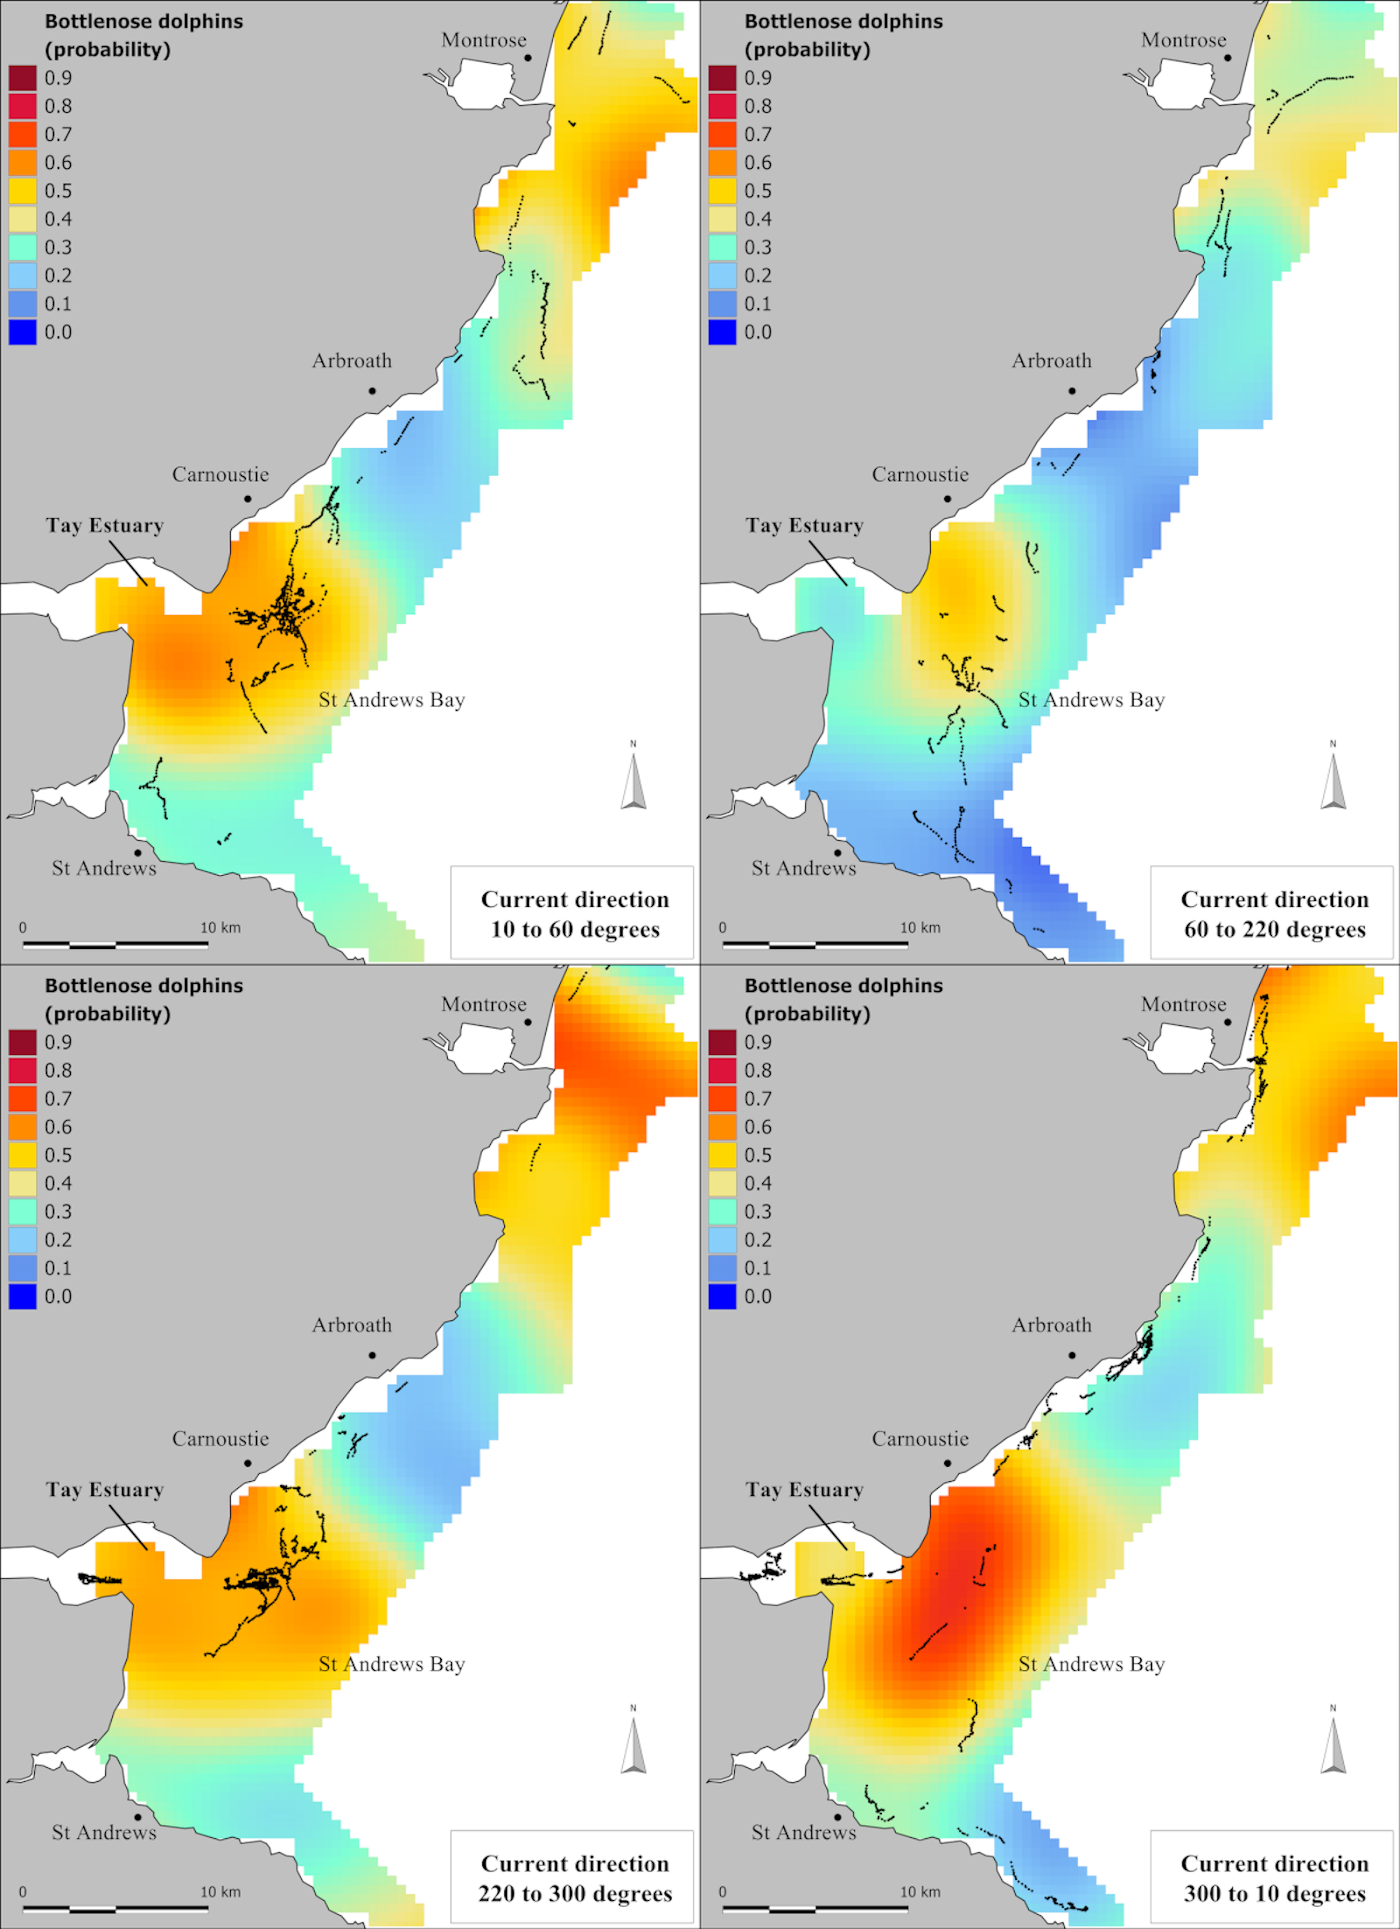
Figure p: Predicted probability of presence of bottlenose dolphins in St Andrews Bay and Tay Estuary combined area for different current directions, with associated bottlenose dolphin presence points recorded). (Source: Arso Civil et al., 2019).
Conclusion
Offshore cetaceans
Scottish offshore waters continue to be important for a range of cetacean species. In the Greater North Sea, only harbour porpoise, white-beaked dolphin and minke whale have more than two estimates of abundance since 1994 and the numbers for these species are stable. For harbour porpoise and minke whale the power to detect trends is good. In general, the recent abundance estimates for the dominant species (Atlantic white-sided dolphin, short-beaked common dolphin, striped dolphin, Risso's dolphin, long-finned pilot whale, sperm whale, beaked whales and fin whale) are mostly either very similar to or larger than earlier estimates.
Coastal bottlenose dolphins
Coastal bottlenose dolphins on the east coast have shown a marked change in their distribution over the last two decades or so. Their range has expanded, and abundance changed from stable to increasing (Arso Civil et al., 2019). The population is highly mobile within its main distributional range, and overall connectivity within the population is well stablished, Their range continues to expand as shown by increasing sightings south of the Firth of Forth.
Knowledge gaps
Offshore cetaceans
The results from large-scale international surveys have greatly expanded the knowledge of the distribution and abundance of cetaceans in the European Atlantic. However, knowledge gaps remain due to the infrequency of these surveys. For logistical reasons, large-scale surveys such as SCANS have been conducted during summer. Information is therefore lacking on large-scale seasonal changes in distribution.
Coastal bottlenose dolphins
The impacts of human activities on these populations are largely unknown, as are the status and population trends for the dolphins on the west coast.
Offshore cetaceans
Time series of information to assess status
Surveys to obtain robust information over the large scale are both logistically challenging and expensive and, as a result, there have been few in the region. The large-scale SCANS/CODA surveys covering a large proportion of North-East Atlantic waters have been organised only four times: SCANS in 1994, 2005 and 2016; CODA in 2007. In general, the time series of coordinated purpose-designed surveys for cetaceans occurring in Scottish waters is too short to allow status to be assessed in relation to both indicators of abundance and distribution. Surveys should continue, at a greater frequency to improve the power to detect smaller rates of decline. And increased frequency is especially relevant for harbour porpoise, for which the currently 11-year inter-survey interval means that almost all animals seen in a survey will have died before the next one. The preferred option would be to establish a European Atlantic-wide cetacean survey strategy, replacing the current ad hoc survey programme, to determine abundance and trends in cetacean populations and to provide a mechanism for using appropriate available and newly commissioned data.
Human effects on distribution and abundance
For human activities that have a direct negative impact on cetaceans (e.g. fisheries incidental bycatch and ship strikes) the impact on populations is, at least in theory, possible to assess. Ship-strikes of large cetaceans have been considered in a number of fora, including the particular problem of fast ferries. However, a lack of data on, for example, the number of animals killed by bycatch or ship strikes, make direct impacts difficult to assess.
For indirect impacts (e.g. underwater noise, prey depletion, habitat loss or degradation, chemical pollution and marine debris), it is much more difficult to quantify the number of animals affected and assess the impact at a population level.
Coastal bottlenose dolphins
For the east coast population, monitoring needs to continue and with indications that the species range is continuing to expand further down the east coast, studies of the rate and extent of this expansion are required. Due to this change over time, the way in which anthropogenic pressures and threats are managed need to be considered carefully (Arso Civil et al., 2019).
Status and trend assessment
| Region assessed | Coastal bottlenose dolphin | ||||
| Harbour porpoise | Comment | ||||
| Status with confidence | Trend with confidence | Status with confidence | Trend with confidence | ||
| North Sea |
 |
|
 |
|
Pre-2005 there was a southward shift in the distribution of harbour porpoise from the northern to the southern North Sea. Since 2005 there has been no change in distribution. Therefore, comparing with the abundance of harbour porpoise in the northern North Sea before 2005 with the current estimate would indicate a decrease. |
| West Coast | No data | No data | No data | No data | |
|
Region assessed |
White-beaked dolphin |
Minke whale |
All other species | ||
|---|---|---|---|---|---|
|
Status with confidence |
Trend with confidence |
Status with confidence |
Trend with confidence |
||
|
All SMRs |
|
|
|
|
Status and trend unknown for all other species and SMRs |
This Legend block contains the key for the status and trend assessment, the confidence assessment and the assessment regions (SMRs and OMRs or other regions used). More information on the various regions used in SMA2020 is available on the Assessment processes and methods page.
Status and trend assessment
|
Status assessment
(for Clean and safe, Healthy and biologically diverse assessments)
|
Trend assessment
(for Clean and safe, Healthy and biologically diverse and Productive assessments)
|
||
|---|---|---|---|
 |
Many concerns |
No / little change |
|
| |
Some concerns |
Increasing |
|
| |
Few or no concerns |
Decreasing |
|
 |
Few or no concerns, but some local concerns |
No trend discernible |
|
 |
Few or no concerns, but many local concerns |
All trends | |
 |
Some concerns, but many local concerns |
||
 |
Lack of evidence / robust assessment criteria |
||
| Lack of regional evidence / robust assessment criteria, but no or few concerns for some local areas | |||
 |
Lack of regional evidence / robust assessment criteria, but some concerns for some local areas | ||
| Lack of regional evidence / robust assessment criteria, but many concerns for some local areas | |||
Confidence assessment
|
Symbol |
Confidence rating |
|---|---|
|
Low |
|
|
Medium |
|
|
High |

Assessment regions
 and the Scottish Offshore Marine Regions (OMRs, O1 – O10)")
Key: S1, Forth and Tay; S2, North East; S3, Moray Firth; S4 Orkney Islands, S5, Shetland Isles; S6, North Coast; S7, West Highlands; S8, Outer Hebrides; S9, Argyll; S10, Clyde; S11, Solway; O1, Long Forties, O2, Fladen and Moray Firth Offshore; O3, East Shetland Shelf; O4, North and West Shetland Shelf; O5, Faroe-Shetland Channel; O6, North Scotland Shelf; O7, Hebrides Shelf; O8, Bailey; O9, Rockall; O10, Hatton.
 Regions. These have been used as the assessment areas for hazardous substances.")
, Regions.")