

Background
External visible disease is an indicator for the general health status of a population of fish. This indicator looks at nine specific diseases that are seen on the outside of the fish.
The data collected are run through a statistical programme to calculate the Fish Disease Index (FDI) for each individual fish. From this, an average index is calculated for the population in each biogeographic region and this is compared to the FDI assessment criteria established by experts in this field.
The diseases monitored include bacterial, viral and parasitic infections. However, fish health can be impacted by other environmental stressors including exposure to contaminants. These impacts can have a direct or indirect effect on fish health. Indirect effects include reducing the function of the immune system, which can lead to an increase in disease. Main sources of contaminant exposure include industrial waste, sewage discharge, agriculture, road run off and household and atmospheric depositions.
External visible fish disease is one of the general biological effects included in the Joint Assessment and Monitoring Programme (JAMP) recommended by OSPAR. However, this indicator is voluntary and not all contracting parties include the assessment of fish disease in their monitoring programmes. The Fish Disease Index approach is recommended by the International Council for the Exploration of the Sea (ICES) as an assessment tool to include in an integrated monitoring and assessment programme on hazardous substances and their biological effects. This indicator is included in the contaminants and effects monitoring that is undertaken in Scottish coastal and offshore areas as part of the UK Clean Seas Environment Monitoring Programme (CSEMP). CSEMP exists to ensure a coordinated monitoring programme across the United Kingdom.
CSEMP contaminant and biological effects data (including fish disease) are submitted to the UK Marine Environment Monitoring and Assessment National database (MERMAN), and from there to the ICES Environmental database. Marine Scotland Science (MSS) assess fish disease as part of their annual CSEMP cruise. Data were submitted to MERMAN and used in this assessment.
External visible disease is an ecosystem health indicator and has been used in environmental monitoring since the 1980s. Fish are visually inspected for the presence and severity of nine different diseases or parasites including:
- Lymphocystis
- Epidermal hyperplasia / papilloma
- Skin ulcerations
- Fin rot
- X-cell gill disease
- Hyperpigmentation
- Stephanostomum baccatum
- Acanthochondria cornuta
- Lepeophtheirus pectoralis
Further details of these diseases can be found in ICES TIMES no. 19 (Bucke, Vethaak, Lang & Mellergaard, 1996). Although many of these diseases are caused by pathogens including bacteria, viruses and parasites, the aetiology of disease is multifactorial and other environmental factors are very influential including osmotic stress, anaerobic sediments, overcrowding, nutritional deficiencies, seasonal changes, oxygen deficiencies and pollution levels (Mellergaard & Nielsen, 1995; Vethaak, 1992; Vethaak & Jol, 1996; Winzer, Winston, Becker, Van Noorden & Köhler, 2001).
Some of these diseases have also been directly associated with contaminant exposure (Tysklind et al., 2013; Vethaak et al., 1992; Vethaak et al., 1996). Other factors like age, sex and genetics can also affect fish disease (Stentiford, Bignell, Lyons, Thain & Feist, 2010; Tyskind et al., 2013).
The overall disease status of an organism is a result of the sum and severity of its diseases (ICES, 2012). Studies in the past focused on a few diseases and reported prevalence of individual diseases (Mellergaard & Nielsen, 1997; Lang, Mellergaard, Wosniok, Kadakas & Neumann, 1999).
The ICES Working Group on Pathology and Diseases of Marine Organisms (WGPDMO) developed a method to assess the diseases together using a standardised, weighted mean strategy (Lang & Wosniok, 2008; ICES, 2012). This holistic approach is regarded as a strong tool for disease data analysis (Lang et al., 2017b). Furthermore, use of this tool as an ecosystem health indicator has recently highlighted a relationship between mercury concentrations and the health status of dab (Lang et al., 2017a).
Fish diseases are monitored as part of the UK Clean Seas Environment Monitoring Programme (CSEMP). External visible fish disease data were collected from common dab (Limanda limanda), following ICES TIMES no. 19 (Bucke, Vethaak, Lang, & Mellergaard, 1996). Briefly, fish are collected and sorted by species, length and sex. Various biometric measurements are taken and otoliths are also sampled and analysed to determine the age of the fish. Fish are visually inspected for the presence and severity of nine different diseases or parasitic infections, including epidermal hyperplasia/papilloma, fin rot/erosion, hyperpigmentation, lymphocystis, skin ulcerations, X-cell gill disease, Acanthochondria cornuta, Lepeophtheirus sp. and Stephanostomum baccatum.
The assessment was undertaken with data from common dab using a method developed by ICES Working Group on Pathology and Diseases of Marine Organisms (WGPDMO). The WGPDMO developed a tool to analyse and assess fish disease data where individual diseases are not assessed independently but as a whole (ICES, 2012). A Fish Disease Index (FDI) is calculated for individual fish based on:
- presence or absence of the nine diseases;
- intensity of disease with three severity grades;
- suspected impact of the disease on the host (weighted by expert judgement).
Adjustment factors were made to compensate for effects of sex, length and sampling season. Full details of the method are described by Lang & Wosniok (2008). Both individual and mean FDIs were calculated in R statistical environment (version 3.6.1) using code kindly provided by Dr Werner Wosniok (University of Bremen, Germany). Only data from common dab were assessed as the assessment methodology has not been finalised for other species. The mean standardised FDI was compared to OSPAR assessment criteria. This tool has only been developed for use in common dab therefore, although MSS hold data for other species, this is not included in the assessment.
Background Assessment Criteria (BAC) and Environmental Assessment Criteria (EAC) (Table a) have been developed to determine whether observed levels of fish disease (expressed as the Fish Disease Index, FDI) are:
- near background (FDI < BAC);
- elevated but still considered at an acceptable level (BAC < FDI < EAC);
- at a significantly elevated level which indicates environmental harm (FDI > EAC).
The assessment criteria were devised from empirical data from the German long-term fish disease monitoring programme collected between 1986 and 2010 from the North Sea and the Baltic Sea. Specific assessment criteria have been determined for these two sea areas (Table a). The BAC and EAC are higher for the North Sea because there is a higher background level of external fish disease here. A general assessment criteria has also been determined by combining the data from the North Sea and the Baltic Sea. The general assessment criteria allows for comparison over multiple regions. For all assessment criteria, the BAC is calculated based on the lowest 10th percentile of all mean FDI values per sampling campaign and area. The EAC is calculated based on the relationship between the mean FDI and the mean Condition Factor (CF) of the population (Fulton's CF = weight*100/length3), and is equal to the mean FDI that is associated with a 10% loss in condition factor, which is regarded as an unacceptable health effect (ICES, 2012).
Data collected from CSEMP cruises between 2010 and 2019 were used for the assessment. Four biogeographic regions around Scotland have been included in the assessment – Irish Sea (Clyde and Solway), Minches and Western Scotland, Northern North Sea and Scottish Continental Shelf (Figure 1). However, there are substantially less data available for some biogeographic regions, especially the Scottish Continental Shelf and Minches and Western Scotland biogeographic region. The general assessment criteria (Table a) were used to assess all regions. For further analysis of the Northern North Sea, data from this area were also compared to the North Sea specific assessment criteria.
|
|
North Sea specific
|
Baltic Sea specific
|
General
|
|
BAC
|
3.59
|
1.11
|
1.51
|
|
EAC
|
8.83
|
1.32
|
6.72
|
For fish disease, the sampling stations are fixed locations which MSS samples as part of the annual CSEMP winter cruise programme. However, not all sites are sampled annually; sampling frequency varies dependent upon the site-specific risk(s) from hazardous substances (1, 3 or 6 years). A site is visited annually if above the EAC/EAC proxy, 3 years if between the BAC and EAC/EAC proxy and 6 yearly if below BAC. Sampling takes place in winter to avoid the spawning season and to maintain consistent time series.
Results
Between 2010 and 2019 external fish disease was assessed in common dab from 16 sampling locations around Scotland which covered four biogeographic regions – Northern North Sea, Scottish Continental Shelf, Minches and Western Scotland, and Irish Sea (Clyde and Solway) (Figure 1). The number of sampling events per station varied from annual visits to every six years.
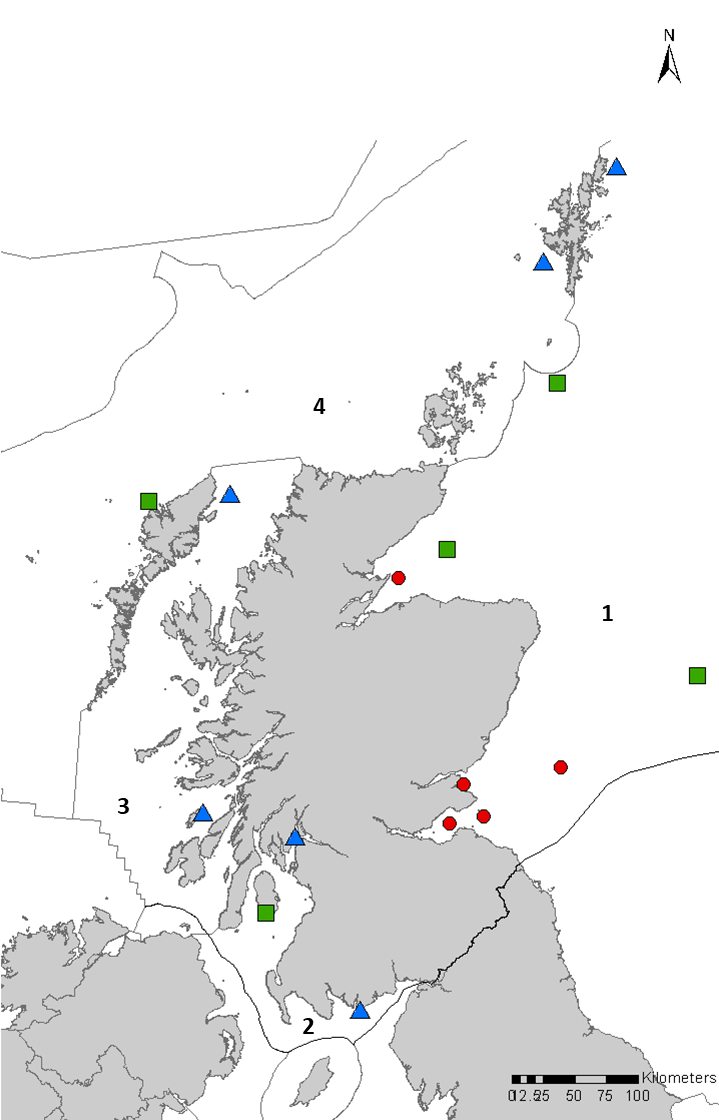
Figure 1: Sampling locations and most recent annual assessment status. Blue triangle = FDI below BAC. Green square = FDI greater than BAC but below EAC. Red circle = FDI exceeds EAC. BAC and EAC are general assessment criteria used across all regions for fair comparison. 1, Northern North Sea; 2, Irish Sea (Clyde and Solway); 3, Minches and Western Scotland; 4, Scottish Continental Shelf.
An annual average Fish Disease Index (FDI) was calculated for each biogeographic region based on the presence and severity of external fish disease observed. This was compared to OSPAR species specific Background Assessment Criteria (BAC) and Environmental Assessment Criteria (EAC). The BAC determines if observed fish disease is at background or elevated. Furthermore, EAC identifies if the degree of fish disease is causing significant harm. A FDI below the EAC indicates an acceptable health status.
In the Irish Sea (Clyde and Solway), the FDI was usually found to be above background but not of significant concern (Table 1). The FDI analysis only has considerable data for two sites and increasing the number of sites would increase confidence in the data. However, these preliminary results indicate that the health status of the populations of fish sampled in the Irish Sea (Clyde and Solway) was acceptable.
There were limited data available for an assessment of the Minches and Western Scotland. However, tentative results indicate that external fish disease was below background (Table 1).
In the Northern North Sea, the FDI status was above the EAC in three of the reporting years (2013, 2017 and 2019). In all other years, the FDI status was above background but below levels of significant concern (Table 1). An elevated level of disease has previously been reported in the Northern North Sea (Lang et al., 2017) and the FDI results presented here are fairly typical for this area.
There were limited data available for an assessment of the Scottish Continental Shelf. However, tentative results signify that external fish disease was not at a level of concern, with one year below background and the other year below the EAC (Table 1).
There were no clear trends in the mean FDI of common dab observed at the biogeographic scale.
|
Biogeographic region
|
2010
|
2011
|
2012
|
2013
|
2014
|
2015
|
2016
|
2017
|
2018
|
2019
|
|
Irish Sea (Clyde and Solway)
|
< EAC
|
< BAC
|
< EAC
|
-
|
-
|
< EAC
|
< EAC
|
< EAC
|
< EAC
|
< BAC
|
|
(1)
|
(2)
|
(1)
|
(0)
|
(0)
|
(2)
|
(2)
|
(1)
|
(2)
|
(1)
|
|
|
Minches and Western Scotland
|
< BAC
|
< BAC
|
-
|
< BAC
|
-
|
-
|
-
|
-
|
< BAC
|
-
|
|
(1)
|
(1)
|
(0)
|
(1)
|
(0)
|
(0)
|
(0)
|
(0)
|
(2)
|
(0)
|
|
|
Northern North Sea
|
< EAC
|
< EAC
|
< EAC
|
> EAC
|
< EAC
|
< EAC
|
< EAC
|
> EAC
|
< EAC
|
> EAC
|
|
(4)
|
(3)
|
(2)
|
(3)
|
(3)
|
(3)
|
(3)
|
(2)
|
(3)
|
(5)
|
|
|
Scottish Continental Shelf
|
-
|
-
|
-
|
-
|
< BAC
|
-
|
-
|
-
|
-
|
< EAC
|
|
(0)
|
(0)
|
(0)
|
(0)
|
(2)
|
(0)
|
(0)
|
(0)
|
(0)
|
(1)
|
A mean standardised FDI was calculated from 16 sampling location (Figure 1) at individual time points for each sampling event. This was combined to make a regional assessment (Table 1). Mean standardised FDI was compared to OSPAR assessment criteria (Table a) to determine the impact of disease on the health status of the common dab fish populations sampled.
Confidence in the data and assessment
Sampling for external visible fish disease as part of the CSEMP cruises began in 2010 so the FDI assessment was not included in the 2011 Atlas (Baxter et al., 2011). For assessment of external visible fish disease, quality assurance procedures are in place through the Biological Effects Quality Assurance in Monitoring Programme (BEQUALM) including extensive training and standardised protocol. Data are collected regularly and consistently and are also submitted to MERMAN. Therefore, there is high confidence in the quality of the data used in this assessment.
The FDI assessment follows a standardised protocol and the statistical coding used for the assessment was written and developed by world expert Dr Werner Wosniok (University of Bremen, Germany). It has been used in previous assessments including the 2017 UK Marine Strategy Framework Directive Assessment. Therefore, there is also high confidence in the assessment method.
Irish Sea (Clyde and Solway)
The mean FDI in the Irish Sea (Clyde and Solway) was below the BAC in 2 of 8 years sampled (2011 and 2019) (Figure a). In all other years sampled the FDI was above background but below the EAC which is considered no cause for concern. In 2013 and 2014 there were no external fish disease data collected from this region. The health status in the Irish Sea (Clyde and Solway) can be considered stable as no apparent trends were observed (Figure a).
The Irish Sea (Clyde and Solway) region includes the Clyde, a highly industrialised area which has resulted in high concentration of contaminants. Nonetheless, from the external fish disease data available, the health status of common dab in this area is satisfactory. There are only three sampling stations included in the biogeographic region (Figure 1) and most of the data are from sites which have failed other contaminant assessments. Holy Loch, an impacted site in the Clyde historically home to submarine bases, is sampled annually; a site in the Solway Firth is sampled less frequently, there are data available from five years; and Pladda, a secondary Clyde site, has only been sampled for external fish disease once to date.
Although below levels of concern, an upward trend can be seen in the fish disease monitoring at Holy Loch (Figure a), although there was a sharp decline below background in the most recent year of sampling (2019). The reason for the apparent upward trend is unknown and does not correspond to the contaminant assessments, which show either stable or downward trends. There were no apparent trends observed in the data from Solway (Figure a). Generally, in the Irish Sea (Clyde and Solway) the fish health status is stable and the FDI was usually found to be above background, but not of significant concern, indicating that the fish health status in this area is acceptable.
In future assessments, increasing the number of sites included would increase confidence in the data.
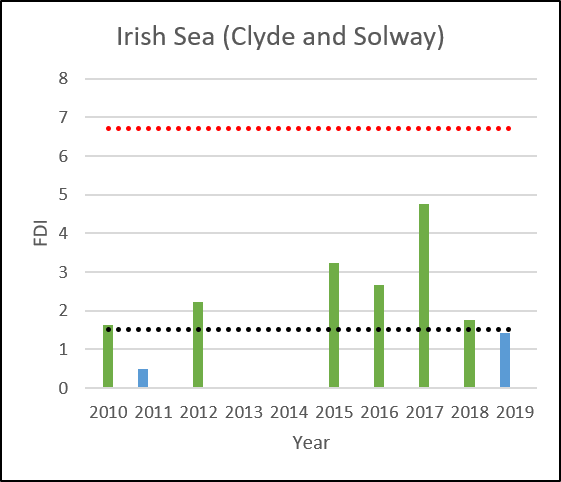
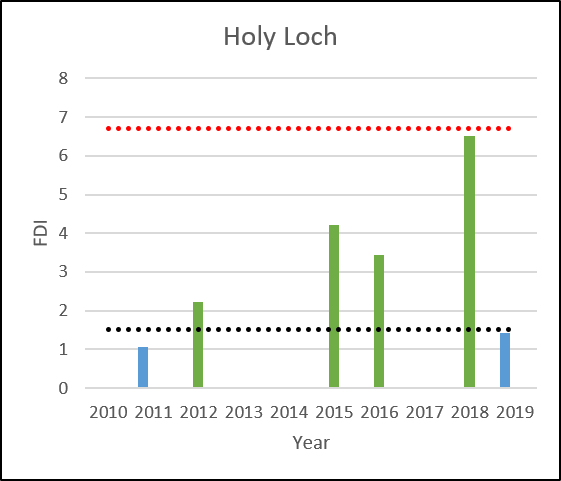
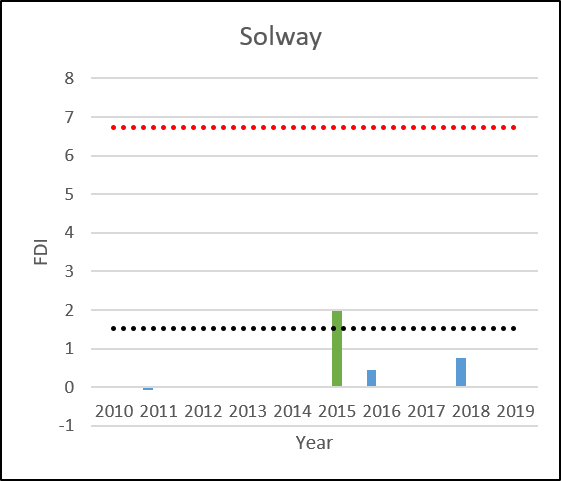
Figure a: FDI assessment of the Irish Sea (Clyde and Solway) with individual site data where more than four time points are available. Background Assessment Criteria (dotted black line) and Environmental Assessment Criteria (dotted red line). Blue = below the BAC. Green = above the BAC but below the EAC. Red (patterned) = above the EAC.
Minches and Western Scotland
The FDI data from the Minches and Western Scotland biogeographic region were below background in all years sampled (Table 1, Figure b). However, there are only data from two sites available in this assessment (Figure 1). The North Minch site was sampled 4 times in the sampling period and the other site, Colonsay, was only sampled once. No apparent trends were observed in data from the North Minch site (Figure b).
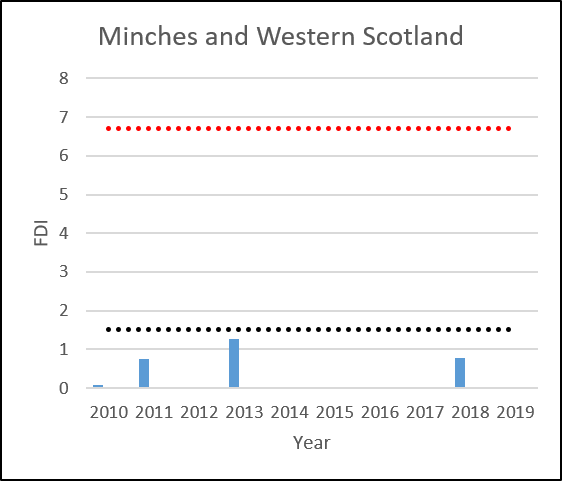
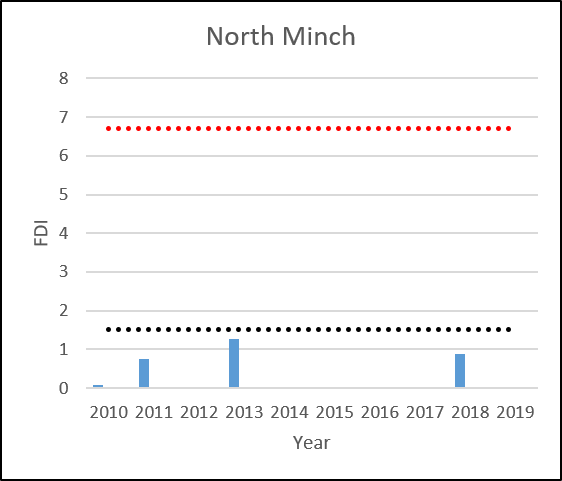
Figure b: FDI assessment of the Minches and Western Scotland with individual site data where more than four time points are available. Background Assessment Criteria (dotted black line) and Environmental Assessment Criteria (dotted red line). Blue = below the BAC. Green = above the BAC but below the EAC. Red (patterned) = above the EAC.
Northern North Sea
There are considerably more data available for the Northern North Sea region than other Scottish biogeographic regions. There are nine sampling locations included in this assessment (Figure 1). The FDI status was above the general EAC in three of the reporting years (2013, 2017 and 2019). In all other years, the FDI status was above background but below levels of significant concern.
The high level of fish disease observed in some years is contrary to other Hazardous Substances and Effects assessments for the Northern North Sea, where most contaminant concentrations are considered acceptable and reported as below the EAC or EAC proxy. An elevated level of disease has previously been reported in the Northern North Sea (Lang et al., 2017) and the FDI results presented here are fairly typical for this area. When compared to assessment criteria designed specifically for the Northern North Sea, the level of FDI drops below the threshold that indicates significant harm is occurring (Figure c). There were no clear trends in the health status of flatfish observed from the Northern North Sea at the biogeographical scale (Figure c).
MSS has a reasonable data set from a number of sampling locations in the Northern North Sea. Montrose Bank is sampled annually and there are 10 years of data from this site (Figure c). An upward trend, of unknown reason, in external fish disease can be seen from the Montrose Bank site. In the most recent year of sampling Montrose Bank was above the EAC, both general and North Sea specific. An upward trend was also observed at the outer Moray Firth site until 2014. The reason for the increase in fish disease is unknown. However, since then there has only been one sampling point which showed the health status had improved. There is no link to the contaminant assessments at either of these sites, which show either stable or downward trends. One site in Shetland, South East of Bressay, was below background in all years sampled, and is considered stable (Figure c). Data are available from a number of other sites in the Northern North Sea including the Firth of Forth, St Andrews Bay and a number of offshore sites (Figure 1). There are insufficient time points from these sites to discern any trends.
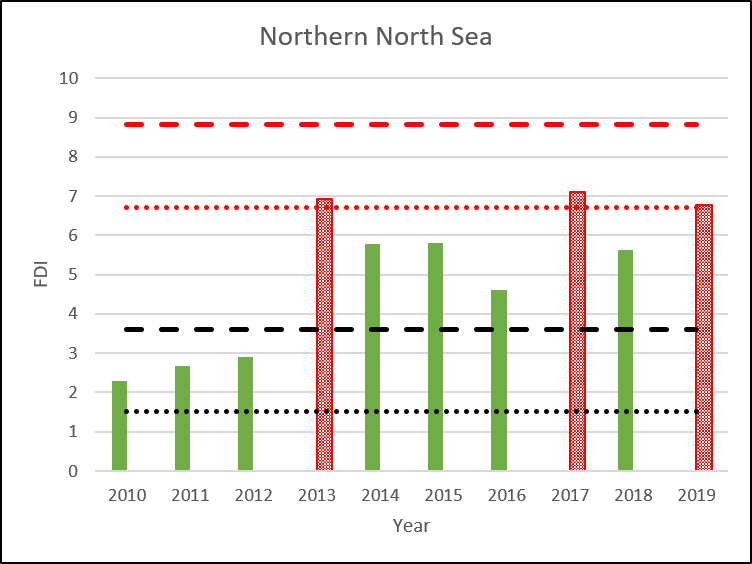
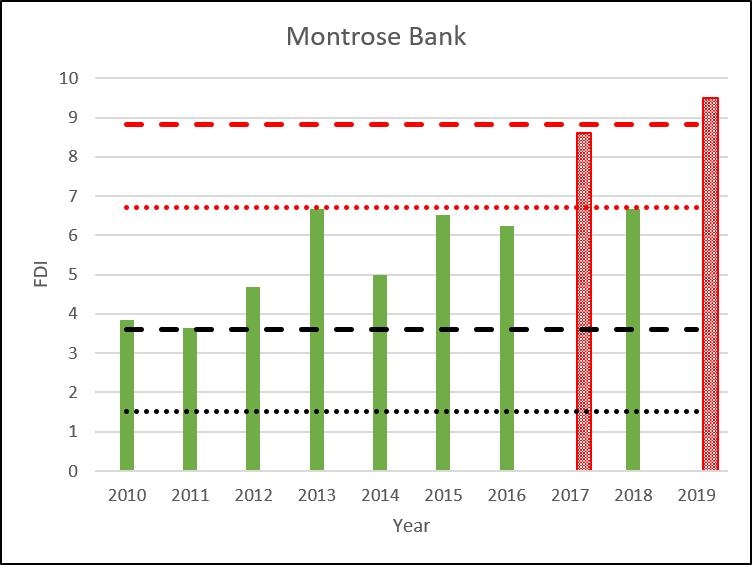
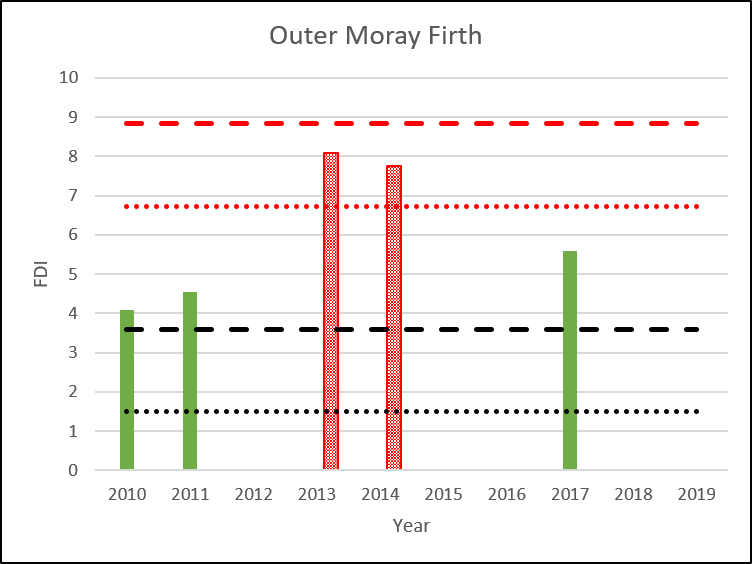
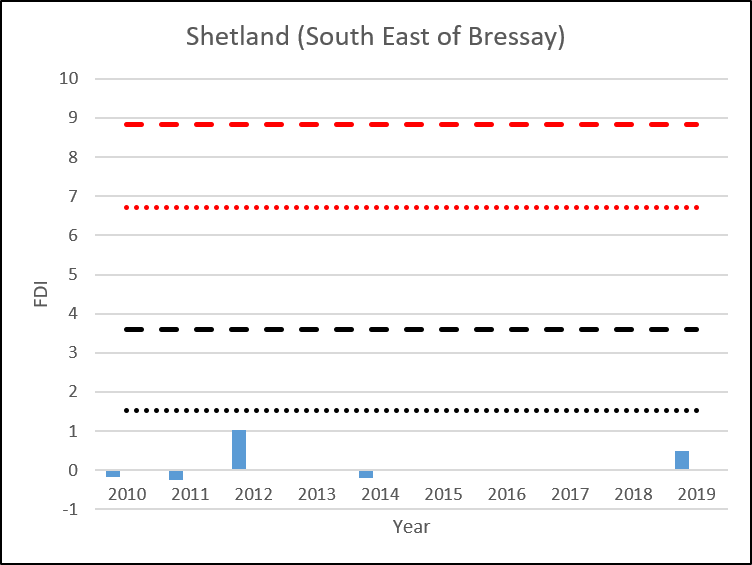
Figure c: FDI assessment of the Northern North Sea with individual site data where more than four time points are available. Background Assessment Criteria (dotted black line) and Environmental Assessment Criteria (dotted red line). Assessment criteria specific for North Sea area also included (dashed lines). Blue = below the BAC. Green = above the BAC but below the EAC. Red (patterned) = above the EAC.
Scottish Continental Shelf
There were only two sites sampled in the Scottish Continental Shelf biogeographic region, one in the Hebrides and one in West Shetland (Figure 1). In 2014 these were both assessed as below background. In 2019 the Hebrides site was sampled again, this time the FDI was elevated above background but not of significant concern. There are very little data available for an assessment of this biogeographic region. However, from the data available, external fish disease was not at a level of concern.
Scottish Marine Regions
Eleven Scottish Marine Regions (SMRs) were created by The Scottish Marine Regions Order 2015 which cover sea areas extending out to 12 nm. Regional assessments to support Regional Marine Plans are required to be developed for each SMR by the relevant Marine Planning Partnership.
The CSEMP sampling design is based on the biogeographic regions used within UK and Marine Strategy Framework Directive (MSFD) assessments. Therefore, there are insufficient data for a regional assessment for all SMRs. In particular, most SMRs have no, or few, monitoring stations with the required species. Further work is needed to undertake an assessment at the SMR level. However, each SMR is contained within a biogeographic region or, in some cases, straddles two biogeographic regions (Shetland and Outer Hebrides). Table b shows the SMR and the biogeographic region(s) they are in. Moving forward, additional monitoring stations would be required to enable regional assessments in each SMR.
|
SMR
|
Biogeographic region
|
|
Argyll
|
Minches and Western Scotland
|
|
Clyde
|
Irish Sea (Clyde and Solway)
|
|
Forth and Tay
|
Northern North Sea
|
|
Moray Firth
|
Northern North Sea
|
|
North Coast
|
Scottish Continental Shelf
|
|
North East
|
Northern North Sea
|
|
Outer Hebrides
|
Scottish Continental Shelf
Minches and Western Scotland
|
|
Orkney Islands
|
Scottish Continental Shelf
|
|
Shetland Isles
|
Northern North Sea (east Shetland)
Scottish Continental Shelf (west Shetland)
|
|
Solway
|
Irish Sea (Clyde and Solway)
|
|
West Highlands
|
Minches and Western Scotland
|
Conclusion
The Fish Disease Index analysis of common dab showed that the fish health status in the Irish Sea (Clyde and Solway), Scottish Continental Shelf and Minches and Western Scotland was satisfactory, although there were limited data for some areas. The level of disease observed in common dab in the Northern North Sea was acceptable in seven of the ten years assessed. However, in three years of the years assessed, the fish disease was elevated above a level that indicates significant harm. This is not unexpected for this area, and has previously been reported.
Fish health is complex with multiple contributing factors. The health status in common dab found in this assessment contrasts with the concentrations of hazardous substances. The contaminant assessments show that concentrations of contaminants in the Northern North Sea are acceptable indicating that the increase in fish disease in some years is not due to exposure to contaminants. Furthermore the Clyde, a highly industrialised and more contaminated area with higher concentrations of hazardous substances, had a low FDI indicating acceptable health status. There were no clear trends in the mean FDI of common dab observed at the biogeographic scale.
Although there were no clear trends in the mean FDI of common dab observed at the biogeographic scale, there was evidence of an upward trend at some individual stations including Holy Loch (Irish Sea (Clyde and Solway)), Montrose Bank (Northern North Sea) and the Outer Moray Firth (Northern North Sea) from 2010 – 2014 only. Holy Loch did not exceed the EAC, but Montrose Bank and the Outer Moray Firth both exceeded the EAC in 2017 & 2019 and 2013 & 2014 respectively.
The CSEMP sampling design was based around the biogeographic regions used in OSPAR and MSFD assessments. Therefore there are insufficient data for status and trend assessments of all SMRs. Each SMRs will be within a biogeographic region, however in most SMRs there will be no or few stations.
Knowledge gaps
There are a lack of data available in some Scottish biogeographic regions. To improve this, further monitoring stations are required in the Irish Sea (Clyde and Solway), Minches and Western Scotland, and Scottish Continental Shelf. Since there are only assessment criteria available for common dab, this further limits the available data, especially in areas like the Irish Sea (Clyde and Solway) where there are sufficient fishing sites for most other contaminant assessments. However, a different species of fish is currently sampled from these locations making them unsuitable for inclusion in the fish disease assessment.
Further work into the links between FDI and contaminant exposure would be useful as this assessment of fish health has contrasting conclusions to the other contaminant assessments. Inclusion of emerging contaminants would also be helpful as only a limited number of contaminants are monitored.
Development of assessment criteria for other species of fish at an international level would be useful. MSS collect fish disease data from European flounder and Atlantic cod, however lack of assessment criteria means these data cannot be included in the assessment.
The statistical package developed for the assessment is a basic programme that does not account for a number of additional variables including the risk based sampling strategy, i.e. different sites are sampled each year and the number of fish sampled at each site can vary. Further refinement of the tool is underway, and incorporating these additional elements will increase confidence in the assessment. Furthermore, future development of the tool will include the addition of confidence intervals, which will bring an improvement.
The Fish Disease Index is currently restricted to analysis and assessment of externally visible diseases. Expansion to incorporate macroscopic liver neoplasms and liver histopathology data is intended. MSS have collected these data in conjunction with the external disease data since 2010, and will be able to construct this analysis as soon as it becomes available.
The assessment criteria were designed for use across all marine areas, but were devised with data from the North Sea and the Baltic Sea only. The Baltic Sea is enclosed and has low salinity, and the North Sea is semi-enclosed. Refinement of the assessment criteria including analysis of data from other sea areas such as those that are influenced by open Atlantic waters, for example Western Scotland, would be beneficial.
Status and trend assessment
This status and trend assessment is an overall assessment for Contaminants in sediment and biota (PAHs, PCBs, PBDEs and metals in sediment and biota) and Biological effects of contaminants.
|
Region assessed
|
Status with confidence
|
Trend with confidence
|
Comments
|
|---|---|---|---|
|
Irish Sea (Clyde and Solway)
|
 |
|
Green square with red triangle for status indicates few or no concerns as a whole, but many local concerns, particularly in the Clyde, with some sites exceeding the EAC/EAC-proxy. Two stars for confidence in the status is due to lack of suitable assessment criteria for some determinands (metals in biota and some biological effects measurements)
|
|
Minches and Western Scotland
|
 |
|
Two stars for confidence in the status is due to lack of suitable assessment criteria for some determinands (metals in biota and some biological effects measurements). In addition there is limited fish sites which impacts on the ability to make biological effects assessments.
|
|
Northern North Sea
|
|
|
Two stars for confidence in the status is due to lack of suitable assessment criteria for some determinands (metals in biota and some biological effects measurements)
|
|
Scottish Continental Shelf
|
|
|
One star for confidence in the status is due to lack of suitable assessment criteria for some determinands (metals in biota and some biological effects measurements). In addition this region could not be assessed for all determinand/matrix combinations due to the lack of sites
|
This Legend block contains the key for the status and trend assessment, the confidence assessment and the assessment regions (SMRs and OMRs or other regions used). More information on the various regions used in SMA2020 is available on the Assessment processes and methods page.
Status and trend assessment
|
Status assessment
(for Clean and safe, Healthy and biologically diverse assessments)
|
Trend assessment
(for Clean and safe, Healthy and biologically diverse and Productive assessments)
|
||
|---|---|---|---|
 |
Many concerns |
No / little change |
|
 |
Some concerns |
Increasing |
|
 |
Few or no concerns |
Decreasing |
|
 |
Few or no concerns, but some local concerns |
No trend discernible |
|
| |
Few or no concerns, but many local concerns |
All trends | |
 |
Some concerns, but many local concerns |
||
 |
Lack of evidence / robust assessment criteria |
||
| Lack of regional evidence / robust assessment criteria, but no or few concerns for some local areas | |||
 |
Lack of regional evidence / robust assessment criteria, but some concerns for some local areas | ||
| Lack of regional evidence / robust assessment criteria, but many concerns for some local areas | |||
Confidence assessment
|
Symbol |
Confidence rating |
|---|---|
|
Low |
|
|
Medium |
|
|
High |

Assessment regions
 and the Scottish Offshore Marine Regions (OMRs, O1 – O10)")
Key: S1, Forth and Tay; S2, North East; S3, Moray Firth; S4 Orkney Islands, S5, Shetland Isles; S6, North Coast; S7, West Highlands; S8, Outer Hebrides; S9, Argyll; S10, Clyde; S11, Solway; O1, Long Forties, O2, Fladen and Moray Firth Offshore; O3, East Shetland Shelf; O4, North and West Shetland Shelf; O5, Faroe-Shetland Channel; O6, North Scotland Shelf; O7, Hebrides Shelf; O8, Bailey; O9, Rockall; O10, Hatton.
 Regions. These have been used as the assessment areas for hazardous substances.")
, Regions.")