
Background
Large scale production of plastics began in the 1950s and since then plastics of various types have formed an increasing percentage of the litter found in the marine environment, with a higher percentage of plastics in beach and floating litter as opposed to seabed litter. Microplastics are pieces of plastic whose longest dimension is 5 mm or less (Figure 1).
Microplastics have two sources. Primary microplastics are manufactured for a specific purpose, e.g. resin pellets (commonly called nurdles) or the microplastics in personal care products. Secondary microplastics result from the breakdown of big litter into smaller fragments over time, or wear and tear of other plastic items such as car tyres. Plastics (primary and secondary) can also contain a wide variety of chemicals either added as part of the manufacturing process e.g. flame retardants, plasticisers, or adsorbed from the environment over time.
The widespread presence of microplastic particles and their potential uptake by marine life is of increasing concern given the capacity of plastic particles to absorb and transport pollutants. Microplastic fragments (particles and fibres) may be eaten by marine life potentially causing obstruction and physical damage to their digestive tracts.
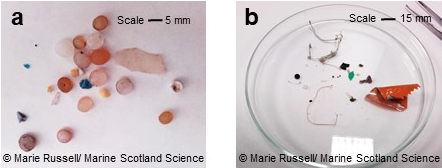
Figure 1: Examples of plastic material collected in the sampling net. This includes nurdles (a) and fibres and film (b). Note the larger scale for (b).
Marine litter is the collective term for ‘any persistent manufactured or processed solid material discarded, disposed of or abandoned in the marine and coastal environments, including material lost at sea in bad weather’ (Galgani, Hanke, Werner, & de Vrees, 2013).
The predominant type of marine litter is plastic and polystyrene of various types, with a higher percentage of plastics and polystyrene in beach and floating litter as opposed to seabed litter. Large scale production of plastics began in the 1950s (Geyer, Jambeck & Law, 2017) and since then plastics of various types have formed an increasing percentage of the litter found in the marine environment (on beaches, at the sea surface, in the water column and on the seabed). Plastic litter is now recognised as a major global environmental problem (G7 Leaders Declaration, 2015; Sutherland et al., 2010). Plastic can form a large proportion of floating litter (Ryan, Moore, van Franeker & Moloney, 2009) and this coupled with its resistance to degradation means it has the ability to travel long distances in the oceans.
The total global production of plastics from 1950 to 2015 has been estimated with some confidence at 8.2 Gt (Geyer, Jambeck & Law, 2017). It is not known how much of this has entered the marine environment. The amount of plastics in the oceans today has not been reliably estimated. However, it is estimated that for the Greater North Sea coastline that the percentage of plastic in marine litter was 70 to 80%, whereas it was approximately 38% on the seabed. Marine litter can be transported to the oceans via multiple mechanisms including riverine transport, sewage overflow, leisure activities on beaches or at sea and also by the wind (Veiga et al., 2016).
Plastic litter in the oceans can be broadly divided into the following size categories (Kershaw, Turra & Galgani, 2019):
- Mega-litter >1 m
- Macro-litter 25 - 1000 mm
- Meso-litter 5 - 25 mm
- Micro-litter <5 mm
- Nano-litter < 1 µm.
For practical purpose the lower size limit for microplastics in seawater is taken as 330 µm (Arthur, Baker & Bamford, 2009): this is the mesh size of nets used to capture plankton and floating debris, and commonly used to trap floating microplastic litter (Löder & Gerdts, 2015). This means though that particles < 330 µm will be undersampled (Kershaw, Turra & Galgani, 2019).
There are two main categories of microplastics:
- Primary microplastics: Intentionally produced for direct use, or as pre-cursors to other products. Some examples of these are pre-production plastic pellets (nurdles), exfoliants and industrial abrasives (Arthur, Baker & Bamford, 2009).
- Secondary microplastics: Formed from the breakdown of larger plastic material, especially marine debris, and the rate of formation would depend on the characteristics of the plastics, extent of weathering and the local environment (Arthur, Baker & Bamford, 2009).
Whilst microplastics have been present in our oceans for many decades concerns about their impact have been growing over recent years. The abundances of mega- and macro- plastic litter appear to have reached a relatively steady state. At the same time the average size of plastic particles in the environment seems to be decreasing, and the abundance and global distribution of microplastic fragments has increased over the last few decades (Barnes, Galgani, Thompson & Barlav, 2009). Microplastic litter is not as well or as easily monitored as mega- and macro-plastic litter. Therefore it may appear that plastic litter is decreasing when it fact it is degrading to microplastics (by photo-degradation or mechanical degradation or both).
The widespread presence of microscopic plastic particles and their potential uptake by filter-feeding organisms is of increasing concern given the capacity of plastic particles to absorb, transport and release pollutants (OSPAR, 2010). The first occurrences of microplastics (strictly plastic spherules) and their ability to accumulate polychlorinated biphenyls (PCBs) were reported over 40 years ago in Long Island Sound (Carpenter, Anderson, Harvey, Miklas & Peck, 1972).
Microplastics in the marine environment can undergo a variety of processes, some may sink, some may be washed ashore, some may also continue to float and some may be ingested by wildlife such as seabirds and sea turtles (Gregory, 2009). Browne, Dissanayake, Galloway, Lowe, & Thompson, (2008) investigated ingestion, translocation and accumulation of plastic debris of < 1 mm in size using blue mussels (Mytilus edulis) under laboratory conditions. They demonstrated the potential for microplastics to accumulate in organisms, but concluded that further work was required to establish any biological consequences.
Evidence from lab studies and wild populations indicate the possibility of sublethal chemical effects in some wild animals (Veiga et al., 2016) but there are many factors which may affect this – how much the animal eats, how long the microplastic particle is retained in the gut and the gut conditions (for example, pH and temperature). Contaminants can also reach the animal from its environment or from its normal food source (Bakir, O`Connor, Rowland, Hendriks, & Thompson, 2016).
Due to the lack of common sampling and analytical methods estimates for the amount of microplastic in the marine environment are highly uncertain. At the Tacoma workshop (Arthur, Baker, & Bamford, 2009) the complex issues of the occurrence, effects and fate of microplastics were discussed in depth. It was thought that there were a lack of data to demonstrate conclusively the negative impact of microplastics to the marine environment and the participants felt this was the largest and most critical gap to fill. Also critical was research into the ability of microplastics to adsorb contaminants from their environment and, even more importantly, their ability to leach out contaminants to the marine environment and to any species which has ingested the plastic. Microplastics already contain a range of potentially harmful substances such as flame retardants, plasticisers and antimicrobials, increasing the potential pollutant burden (Rochman, 2015). This will be true of most, if not all, plastics but the greater surface to volume ratio of microplastics will increase the potential for leaching.
Zarfl & Matthies (2010) attempted to estimate the flux of organic pollutants to the Arctic via atmospheric and oceanic current transport and the flux transported on or within plastic pieces (not necessarily microplastics). They concluded that ‘traditional’ vectors accounted for several tonnes of organic pollutants whilst the ‘plastics’ vector accounted for several orders of magnitude less. These were rough estimates only, due to the lack of more robust flux data, and did not take into account the effects of bioaccumulation.
OSPAR are developing a common indicator for microplastics in sediments but currently there are no assessment criteria for microplastics at the sea surface. The Marine Strategy Framework Directive (MSFD) aim for micro-litter is that “The composition, amount and spatial distribution of micro-litter on the coastline, in the surface layer of the water column, and in seabed sediment, are at levels that do not cause harm to the coastal and marine environment”. There are as yet no assessment criteria developed by OSPAR.
This is a first assessment of microplastics in sea surface waters in Scotland.
The assessment is based on geographic distribution over the winter sampling seasons from 2013/14 – 2019/20. There are no assessment criteria to apply therefore this is an initial survey of the data based on counts of total microplastics and counts of microplastics separated into fibres, films, nurdles, beads, fragments, paint flakes and polystyrene.
Sea surface microplastics were collected from 2013/14 to 2019/20 (Figure a), almost all on the CSEMP (Clean Seas Environmental Monitoring Programme) winter sampling cruises. The primary purpose of the winter sampling cruises is to collect nutrient, chemical and biological effects monitoring samples. Piggybacking microplastic sampling on cruises with a different sampling purpose is the usual scenario, due to the expense of a dedicated cruise. Not all areas were sampled in every year and the number of sampling sites also varied by year (Figure a).
All Scottish Marine Regions (SMRs) are covered plus some sites in five Offshore Marine Regions (OMRs) (Rockall, Hebrides Shelf, East Shetland Shelf; Fladen and Moray Firth Offshore; Long Forties). Sites in the five OMRs are mapped but were not assessed as currently too few points/years.
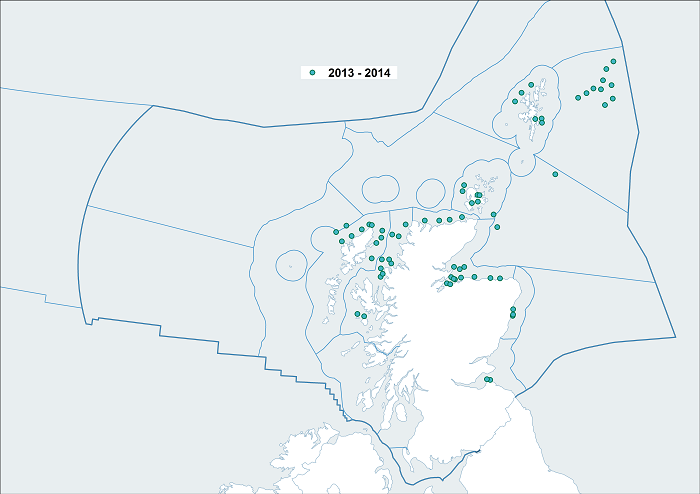
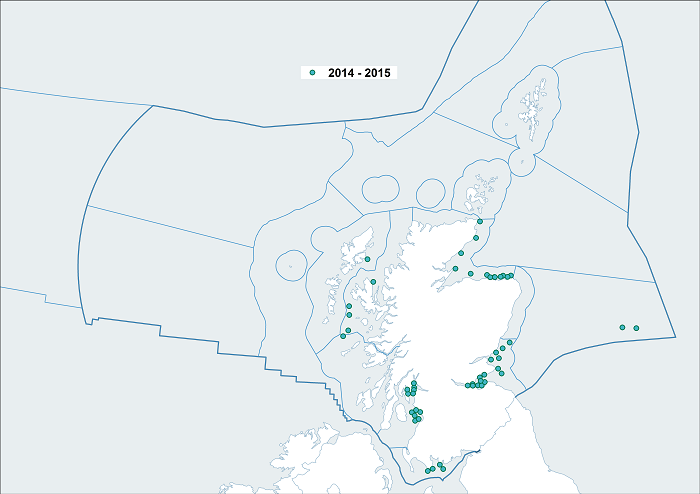
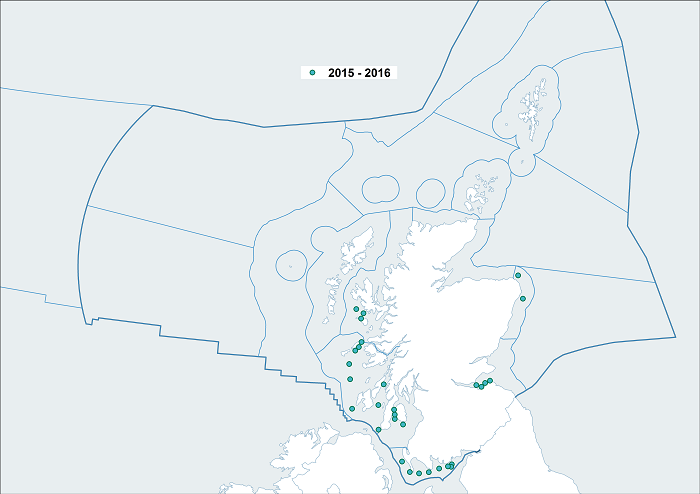
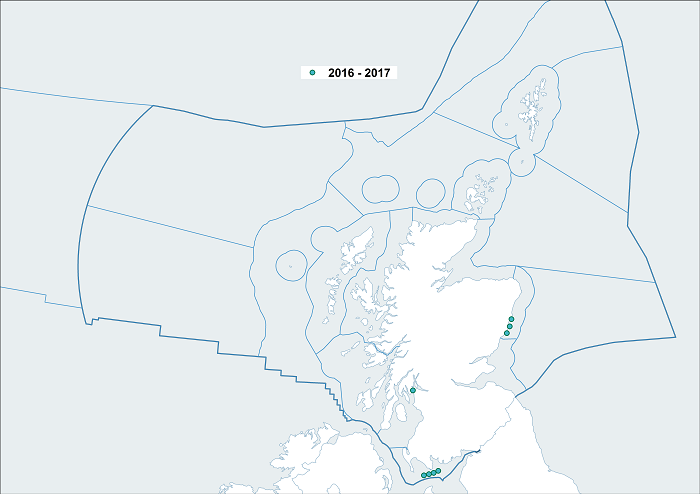
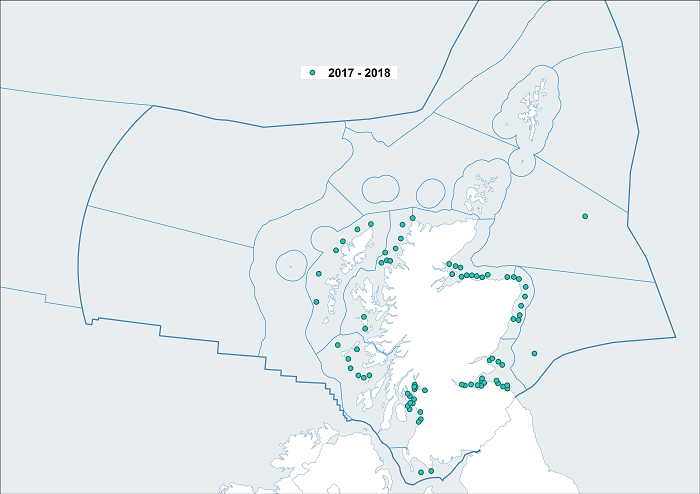
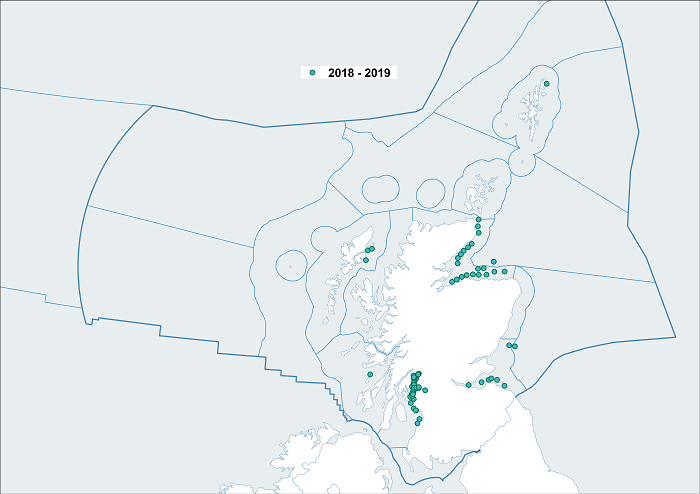
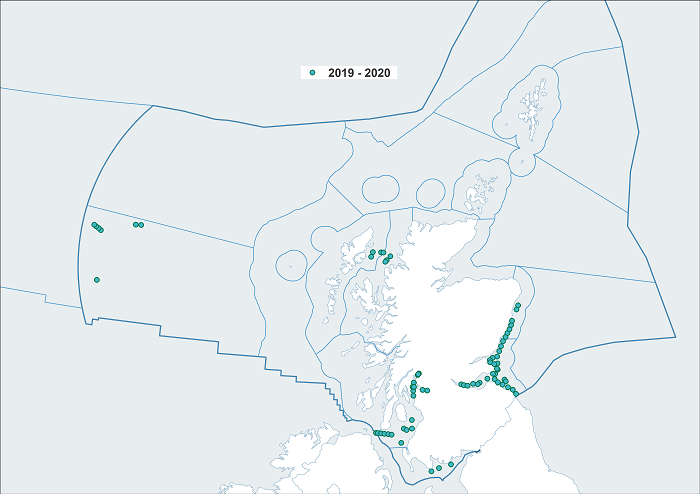
Figure a: Location of sea surface microplastic sampling from winter 2013/2014 to winter 2019/2020 for the Scottish Marine Regions (SMRs) and the Offshore Marine Regions (OMRs).
Sea surface water samples were collected with a 333 μm neuston net mounted on a catamaran swimmer body (Neuston Net acc. to David/Hempel Model 300, supplied by Duncan & Associates, Cumbria, England) (Figure b).

The geographical position of the start and end of each tow was recorded. In order to compensate for currents and tides a flow meter was attached to the subsurface net frame (at the front of the net) and the number of revolutions of the flow meter recorded. One revolution of the flow meter equals 0.3 m and the trawled distance was calculated by multiplying the number of revolutions by 0.3.
The catamaran was towed clear of the ship’s wake with the net sampling approximately the top 10 cms of the sea surface. This was variable depending on sea conditions but had no effect on the results which are based on trawled distance not volume through the net. Towing times varied from 15 minutes to over 1 hour, depending on the available time and/or sea surface conditions. Once towing was completed the net was held vertical and the whole net rinsed with seawater into the cod end and the material in the cod end. The cod end is a rigid PVC bucket with a side window covered with a 333 μm mesh which allows seawater to drain out but retains any material larger than 333 μm. The cod end was detached from the net and the material in the cod end transferred to a 5 mm aperture sieve on top and a 125 µm sieve on the base, using fresh water to rinse out the cod end. The material was then rinsed through the 5 mm sieve using fresh water.
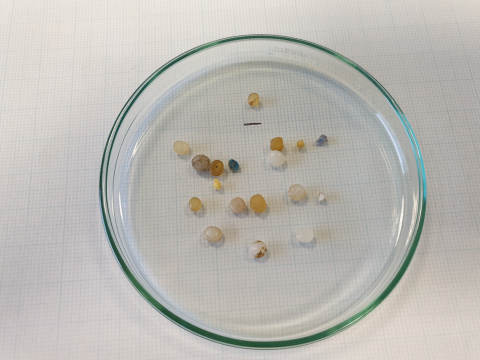
The material collected in the 125 µm sieve was examined and the microplastic particles collected and counted into categories - fibres, films, nurdles, beads, fragments, paint flakes and polystyrene. The examination and picking of microplastics was carried out by two people as a cross check that everything was collected. A blank glass slide covered in double sided sticky tape was used to record if there was any contamination during counting. Although not included in this assessment material greater than 5 mm in its longest dimension was also collected and counted in the same categories. Post cruise a selection of microparticles were analysed by microscopy fourier transform infrared spectrometry (microFTIR) to confirm that they were microplastics.
All collected microplastics were retained for further analysis and archiving.
The numbers of plastic items were standardised to number of items per square kilometer of sea surface as follows:
A flowmeter was used for each tow and the trawled distance (XTow) calculated. The net mouth width (WNet) is 0.39 metres. The number of items per km2 was calculated using the following equation:
Items per km2 = number of items*106/(XTow * WNet)
The data are presented as ‘winter’ sampling seasons – e.g. October 2013 to end January 2014 is termed 2013-2014. Two exceptions are 2013-2014 where the season extended to May 2014 and 2019-2020 where the season began in September 2019.
Results
Three hundred and seventy two (372) sample sites are within a Scottish Marine Region (SMR) (Figure 2a) and all eleven SMRs were sampled at least once during the period 2014-2020. The remaining sites (26) are within an Offshore Marine Region (OMR) (Figure 2b).
Not all SMRs were sampled in every year and the number of sampling sites also varied (Table 1). These variations were due to a number of factors such as the primary purpose of the cruise having precedence but also the prevailing wind and sea conditions as sea surface sampling for microplastics requires calm or relatively calm seas.
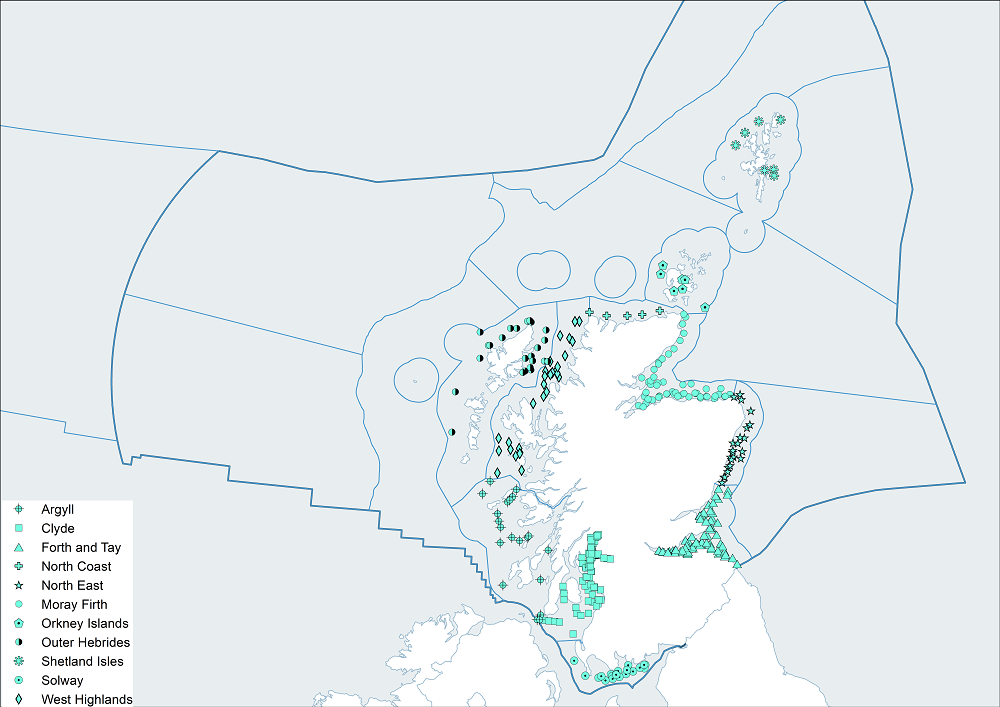
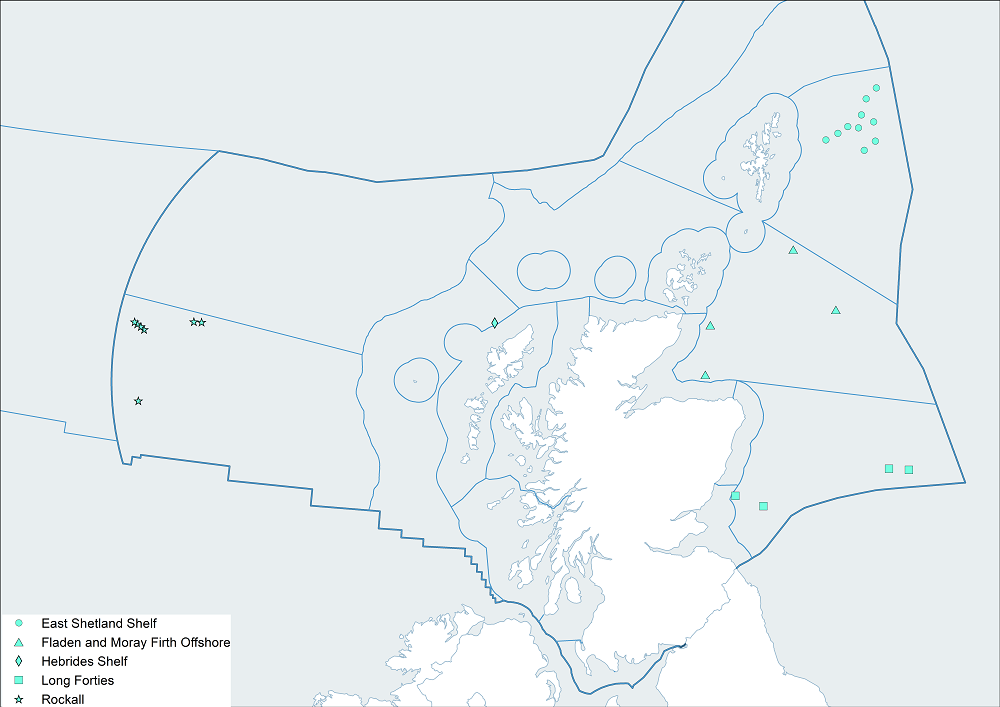
Figure 2: Sample sites (a) SMR and (b) OMR. Table 1 gives details of sampling per season.
|
|
2013-2014
|
2014-2015
|
2015-2016
|
2016-2017
|
2017-2018
|
2018-2019
|
2019-2020
|
TOTAL
|
|
Argyll
|
|
1
|
9
|
|
7
|
1
|
2
|
20
|
|
Clyde
|
|
12
|
4
|
1
|
15
|
54
|
19
|
105
|
|
Forth and Tay
|
2
|
16
|
4
|
|
17
|
7
|
28
|
74
|
|
Moray Firth
|
12
|
11
|
|
|
11
|
20
|
|
54
|
|
North Coast
|
4
|
2
|
|
|
1
|
|
|
7
|
|
North East
|
3
|
|
2
|
3
|
8
|
|
7
|
23
|
|
Orkney Islands
|
7
|
|
|
|
|
|
|
7
|
|
Outer Hebrides
|
10
|
1
|
|
|
6
|
3
|
4
|
24
|
|
Shetland Isles
|
6
|
|
|
|
|
1
|
|
7
|
|
Solway
|
|
4
|
8
|
4
|
2
|
|
3
|
21
|
|
West Highlands
|
11
|
4
|
3
|
|
9
|
|
3
|
30
|
|
E. Shetland Shelf
|
10
|
|
|
|
|
|
|
10
|
|
FL & MF Off
|
2
|
|
|
|
1
|
1
|
|
4
|
|
Hebrides Shelf
|
1
|
|
|
|
|
|
|
1
|
|
Long Forties
|
|
2
|
|
|
1
|
1
|
|
4
|
|
Rockall
|
|
|
|
|
|
|
7
|
7
|
|
TOTALS
|
68
|
53
|
30
|
8
|
78
|
88
|
73
|
398
|
The concentration of microplastics per square kilometre of sea surface varied across areas (Figure 3).
Although microplastics were found in all of the sea areas sampled almost 35% of the 398 sites (includes OMRs) surveyed between 2013/14 and 2019/20 contained no microplastics (Figure 3). The Clyde, in particular Loch Long, and the Solway SMRs on the west coast and the Forth and Tay SMR on the east coast have the highest concentrations with some sites having over 45,000 microplastics per km2 of sea surface. The Argyll SMR on the west coast has elevated microplastic concentrations, though not as high as the Clyde, Solway and Forth and Tay SMRs. The North East, Moray Firth, North Coast, Orkney Islands and Shetland Isles SMRs all have relatively low concentration (< 5,000 microplastics per km2 of sea surface). The OMRs also have relatively low concentrations (< 5,000 microplastics per km2 of sea surface, except for 2 sites on the East Shetland Shelf).
The Clyde and the Forth and Tay SMRs are offshore of the most urbanised and industrial areas in Scotland and this is likely to be the reason for the higher concentrations of microplastics for these two areas. In the Clyde SMR the highest concentrations are near the head of Loch Long and could be attributed to microplastics being transported up the Loch from the more urbanised areas in the Firth of Clyde. The Solway SMR is surrounded by one of the least densely populated areas in Scotland but is to the north of some very densely populated and industrialised areas in England. For the Argyll SMR the coastal current is generally north-eastwards and may be transporting microplastics into this area. Additional microplastics could be sourced from the wider Atlantic Ocean though the magnitude of this possible source is unknown.

Figure 3: Sea surface microplastics (items km-2 sea surface) for individual sample sites (SMR and OMR) for the years 2013/14 – 2019/20.
Due to the variable temporal and geographic extents (Table 1) it is not possible to do any meaningful trend assessments for the SMRs or OMRs.
Three hundred and seventy two (372) sites were sampled in SMRs and 26 in OMRs from 2013/14-2019/20. Average concentrations (average items km-2 sea surface per year) are shown in Figure c. Average concentrations ranged from zero to 27,075 microplastics per km2 sea surface. For individual sites the highest concentration was in the Solway in 2015/16 season (70,098 microplastics per km2 sea surface). More than half the sites sampled had a total microplastics burden < 1,000 microplastics per km2 sea surface, with almost a third (138) having no microplastics at all. The variable temporal and geographic extents (Figure c) meant it was not possible to do any meaningful trend assessments for the SMRs or OMRs.

Figure c: Average microplastic concentration of sites sampled within each SMR/OMR per year (microplastics per km2 sea surface).
There are many studies on microplastics in seawater but comparisons are made here to studies where sampling was carried out using a manta net or neuston/plankton net (Table a) and the data were reported as microplastics per km2 of the sea surface. Samples from this study with concentrations greater than 70,000 microplastics per km-2 of sea surface are comparable with those from the North Pacific and North Atlantic Gyres (Table a). These 5 samples were from the Solway SMR, the Forth and Tay SMR and from the head of Loch Long, near Arrochar, which is part of the Clyde SMR (Figure d).


Figure d: Microplastic concentrations (items km-2 sea surface) for the Clyde, Solway and the Forth and Tay SMRs (2013/14-2019/20).
The rest of the samples had microplastic concentrations much lower than those of the North Pacific and North Atlantic Gyres and were comparable with the concentrations measured by Santillo et al. (2018) in Scottish waters.
| Location | Microplastics/km-2 | Reference |
|---|---|---|
| Firth of Forth | Up to 8,200 | Santillo et al., 2018 |
| Tiree | Up to 4,500 | Santillo et al., 2018 |
| Off Lewis | Up to 12,600 | Santillo et al., 2018 |
| North Pacific Gyre | 85,000 | Carson, Colbert, Kaylor, & McDermid, 2013 |
| North Pacific Gyre | 335, 000 | Moore, Moore, Leecaster, & Weisberg, 2001 |
| North Atlantic Gyre | 28,000 | Law et al., 2010 |
Once collected the microplastics were sorted into nurdles, beads, fibres, polystyrene, fragments, film and paint flakes (Figure e).
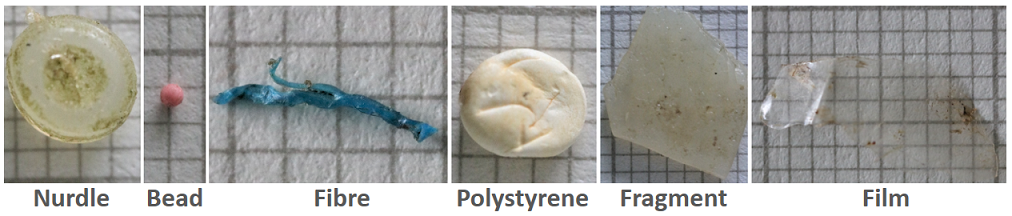
Figure e: Examples of the categories of microplastics in this study (except for paint flakes). Background squares are 1 mm on each side.
Fragments are the dominant category (Figure f), giving rise to the possible conclusion that much of the microplastics in Scotland’s seas may result from the fragmentation of larger items. There are limitations with sea surface sampling as particles smaller than the net mesh size (333 µm) may be significantly under sampled. Items such as small cosmetic beads (pink bead - Figure e) were likely to be under sampled due to their small size (< 200 µm).

Figure f: Microplastics by category – bars represent the total items (km-2 sea surface) for 2013/14-2019/20, summed for all eleven SMRs for each category.
In the assessment for the 2011 Marine Atlas (Baxter et al., 2011) only beach litter was assessed with only a brief mention regarding the possible toxicity of plastic microparticles, therefore no comparisons can be made to the data presented here.
Conclusion
Microplastics are present in the surface waters of all Scottish Marine Regions though not all sample sites within the SMRs contained microplastics. Fragments are the most abundant category of microplastics, indicating that much of the microplastics in Scotland’s seas are from the fragmentation of larger items.
The Clyde, Forth and Tay and Solway SMRs are the most contaminated. The Argyll SMR also has elevated concentrations of microplastics compared to SMRs on the north and east coasts. The Clyde and Forth and Tay SMRs are next to the most urbanised and industrialised areas of Scotland whilst the Solway SMR is north of heavily industrialised and urbanised areas of England. For the Argyll SMR the higher concentrations may be explained by transport of microplastics on the coastal current from the more contaminated areas to the south or inputs from the Atlantic Ocean to the west.
Due to the variable geographic and temporal extents of the data currently available it is not possible to carry out a trend assessment.
Factors such as wind and sea state affect the efficiency of sampling by neuston net. Additionally some microplastic categories and sizes may be under represented in the samples. Therefore confidence in the physical counting of particles to give concentrations per km2 of seawater is high, the actual counts may be an underestimate, particularly e.g. for the small pink beads, which are smaller than the net mesh aperture.
Knowledge gaps
Insufficient spatial and annual coverage due to limited sampling. To make the most effective use of the Marine Scotland ship time available, the microplastics sampling uses the same survey vessel time as for other monitoring. This means that sampling for microplastics has to integrate into other sampling priorities. A baseline does not yet exist for microplastics so a trend analysis is not possible.
Status and trend assessment
|
Region assessed
|
Status with confidence
|
Trend with confidence
|
Comments
|
|---|---|---|---|
|
Argyll
|
 |
|
Due to the variable temporal and geographic extents it is not possible to do any meaningful status or trend assessment.
|
|
Clyde
|
|
|
Due to the variable temporal and geographic extents it is not possible to do any meaningful status or trend assessment.
|
|
Forth and Tay
|
|
|
Due to the variable temporal and geographic extents it is not possible to do any meaningful status or trend assessment.
|
|
Moray Firth
|
|
|
No assessment criteria as yet therefore status or trend assessment not possible.
|
|
North Coast
|
|
|
No assessment criteria as yet therefore status or trend assessment not possible.
|
|
North East
|
|
|
No assessment criteria as yet therefore status or trend assessment not possible.
|
|
Orkney Islands
|
|
|
No assessment criteria as yet therefore status or trend assessment not possible.
|
|
Outer Hebrides
|
|
|
No assessment criteria as yet therefore status or trend assessment not possible.
|
|
Shetland Isles
|
|
|
No assessment criteria as yet therefore status or trend assessment not possible.
|
|
Solway
|
|
|
No assessment criteria as yet therefore status or trend assessment not possible.
|
|
Western Islands
|
|
|
No assessment criteria as yet therefore status or trend assessment not possible.
|
This Legend block contains the key for the status and trend assessment, the confidence assessment and the assessment regions (SMRs and OMRs or other regions used). More information on the various regions used in SMA2020 is available on the Assessment processes and methods page.
Status and trend assessment
|
Status assessment
(for Clean and safe, Healthy and biologically diverse assessments)
|
Trend assessment
(for Clean and safe, Healthy and biologically diverse and Productive assessments)
|
||
|---|---|---|---|
 |
Many concerns |
No / little change |
|
 |
Some concerns |
Increasing |
|
 |
Few or no concerns |
Decreasing |
|
 |
Few or no concerns, but some local concerns |
No trend discernible |
|
 |
Few or no concerns, but many local concerns |
All trends | |
 |
Some concerns, but many local concerns |
||
| |
Lack of evidence / robust assessment criteria |
||
| Lack of regional evidence / robust assessment criteria, but no or few concerns for some local areas | |||
 |
Lack of regional evidence / robust assessment criteria, but some concerns for some local areas | ||
| Lack of regional evidence / robust assessment criteria, but many concerns for some local areas | |||
Confidence assessment
|
Symbol |
Confidence rating |
|---|---|
|
Low |
|
|
Medium |
|
|
High |

Assessment regions
 and the Scottish Offshore Marine Regions (OMRs, O1 – O10)")
Key: S1, Forth and Tay; S2, North East; S3, Moray Firth; S4 Orkney Islands, S5, Shetland Isles; S6, North Coast; S7, West Highlands; S8, Outer Hebrides; S9, Argyll; S10, Clyde; S11, Solway; O1, Long Forties, O2, Fladen and Moray Firth Offshore; O3, East Shetland Shelf; O4, North and West Shetland Shelf; O5, Faroe-Shetland Channel; O6, North Scotland Shelf; O7, Hebrides Shelf; O8, Bailey; O9, Rockall; O10, Hatton.
 Regions. These have been used as the assessment areas for hazardous substances.")
, Regions.")