
Background
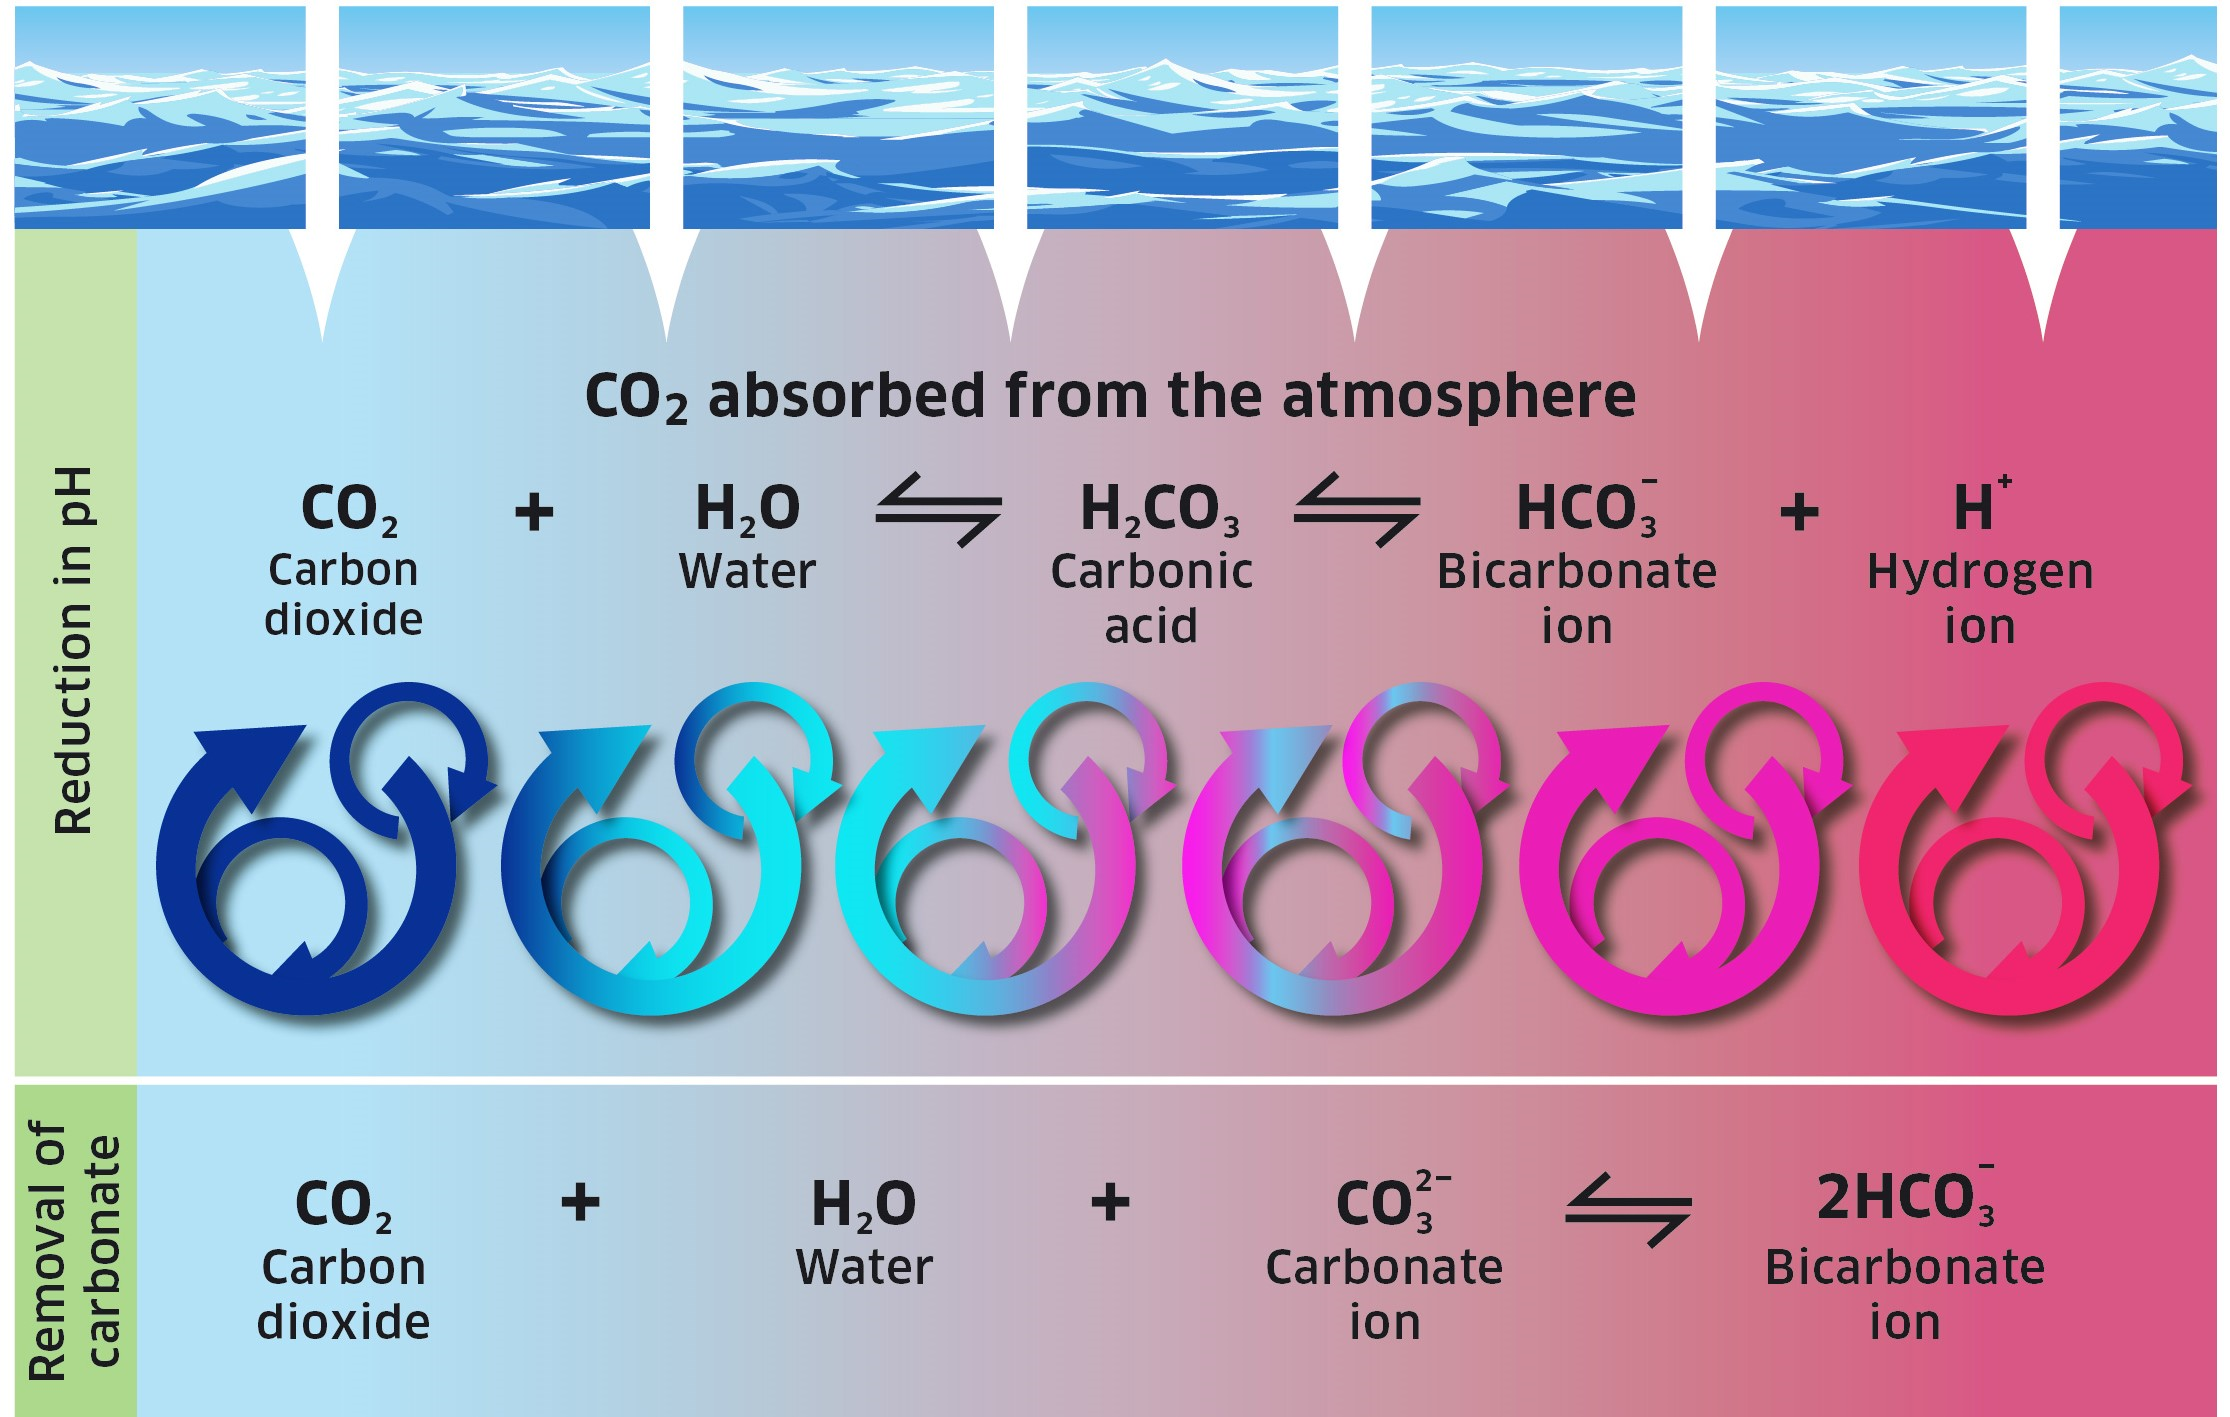
Ocean acidification (OA) is the decrease in the pH of the ocean caused by an uptake of carbon dioxide () from the atmosphere which has been produced by human activities (anthropogenic). When carbon dioxide dissolves in seawater a chemical reaction occurs and hydrogen ions are released resulting in a decrease in the waters pH. Associated with this change are increased concentrations of bicarbonate ions () and decreased concentrations of carbonate ions (), which control the saturation state of calcium carbonate () (Figure 1).
Calcium carbonate minerals such as calcite and aragonite are used by many marine organisms for production of their shells. Sabine et al., (2004) reported that a third of the anthropogenic carbon dioxide produced since pre-industrial times has been absorbed by the ocean, resulting in a decrease in pH of approximately 0.1 units. The pH is a logarithmic scale and this equates to an increase in acidity of approximately 30%. Although the input of carbon dioxide from the atmosphere has only small spatial variation, some marine regions will be more rapidly affected, with the susceptibility of seawater to change dependent on the chemical composition, depth and temperature (Hoegh-Guldberg et al., 2018).
The effects of the decrease in seawater pH and changes to the saturation states of calcium carbonates may be corrosive to the shells, skeletons and impact larval stages of some marine organisms. Calcifying organisms such as pelagic gastropods, bivalves and corals may be particularly affected (Figure 2).
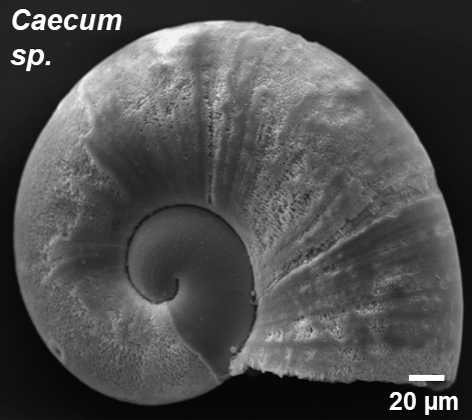
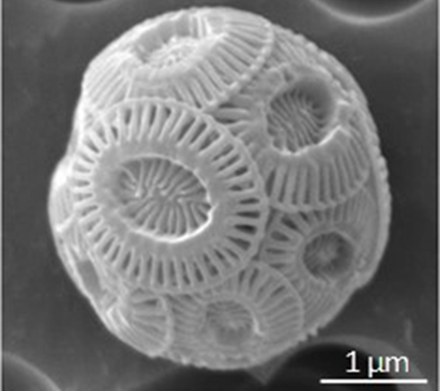
Figure 2: Scanning electron microscope images of a pelagic gastropod larva (left picture) and Emiliania huxleyi, the dominant coccolithophore at the SCObs monitoring site at Stonehaven (right picture).
Changes to the ocean as a consequence of increasing atmospheric CO2 and other greenhouse gases are impacting marine systems, resulting in both physical (such as increasing water temperatures) and chemical (such as decreasing pH) changes. Ocean acidification is a chemical change caused primarily by the uptake of anthropogenic atmospheric CO2 by the ocean, which results in an alteration in the chemistry of the seawater (Figure 1).
Sabine et al., (2004) reported that a third of the anthropogenic CO2 (from activities such as fossil fuel burning and cement production) produced over the past 200 years has been absorbed by the ocean, resulting in a decrease in pH of 0.1 units. The Intergovernmental Panel on Climate Change (IPCC) predicts the greenhouse gas concentration projected trajectory based on a set of scenarios known as the Representative Concentration Pathways (RCP). Under one of the scenarios (RCP4.5), where emissions are predicted to peak around 2040 and then decline, predicted pH will have decreased by 0.2 units compared to the pre-industrial period by 2100 (Hoegh-Guldberg et al., 2018).
The effects of the decrease in seawater pH and changes to the saturation states of calcium carbonates, such as aragonite and calcite, may affect marine organisms from bacteria and algae through to fish with risks to growth, reproduction, feeding rate, calcification, survival and abundance being identified (Hoegh-Guldberg et al., 2018). However, the impacts on marine taxa to changes in CO2, pH and carbonate concentrations are not uniform and some species may be able to adapt (Gattuso et al., 2015). Data also show that ocean acidification does not occur uniformly and is marine region specific, due to water chemistry change being dependent on the chemical composition, depth and temperature of the water (Hoegh-Guldberg et al., 2018).
Spatial, seasonal and annual variations have been reported, with variability naturally highest in shelf seas and coastal regions (Hartman et al,. 2018). It is therefore important to distinguish natural variability from changes as a consequence of anthropogenic inputs by undertaking high frequency, year round, long-term monitoring.
Calcifying planktonic organisms may be particularly sensitive to the effects of ocean acidification with any impact on plankton having the potential to subsequently impact higher trophic levels through disruption of food webs. Cold-water corals found in deep waters, such as the Darwin Mounds to the north-east of Rockall, may also be particularly sensitive to decreases in pH and concentration of carbonate ions. These coral colonies serve as shelter, feeding and breeding habitats for a wide range of species including commercial fish.
Ocean acidification may also have socio-economic implications for the Scottish economy. The fisheries industry is an important component of the economy and under predicted increasing CO2 concentrations commercially important marine species may be impacted. A species’ ability to adapt, as a consequence of changing chemical and physical conditions, could potentially affect food webs and commercial fisheries. For example Atlantic cod larvae from two different populations (Barents Sea and Western Baltic Sea) have both showed increased mortality rates under elevated CO2 concentrations. When these results were included in recruitment models, the recruitment collapsed (Stiasny et al., 2016).
The corrosive conditions associated with the increase of CO2 are likely to have a major impact on bivalve larvae of commercially important species (Wijsman et al., 2019), resulting in less recruitment (Parker et al., 2013). This may imply a significant risk for bivalve communities as well as for hatchery production in aquaculture (Barton et al., 2012, 2015). A study by Fernándes et al. (2016) projected a 10-60% loss of revenue as a result of increasing sea temperatures and ocean acidification on UK waters. The Marine Climate Change Impacts Partnership (MCCIP) 2013 science review (Williamson et al., 2013) also estimated that ocean acidification (assuming a doubling of atmospheric CO2 and a 10-25% reduction in growth and calcification) would result in a 10-25% loss in shellfish landings by 2080 for the UK economy.
Coastal areas are also an important part of the leisure and recreation industry supporting employment and small businesses for activities such as diving, kayaking, sea angling, and marine mammal observations. Any change in coastal marine biodiversity as a result of ocean acidification may impact potential revenue. The effects of ocean acidification may, therefore, impact those involved in the fisheries and aquaculture industries, retailers, consumers and coastal communities.
Monitoring and assessment background
Monitoring in respect to OA is currently voluntary under the OSPAR Coordinated Environmental Monitoring Programme (CEMP) due to the lack of available reference materials and external intercalibration or proficiency testing schemes. There are currently no assessment criteria in place by either HELCOLM (responsible for protecting the marine environment of the Baltic) or OSPAR (responsible for protecting the marine environment of the North East Atlantic) for OA. The joint OSPAR/ICES Ocean Acidification Study Group (SGOA) noted that the existing concept of OSPAR assessment criteria is not readily transferrable to ocean acidification due to the long-term and global nature of the issue (ICES, 2014). Therefore, a status assessment is not possible currently.
SGOA considered following the Global Ocean Acidification – Observing Network (GOA-ON) proposed nested approach to monitoring, where the monitoring programme is designed to cover a range of regions from ocean to coastal and estuarine waters (Newton et al., 2015). The nested approach has two goals, improve understanding of global ocean acidification conditions (Goal 1) and improve understanding of ecosystem response to OA (Goal 2). Monitoring variables are grouped as level 1 (core set of measurements, carbonate chemistry parameters, nutrients, temperature, salinity, dissolved oxygen) and level 2 (extended suite of measurements, such as chlorophyll, phytoplankton species, turbidity, currents). Marine Scotland Science (MSS) carbonate chemistry monitoring has been designed to meet Goal 1, level 1 requirements. SGOA concluded that the primary focus should be on temporal trend assessments (ICES, 2014). To determine trends in pH, consistent long-term measurements on a multi-decadal scale are required, Fay & McKinkley (2013) suggested at least 25 years would be required for any assessment.
Carbonate chemistry
There are four parameters of the marine carbonate system which can be measured directly; total alkalinity (TA), pH, partial pressure of CO2 in solution (pCO2) and total dissolved inorganic carbon (DIC). Measurements of any two components allow the concentration of the other components of the system to be calculated. MSS directly measures TA and DIC with the pH, pCO2 and calcium carbonate saturation states (aragonite and calcite; Omega [Ωarg] and [Ωca]) being derived using the program CO2SYS (version 2.1; Pierrot et al., 2006).
Water samples have been collected on a weekly basis, weather permitting, at Stonehaven since November 2008 by MSS, with gaps in the monitoring during 2011 (when initial funding ended) and 2014 - 2017 (sample bottle storage issues). Samples collected between 2009 and 2013 were analysed by the National Oceanography Centre (NOC, Southampton) following the procedures of OSPAR JAMP Agreement 2014 - 03 (OSPAR, 2014) & Guide to Best Practices for Ocean CO2 Measurements (Dickson et al., 2007). Remaining water samples (2018 - present) await analysis.
Quality control
Repeat measurements on previously analysed samples were undertaken before sample analysis each day (n>3). Instrument precision was better than ± 1.5 μM/kg for DIC and TA. The standard deviation for DIC and TA was calculated for each day of analysis.
Instrument calibration and monitoring analytical performance
Reference Materials (RM) from Dr Andrew Dickson (Scripps Institution of Oceanography) were used for calibration to assure the accuracy of the measurements. RMs were analysed at the beginning, middle and end of the sessions. The result of the first RM analysis was used in the final calculation to avoid bias in DIC due to gas exchange providing a correction factor (k) for each analysis session (k= RM measured/ RM certificate).
Geographical scale
There is a single sustained monitoring site within Scottish waters situated within the East Coast Scottish Marine Region (SMR) at Stonehaven with other data coming through short term research projects funded by Defra and NERC.
The MSS carbonate chemistry dataset consists of 5 years of measurements, which is insufficient to calculate an accurate trend in the overall pH, but has been used in this assessment to understand the seasonality and inter-annual variability.
Monitoring ecosystem response
SGOA also considered GOA-ON Goal 2; Monitoring Ecosystem Response, but were unable to recommend indicator species for such assessments (ICES, 2014). There are currently no guidelines for sample collection or analysis of potential indicator species. MSS have investigated baseline diversity and morphology of two calcifying plankton groups at the Stonehaven variability of two potential indicator groups at the Stonehaven monitoring site, namely coccolithophores and gastropods, including pteropods (planktonic sea snails) and pelagic larvae of benthic species.
Results
There are very few monitoring data for carbonate chemistry parameters in Scottish waters. Sustained monitoring is limited to a single site within the North-east SMR at Stonehaven (Figure 3). Remaining data are from short term research projects with limited repeatability.
Water samples have been collected weekly, where possible, from the Stonehaven Scottish Coastal Observatory site (SCObs) (Bresnan et al., 2016), from both surface (1 m) and bottom (45 m) waters since November 2008 for carbonate chemistry analysis, with data reported in this assessment covering the period November 2008 – December 2013, with gaps in the monitoring during 2011 and 2014 - 2017 (details provided in assessment method section) (Figure 4). Water samples collected from 2018 to present await analysis (see knowledge gaps section).
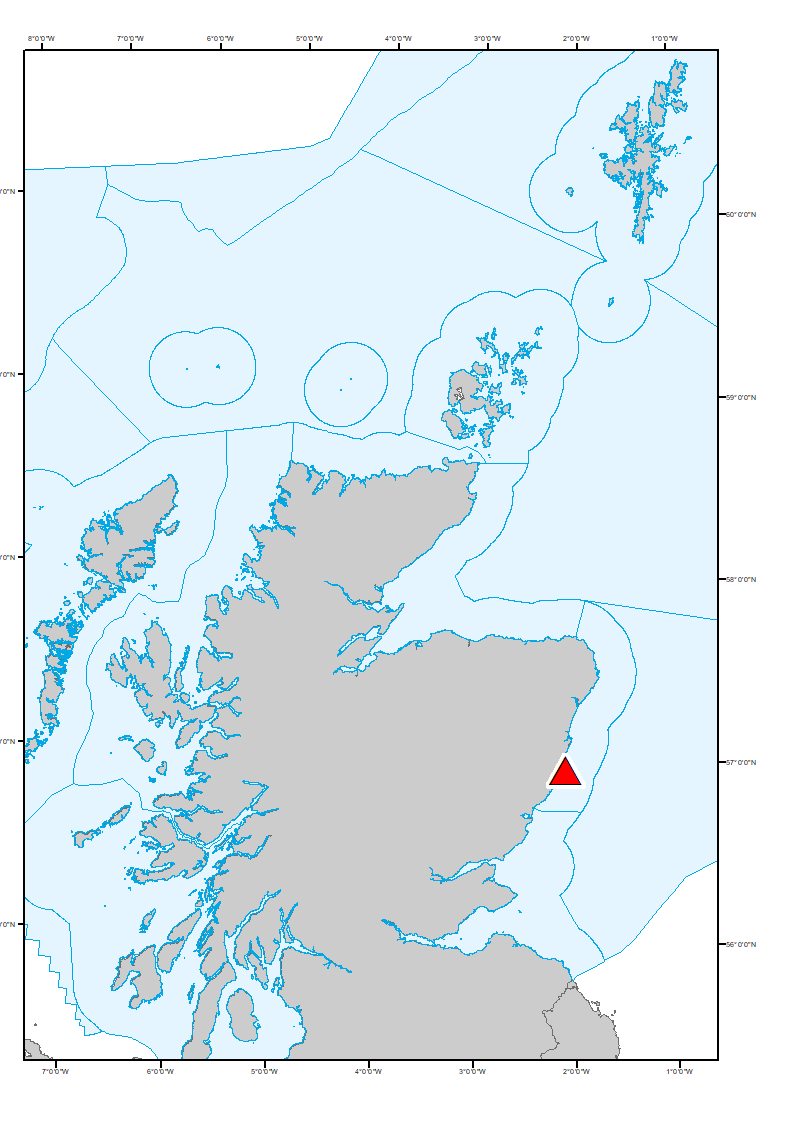
Figure 3: Ocean acidification Scottish Coastal Observatory (SCObs) sampling Stonehaven site location (red triangle). Blue lines around Scotland indicated the Scottish Marine Regions (SMRs, coastal) and Offshore Marine Regions (OMRs).
The calculated pH (Total Scale) at the site varied from 8.2 to 7.8. Variability was greatest in spring/summer due to biological uptake of carbon dioxide by phytoplankton before returning to less variable levels in winter with a calculated pH (Total Scale) of ~ 8.05. The pH at Stonehaven varies inter-annually, due to a number of factors such as sporadic freshwater inputs. This is particularly the case in 2013 when the calculated pH at the site showed lower values.
The saturation state calculated from the carbonate chemistry parameters was greater than 1 in all samples, indicating that seawater at Stonehaven was supersaturated with respect to carbonate. Therefore carbonate concentration is not a limiting factor for the formation of shells of marine organisms throughout the year. However, shell dissolution was detected in pelagic gastropods, mainly in early life stages, associated with decreases of aragonite during winter months.
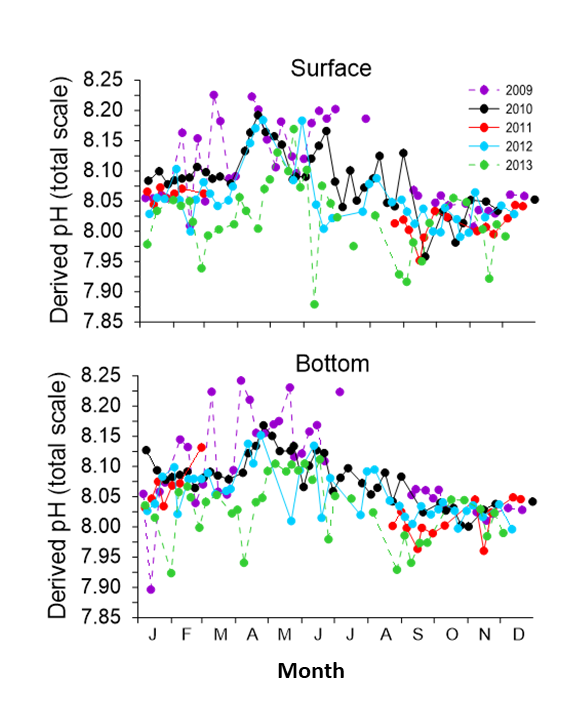
Figure 4: Plot of calculated pH (total scale) at the Stonehaven monitoring site. The letters on the X-axis refer to the first letter of the month beginning with January.
Water samples for carbonate chemistry analysis have been collected weekly, where possible, from the Scottish Coastal Observatory (SCObs) monitoring site at Stonehaven (Bresnan et al., 2016 ), from both surface (1 m) and bottom (45 m) waters since November 2008. Between November 2008 and February 2011 samples were collected as part of short term, Defra funded research projects with monitoring from September 2011 funded by MSS. There are gaps in the dataset during the period between Defra and MSS funding in 2011 and loss of collected water samples 2014-2017 due to sample storage issues. Carbonate chemistry data (measured TA and DIC, calculated pCO2 and pH, and aragonite and calcite saturation) have been assessed at this site for the period November 2008 - December 2013. Water samples collected in more recent years await analysis (see knowledge gaps section).
To determine trends in pH, consistent long-term measurements on a multi-decadal scale are required. The Stonehaven dataset reported in this assessment consists of 5 years of measurements (Figure 4), which is not long enough to robustly calculate accurate trends in the overall pH but can be used to begin to understand the seasonality and inter-annual variability.
The carbonate system at Stonehaven follows a strong seasonal cycle particularly in surface waters. DIC concentrations ranged from 2,002 – 2,134 μmol/kg (mean 2,092 μmol/kg, n = 375), being lowest during the spring and summer months (March-September) due to increased biological uptake of CO2 by phytoplankton. This results in a corresponding increase in the pH at the site. TA concentrations ranged from 2,170 – 2,309 μmol/kg (mean of 2,275 μmol/kg, n = 134) increasing from February through to May (Figure a). Walsham et al. (2014) reported TA & DIC concentrations at Stonehaven were similar to those of samples collected at another UK coastal site at Liverpool Bay.
The calculated pH (Total Scale, using CO2SYS version 2.1) at the site varied from 7.8 to 8.2 (Figure 4). The greatest variability in calculated pH occurred during the spring/summer months due to biological uptake of carbon dioxide by phytoplankton before returning to lower values in winter with an average calculated pH (Total Scale) of ~ 8.05 (Figure 4).
Humphreys (2017) reported that seawater temperature is also an important control on pH, with summer warming resulting in a potential loss of DIC and increase in pH, due to warmer waters holding less dissolved gas. Highest seawater temperatures, at the site, are recorded during August/September. However, the pH at this time is near winter values indicating summer warming is not leading to increased pH as a consequence of DIC loss through degassing. The aragonite and calcite saturation state (Ωarg) showed a similar seasonality. Saturation states were generally higher in late spring-summer months (up to 2.7 in May 2012), decreasing during autumn until minimising over winter. The Ωarg was >1 in all samples, indicating that seawater at Stonehaven was supersaturated with respect to calcium carbonate and therefore carbonate concentration is not a limiting factor for the formation of marine organism shells. Both pH and Ωarg followed similar patterns at surface and bottom sampling depths.
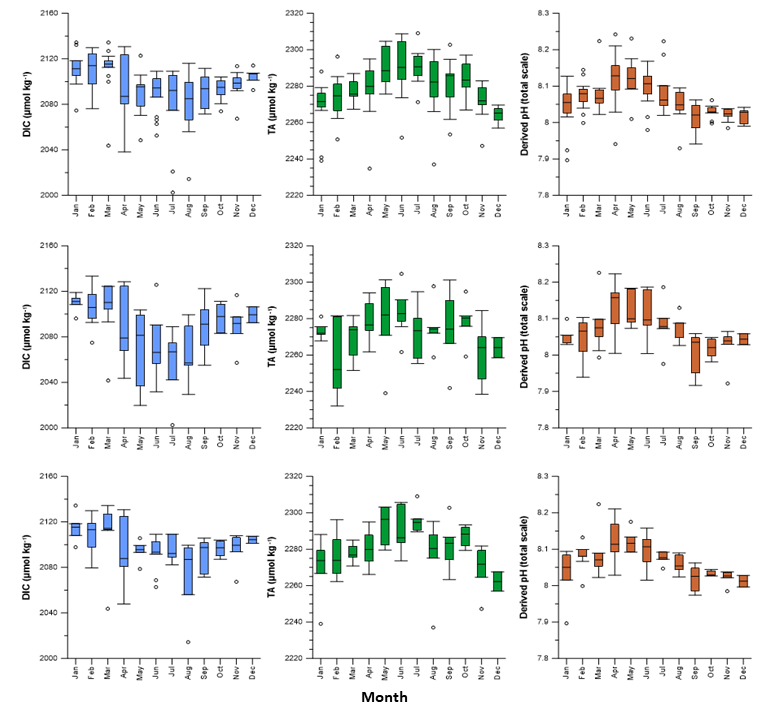
Figure a: Monthly average distribution of Dissolved Inorganic Carbon (DIC), Total Alkalinity (TA) and calculated pH (total scale, using CO2SYS version 2.1) at Stonehaven for the period 2009-2013: overall monthly average distribution combining the two datasets from both depths datasets (upper panel), 1 m (middle panel) and 45 m depth (bottom panel).
The seasonality observed at the Stonehaven site is consistent with observations from the Shelf Sea Biogeochemistry strategic research programme reported by Hartman et al. (2018) which considered data based on nine Marine Strategy Framework Directive (MSFD) Ecohydrodynamic regions around the Northwest European shelf. The largest seasonal change in DIC was observed in the Northern North Sea, where along with the Minches (Scottish Marine Region West Highlands) the lowest DIC concentrations were observed during spring and summer. Hartman et al. (2018) also noted a large TA concentration range in the Northern North Sea with the seasonal mean increasing from 2,275 µmol kg-1 (spring) to 2,310 µmol kg-1 (winter). Hartman et al. (2018) calculated pH in spring to be around 8.18 in both the Northern North Sea and the Minches which is similar to the pH observed at Stonehaven during this period. The variability in seasonality has also been observed at other fixed-point observatories around the UK (UK Marine Online Assessment Tool, 2019).
Although it was not possible to assess annual trends in the Stonehaven dataset, an estimated decrease in pH in the Northern North Sea of -0.0035 ± 0.0014 pH units per year during the period 1984 - 2014 has recently been reported by the UK (UK Marine Online Assessment Tool, 2019).
Monitoring ecosystem response
SGOA were unable to recommend a single indicator species for monitoring ecosystem response to OA, but reviewed a number of potential organisms (ICES, 2014). MSS have investigated two calcifying plankton groups at the Stonehaven site, namely coccolithophores and pelagic gastropods, with the aim of understanding natural seasonal variability and potential impacts of OA, these are described in case study: Coccolithophores at Stonehaven and case study: Shell integrity of pelagic gastropods at Stonehaven.
Cold-water corals found in deep waters, such as the Darwin Mounds to the north-east of Rockall and the Mingulay reef complex in the Sea of the Hebrides may be particularly sensitive to decreases in pH and carbonate ions (). These coral colonies serve as shelter, feeding and breeding habitats for fish. The Mingulay reef complex is subject to carbonate chemistry diurnal variability, as described in case study: Cold-water corals and highlights the need to understand natural processes.
Conclusion
The data show a strong seasonal carbonate chemistry cycle at the Stonehaven site with variability in the calculated pH being greatest during spring and summer, the period when uptake of carbon dioxide by phytoplankton is greatest.
The Stonehaven hydrography is characterized by a coastal southward flow, with sporadic inputs of freshwater and offshore Atlantic waters influencing the site. The pH varies inter-annually, particularly in surface waters, and this may be linked to a number of factors, such as runoff and hydrography.
The saturation state, of both aragonite and calcite, calculated from the carbonate chemistry parameters, was > 1 in all water samples, indicating that seawater at Stonehaven was supersaturated with respect to calcium carbonate, although shell dissolution of pelagic gastropods was observed mostly during the winter months.
The carbonate chemistry variability observed at the single sustained monitoring site and relation to phytoplankton dynamics highlights the need for consistent, multi-parameter, long-term monitoring to differentiate natural variability from that driven by an anthropogenic input in dynamic coastal waters.
Knowledge gaps
There are very few sustained carbonate chemistry monitoring data from Scottish waters, and those that are available have been collected over a very short timescale, < 20 years. To differentiate natural seasonal and inter-annual variation from anthropogenic driven impacts, data would be required over a multi-decadal timescale, it has been suggested 25 years of data are required (Fay & McKinkley, 2013).
There are currently no assessment criteria in place for the status assessment of carbonate chemistry parameters and no indicator or potential indicator species groups recommended for monitoring ecosystem response to OA. These will require development for future assessments.
A sub-group of the Department for Environment, Food and Rural Affairs (Defra) Science Advisory Council (SAC) recently reviewed UK national monitoring and assessment programmes for OA (Defra, 2018). The group highlighted the challenges associated with measurement of components of the marine carbonate system at an accuracy and precision to determine pH changes. They also highlighted that measurements require the use of non-standard specialist equipment run by skilled analysts. There are only a few laboratories within the UK with the capacity to undertake such analysis.
During the UK Ocean Acidification (UKOA) research programme (UKOA, 2016) a central facility for analysis was setup at the National Oceanography Centre (NOC) Southampton. Once UKOA ended NOC have been unable to facilitate operation on a commercial basis. MSS water samples were analysed at this facility until 2014. NOC are not currently in the position to undertake analysis of MSS samples collected in subsequent years. MSS have purchased the specialist equipment required for analysis and are trying to validate methods such that stored water samples from Stonehaven can be analysed. One of the recommendations of the Defra-SAC (Defra, 2018) was to address the issue of chemical OA monitoring capacity by developing nationally funded facility/facilities as centres of excellence.
The use of sensors to measure pH and pCO2 could increase spatial coverage but require calibration with discrete water samples and are still relatively new techniques for OA monitoring. Sensor capacity in Scotland is being developed currently as part of the INTERREG COMPASS (Collaborative Oceanography and Monitoring for Protected Areas and Species) project, with pCO2 sensors being deployed in Loch Ewe by MSS and Loch Creran by SAMS (The Scottish Association for Marine Science).
Sustained monitoring in Scottish waters is currently limited to a single site on the north-east of Scotland (Stonehaven). Expansion to this monitoring is required covering the waters around the north coast and Northern Isles, which are strongly influenced by Atlantic waters entering the shelf seas, and the west coast of Scotland. Monitoring on the west coast is partially being addressed as part of the INTERREG COMPASS project.
Additional datasets are required to understand local geological effects such as increased alkalinity as a consequence of a granite base rock on a system. Datasets are also required to address implications of increased rainfall, as a consequence of global warming, increasing freshwater run-off into the system and potential deoxygenation of waters as a consequence degassing as water temperatures increase.
SGOA and OSPAR, to date, have been unable to recommend a single indicator species for monitoring ecosystem response to OA (ICES, 2014). SGOA reviewed a number of potential species including coccolithophores (calcifying phytoplankton), pteropods (planktonic sea snails) and cold-water corals, which MSS and University of Edinburgh are currently researching.
Status and trend assessment
There is currently only one sustained monitoring site covering the Greater North Sea. This site has data collected over a limited time period and therefore it is not possible to undertake a traffic light assessment currently.
This Legend block contains the key for the status and trend assessment, the confidence assessment and the assessment regions (SMRs and OMRs or other regions used). More information on the various regions used in SMA2020 is available on the Assessment processes and methods page.
Status and trend assessment
|
Status assessment
(for Clean and safe, Healthy and biologically diverse assessments)
|
Trend assessment
(for Clean and safe, Healthy and biologically diverse and Productive assessments)
|
||
|---|---|---|---|
 |
Many concerns |
No / little change |
|
 |
Some concerns |
Increasing |
|
 |
Few or no concerns |
Decreasing |
|
 |
Few or no concerns, but some local concerns |
No trend discernible |
|
 |
Few or no concerns, but many local concerns |
All trends | |
 |
Some concerns, but many local concerns |
||
 |
Lack of evidence / robust assessment criteria |
||
| Lack of regional evidence / robust assessment criteria, but no or few concerns for some local areas | |||
 |
Lack of regional evidence / robust assessment criteria, but some concerns for some local areas | ||
| Lack of regional evidence / robust assessment criteria, but many concerns for some local areas | |||
Confidence assessment
|
Symbol |
Confidence rating |
|---|---|
|
Low |
|
|
Medium |
|
|
High |

Assessment regions
 and the Scottish Offshore Marine Regions (OMRs, O1 – O10)")
Key: S1, Forth and Tay; S2, North East; S3, Moray Firth; S4 Orkney Islands, S5, Shetland Isles; S6, North Coast; S7, West Highlands; S8, Outer Hebrides; S9, Argyll; S10, Clyde; S11, Solway; O1, Long Forties, O2, Fladen and Moray Firth Offshore; O3, East Shetland Shelf; O4, North and West Shetland Shelf; O5, Faroe-Shetland Channel; O6, North Scotland Shelf; O7, Hebrides Shelf; O8, Bailey; O9, Rockall; O10, Hatton.
 Regions. These have been used as the assessment areas for hazardous substances.")
, Regions.")