

Background
Accidental discharges and releases of oils and chemicals of any nature or size have the potential to cause concern, be it localised following a small incident, or if the area of impact is substantial, resulting in a regional or national response. That said, the presence of aquaculture sites or Priority Marine Features (see Case study: Priority Marine Features) can mean that even the accidental release of a small quantity of oil (Figure 1) or a chemical has the potential to result in environmental and/or economic impact.
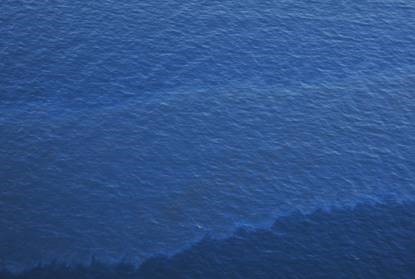
Figure 1: A sheen resulting from an accidental release or discharge of a hydrocarbon-based liquid. © Maritime and Coastguard Agency.
Action to prevent marine pollution remains a function of the United Kingdom Government with the Maritime and Coastguard Agency (MCA) being the competent UK authority that responds to pollution from shipping and offshore installations. Nevertheless, various Scottish organisations, including Marine Scotland (MS), NatureScot, Food Standards Scotland (FSS) and the Scottish Environment Protection Agency (SEPA), have roles in responding to incidents as outlined in the UK National Contingency Plan (NCP). The NCP covers all incidents in, or likely to affect, the United Kingdom Exclusive Economic Zone (EEZ) and the United Kingdom Continental Shelf (UKCS*). For waters beyond 12 nautical miles, the Joint Nature Conservation Committee (JNCC) provides the nature conservation advice.
Annual accidental discharges and releases (also referred to as incidents, but all regarded as accidental) are summarised on the basis of ‘Enumeration Area’ (Figure 2) by the Advisory Committee on Protection of the Sea (ACOPS). However, at the time of writing, the most recent publication primarily covered 2016 (ACOPS, 2017). Previous annual reports supply information covering the period 2002 - 2016. Since the preparation of this assessment during Summer 2020, ACOPS have published data covering 2017. The absence of more recent data means that the focus is on 2016 with some consideration of trends between 2002 and 2016.
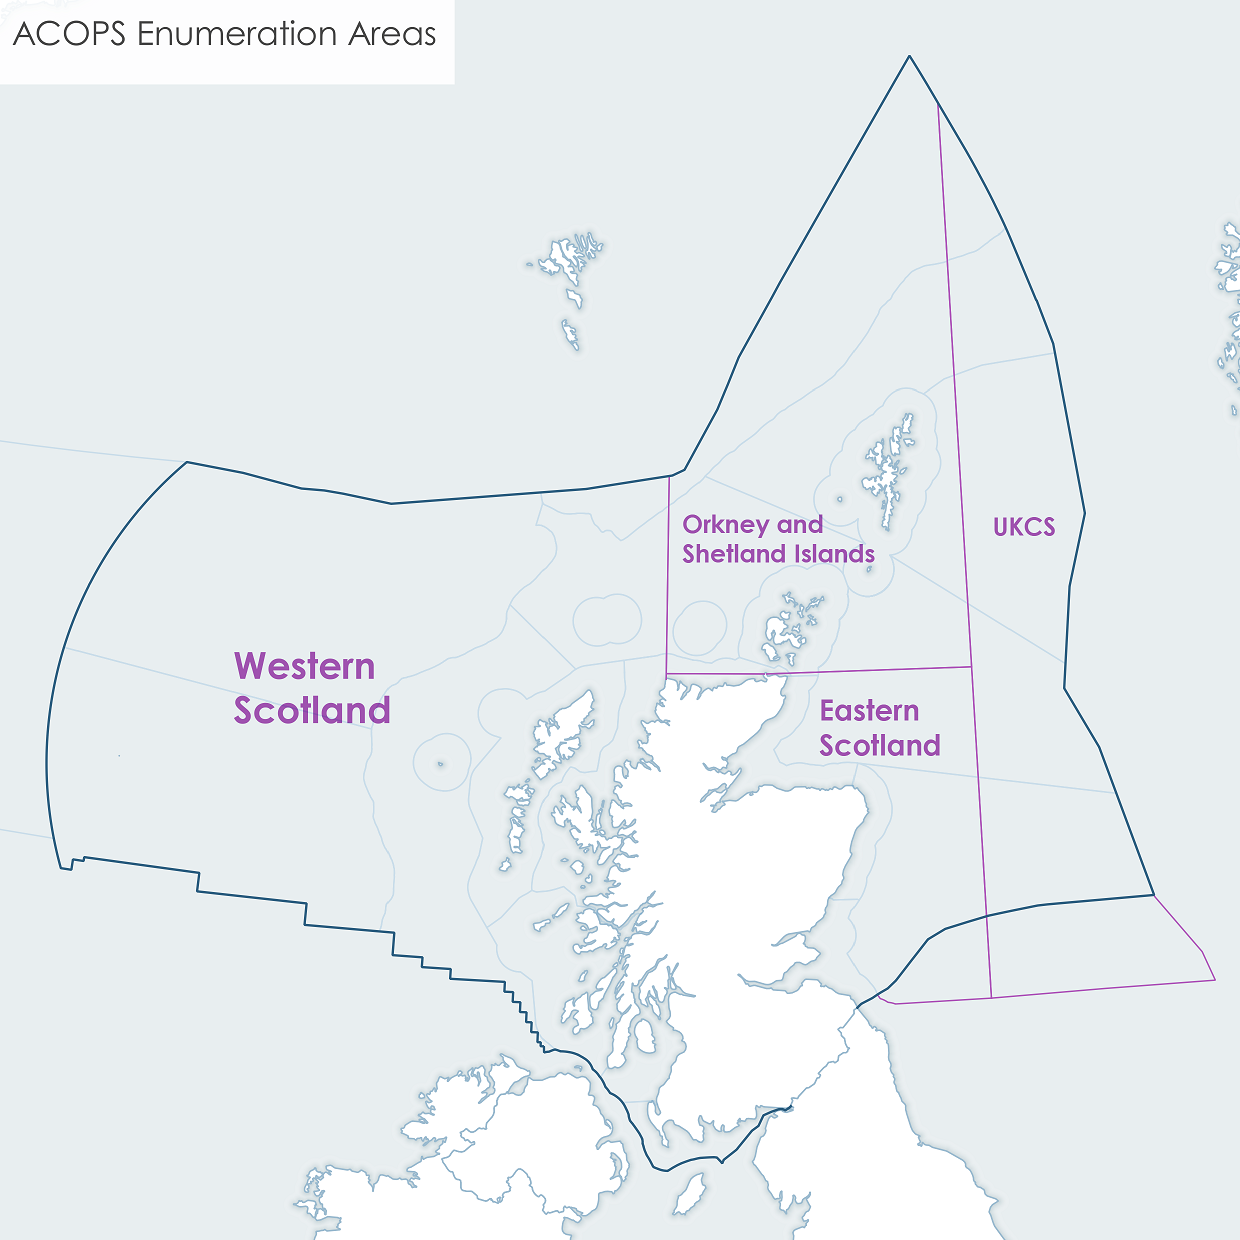
Figure 2: Enumeration Areas covering Scottish waters (dark blue line is both the extent of the EEZ and of the outer limits of the Enumeration Areas. The pink lines show the internal divisions to delineate each Enumeration Area) that are used in the assessment of oil and chemical discharges and releases. The light blue lines are the borders of the Scottish Marine Regions and Offshore Marine Regions. Note that the UKCS Enumeration Area extends beyond Scottish waters. However, the data presented are for the area as outlined. The numbers for offshore oil and gas operations presented for the UKCS Enumeration Area in this assessment include the data for the west Shetland basin. The Enumeration Areas are Western Scotland (Code: EA 8), Orkney and Shetland Islands (EA 9) Eastern Scotland (EA 10) and UK Continental Shelf (UKCS; EA 11).
*The term UKCS as used in the National Contingency Plan refers to the seabed and subsoil in the Offshore Marine Region, Hatton (see maps in Introduction, Assessment processes and methods section). This is different to the Enumeration Area called UKCS (Figure 2).
The assessment is mainly based on the most recent data published by The Advisory Committee on Protection of the Sea (ACOPS) at the time of writing (Summer 2020). This incorporates data primarily for 2016, although some historical data are included (ACOPS, 2017). Changes over time have been reviewed based on data presented in the annual reports for 2002 to 2016.
For the purpose of reporting, UK seas have been divided into 11 Enumeration Areas of which 4 cover Scottish Seas (see Figure 2, Background Section). These are Western Scotland (Enumeration Area (EA 8), Orkney and Shetland Islands (EA 9), Eastern Scotland (EA 10) and UK Continental Shelf (UKCS; EA 11). Spills are categorised into 5 types of pollution (see Appendix 2, ACOPS (2017)):
- Mineral oils
- Garbage
- Vegetable and animal oils
- Chemicals
- Other substances
The data are gathered through an annual survey of vessel/offshore sourced marine pollution. The survey questionnaire requests information on incidents involving a range of pollutants including mineral oil (MARPOL I), noxious liquid substances (MARPOL II), packaged dangerous/harmful goods (MARPOL III) and garbage (MARPOL V). MARPOL is the abbreviation for The International Convention for the Prevention of Pollution from Ships. This is the main international convention covering prevention of pollution of the marine environment by ships from operational or accidental causes. The MARPOL Convention was adopted on 2 November 1973 at the International Maritime Organisation.
The data for offshore oil and gas installations presented under Enumeration Area 11 (see Figure 2, Enumeration 11 is called the UK Continental Shelf) incorporate oil releases attributed to oil and gas installations operating in the open sea during 2016 including the West Shetland Basin, Liverpool Bay and off the coast of eastern England. The data for Liverpool Bay and off the coast of eastern England were removed for the purpose of this assessment. This differs from Scotland’s Marine Atlas 2011 (Baxter et al., 2011) where the data were reported on a UK, rather than a Scottish, basis.
For examination of changes over time, specifically in relation to the UKCS Enumeration Area, data were extracted from historical ACOPS reports. As with the 2016 figures, the data for Liverpool Bay and off the coast of eastern England were removed to give a focus on the Scottish sector.
Results
In 2016, the majority of incidents of accidental discharges and releases were from offshore oil and gas installations operating in the UKCS Enumeration Area (which includes the West Shetland Basin). There were 274 releases of mineral oils and 200 chemical releases from oil and gas installations (11a in Figure 3) and 16 mineral oil discharges from vessels in the UKCS Enumeration Area (11b in Figure 3). The UKCS Enumeration Area overlaps with a number of Scottish Offshore Marine Regions (Figure 2) including Long Forties, Fladen and Moray Firth Offshore, East Shetland Shelf, North and West Shetland Shelf and Faroe-Shetland Channel.
Minerals oils was the most common of the five pollution categories with a total of 345 discharges during 2016. Mineral oil discharges occurred in all four Enumeration Areas (Figure 2), but by far the largest number was within the UKCS. Chemicals was the second most common discharge, although it was confined to the oil and gas installations (Figure 3). Estimated volumes of discharges and releases are divided into 5 categories (Table 1).
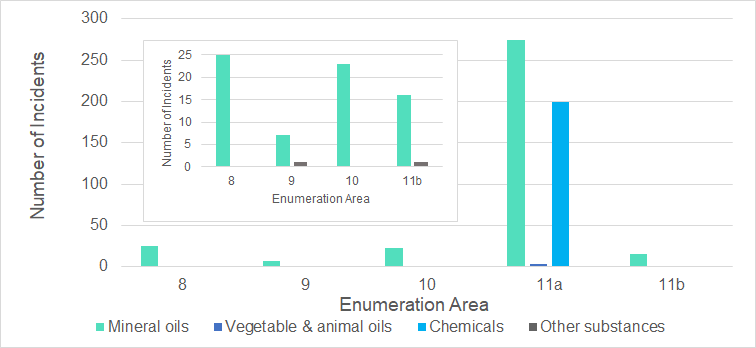
Figure 3: Number of incidents reported by category of pollution for the Enumeration Areas within Scottish waters for 2016. 8 - Western Scotland; 9 - Orkney and Shetland Islands; 10 - Eastern Scotland; 11a - UK Continental Shelf (UKCS) oil and gas installations; 11b - UKCS vessels. Inset: An equivalent plot but with 11a removed. This permits improved visualisation of the number of incidents involving ‘Other substances’.
Note that UK Continental Shelf in this case refers to Enumeration Area 11 as illustrated in Figure 1 and does not refer to the area outlined in the UK National Contingency Plan. Inset is a similar plot but with UKCS oil and gas installations removed. There were no incidents reported for the fifth category of pollution, Garbage, in 2016. By far the largest number of incidents involved either mineral oils or chemicals in the UKCS Enumeration Area, originating from oil and gas installations (including those operating in the West Shetland basin). All chemical spills in 2016 were from oil and gas installations within the UKCS Enumeration Area (ACOPS, 2017).
Of the discharges and releases that started in 2016 (total of 511 in Scottish waters, Table 1), 441 (86%) were in the volume range 1 – 455 litres. Only two, one in the Western Scotland Enumeration Area and one in the UKCS Enumeration Area were greater than 50 tonnes. The incident in Western Scotland was the grounding of the Transocean Winner near Dalmore Bay on the Isle of Lewis (Figure 4), resulting in 53 tonnes of diesel oil entering the water (Webster et al., 2016). This was later dispersed or evaporated in rough conditions.
|
Enumeration Area (Number)
|
Estimated volumes of discharges and releases
|
||||
|
1 – 455 litres
|
456 – 999 litres
|
1 – 50 tonnes
|
> 50 tonnes
|
Not known
|
|
|
Western Scotland (8)
|
13
|
-
|
-
|
1
|
11
|
|
Orkney and Shetland Islands (9)
|
4
|
-
|
-
|
-
|
4
|
|
Eastern Scotland (10)
|
15
|
1
|
-
|
-
|
7
|
|
UKCS oil and gas installations (11a)
|
409 + 17
|
20
|
47
|
1
|
-
|
|
UKCS vessels (11b)
|
14
|
2
|
1
|
-
|
-
|
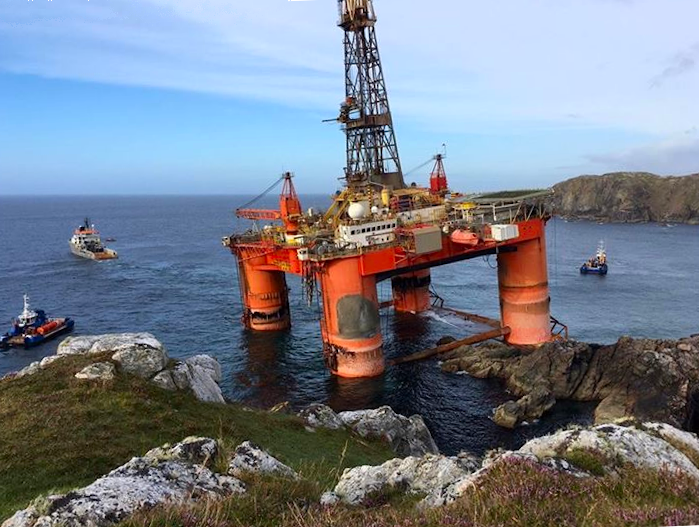
Figure 4: The Transocean Winner, grounded in Dalmore Bay, Isle of Lewis, August 2016. Two of the rigs 4 fuel tanks were damaged resulting in 53 tonnes of diesel oil entering the water which later dispersed naturally in rough conditions. © Maritime and Coastguard Agency.
Of the oil spills from vessels, 16 occurred in the UKCS, of which one was just outside Scottish waters (Figure 5). In excess of 80% of the total chemicals spilled in 2016 from oil and gas installations were considered under the OSPAR list of substances used and discharged offshore as Posing Little or No Risk to the Environment (PLONOR). None of the chemicals spilled are included in the OSPAR list of chemicals for priority action. This means that these chemicals are not likely to cause harm having been assessed for their persistency, liability to bioaccumulate and toxicity. None of the spill incidents resulted in a significant environmental impact.
Larger incidents are reported within the ACOPS report. However, although the discharge and release category is 1 – 50 tonnes, larger incidents are categorised as two tonnes or more. There were 26 larger incidents in Scottish waters in 2016, 25 of which occurred in the UKCS.
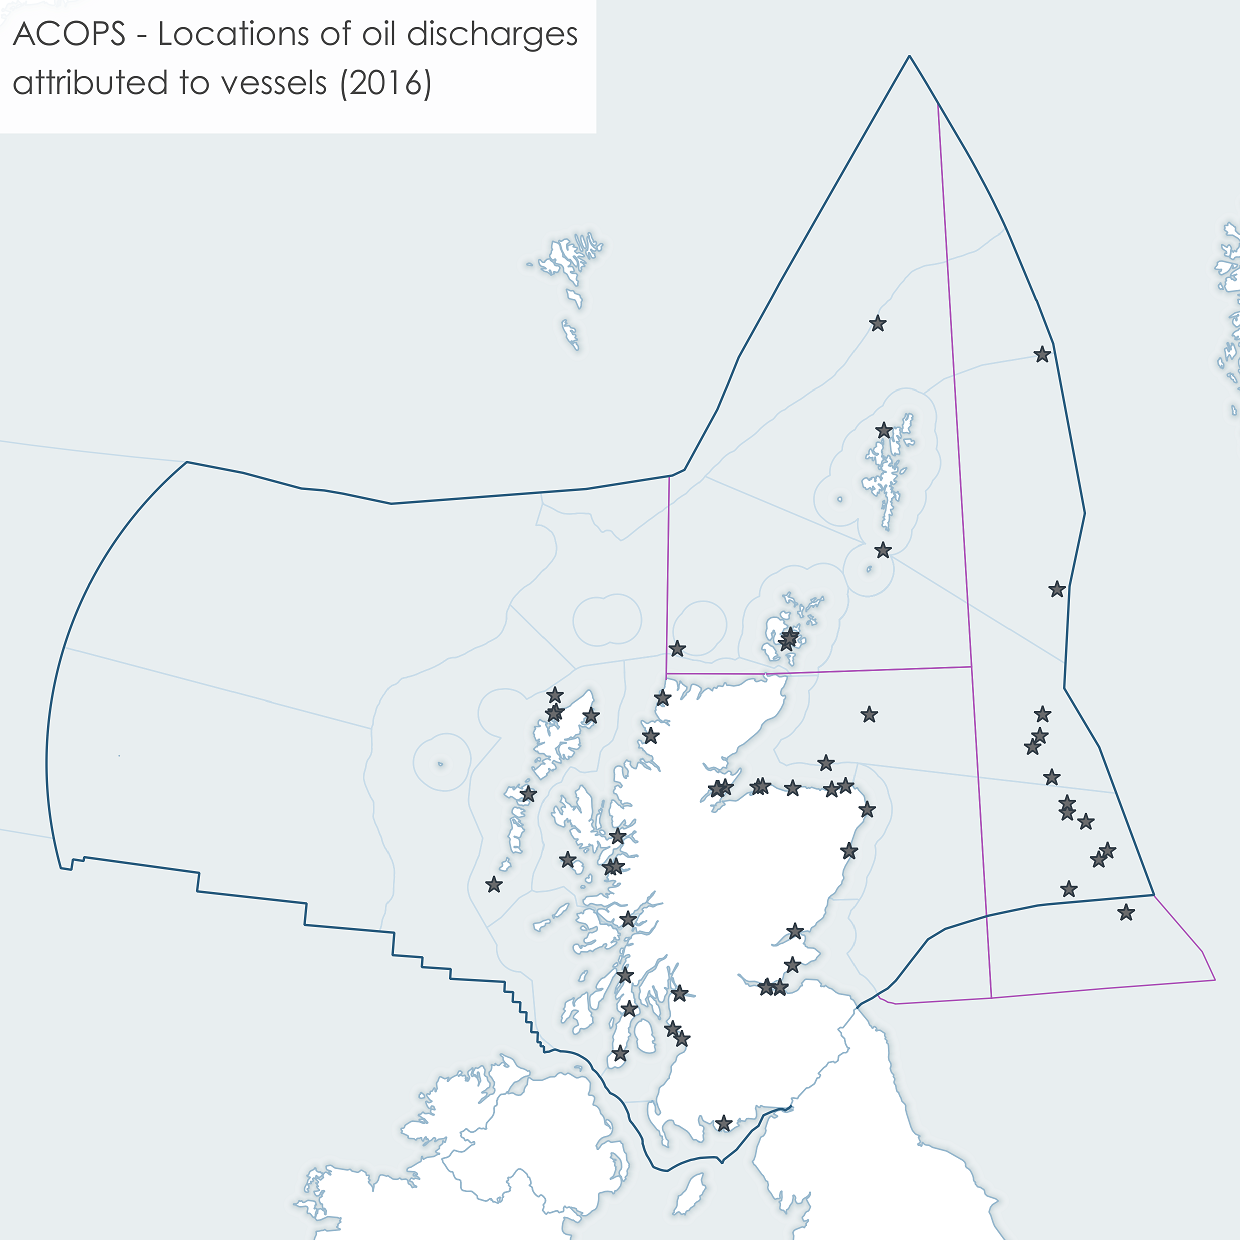
Figure 5: Locations of oil discharges attributed to vessels in docks, harbours, estuaries and at sea. The majority of the discharges within Western Scotland, Orkney and Shetland Islands and Eastern Scotland were coastal (see Figure 1 for locations of areas). Modified from ACOPS (2017).
Recording of incidents in this format began in 2002 after a review of the procedures that had been initiated in 1965. The 3 enumeration areas used in the reporting procedure that have a coastal component are not coincident with the Scottish Marine Regions (SMRs). However, discharges and releases in coastal waters can be assigned to the SMRs (Table a). Although there were discharges in ports within all but two of the SMRs during 2016, only the incident at Dalmore Beach, Isle of Lewis (Outer Hebrides, S8) was regarded as a larger incident, defined as a spill greater than 2 tonnes (Figure 4).
|
Enumeration Area
|
Scottish Marine Region
|
Discharges in estuaries and at sea
|
Shore pollution extending 1 mile or more
|
Ports
|
|
Eastern Scotland
|
S1
Forth and Tay
|
1
|
0
|
6
|
|
S2
North East
|
0
|
0
|
5
|
|
|
S3
Moray Firth
|
2
|
1
|
8
|
|
|
Orkney and Shetland Islands
|
S4
Orkney Islands
|
0
|
0
|
3
|
|
S5
Shetland Isles
|
2
|
0
|
0
|
|
|
S6
North Coast
|
1
|
0
|
0
|
|
|
Western Scotland
|
S7
West Highlands
|
1
|
0
|
8
|
|
S8
Outer Hebrides
|
5
|
0
|
2
|
|
|
S9
Argyll
|
0
|
0
|
3
|
|
|
S10
Clyde
|
0
|
0
|
5
|
|
|
S11
Solway
|
0
|
0
|
1
|

Although since 2011 there has been an increase in the annual totals for reported discharges attributed to vessels and offshore oil and gas installations (ACOPS, 2017), the data, although starting in the early 2000s, only run to 2016. This does not give sufficient data to assess trends for 2014 – 2018. Data obtained from https://www.acops.org.uk/activities/annual-marine-pollution-survey-reports/ (accessed on 27 May 2020).
Although the time series since 2011 is limited, the current format dates back to 2002. Over the period 2002 to 2016 inclusive, there has been a relatively steady increase in the release of chemicals from offshore oil and gas installations (Figure b). There were 4 spills/discharges recorded in 2002 from offshore oil and gas installations. Over the period 2011 to 2016 the annual average number of spills was 191 (range: 170 – 214). In the intervening years, the numbers increased gradually (Figure c). Taking the baseline as 2002, rather than 2011 gives a marked difference in the assessment in terms of the number of incidents. However, the quantity discharged is generally small.
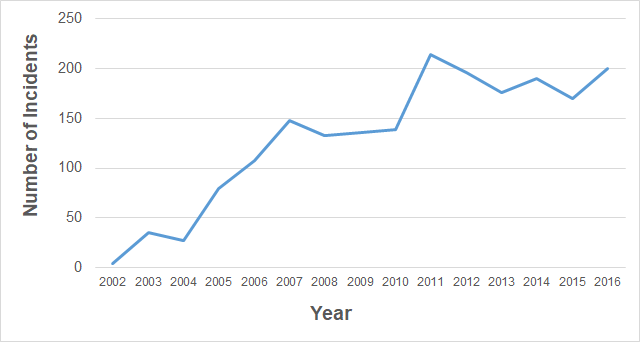
Figure b: The number of chemical incidents from offshore oil and gas installations over the period 2002 to 2016 inclusive. There is clear increasing trend up to 2011 after which the number is more consistent year on year. Data obtained from ACOPS reports (accessed 27 May 2020 – 30 June 2020).
The trend for the number of incidents for mineral oil discharges over the period 2002 to 2016 is markedly different to that for chemicals. Discharges of mineral oils from vessels in the UKCS ranges from 15 – 41 incidents. In the case of offshore oil and gas installations the trend is initially downward from 2002 (No. of incidents: 366) until 2005 (No. of incidents: 387) after which it plateaus until 2012 when there is an increase in the number of mineral oil discharges to a maximum of 327 in 2014 (Figure b). As with the chemical incidents, the quantity discharged is generally in the category 1 – 455 litres.
 or chemicals (C) in the UKCS from oil and gas installations (O&G) or vessels.")
Conclusion
Oil and chemical spills continue to occur. However, published data are only available up to, and including, 2016. This limits the assessment of current state since the incidents up to 2016 have been generally small, resulting in only localised impact. On this basis, no assessment of status (traffic light assessment) has been provided as it will be of very limited relevance to the situation in 2020. However, spills continue and the number of chemical incidents have increased during the period 2002 – 2016. Although, as already highlighted, the current situation is unknown, there must be concern around the fact that the number of chemical incidents from offshore oil and gas installations have increased. Should this direction of travel increase, action may be required as such incidents are resulting in contamination of the marine ecosystem, albeit the quantities discharged are generally small.
Knowledge gaps
The published data are only available up to, and including, 2016. More recent data, if available, would allow a more up to date assessment to be made, especially of trends.
Current reporting is based on frequency, quantity and nature of the material. For mineral oils there continues to be a lack of assessment criteria.
In 2016 there were a small (< 4%) number of discharges and releases for which the volume was not known. This needs to be monitored as this could represent a significant event.
Status and trend assessment
There are no data available beyond 2016. Given that spills and discharges tend to be small (1 – 455 litres) with the majority being associated with the offshore oil and gas industry and spread across Enumeration Area 11. Although the number of chemical spills increased up to 2011, the number was more consistent in the period 2011 to 2016. Based on these limitations, it was concluded that it was not appropriate to undertake a status and trend assessment.
This Legend block contains the key for the status and trend assessment, the confidence assessment and the assessment regions (SMRs and OMRs or other regions used). More information on the various regions used in SMA2020 is available on the Assessment processes and methods page.
Status and trend assessment
|
Status assessment
(for Clean and safe, Healthy and biologically diverse assessments)
|
Trend assessment
(for Clean and safe, Healthy and biologically diverse and Productive assessments)
|
||
|---|---|---|---|
 |
Many concerns |
No / little change |
|
 |
Some concerns |
Increasing |
|
 |
Few or no concerns |
Decreasing |
|
 |
Few or no concerns, but some local concerns |
No trend discernible |
|
 |
Few or no concerns, but many local concerns |
All trends | |
 |
Some concerns, but many local concerns |
||
 |
Lack of evidence / robust assessment criteria |
||
| Lack of regional evidence / robust assessment criteria, but no or few concerns for some local areas | |||
 |
Lack of regional evidence / robust assessment criteria, but some concerns for some local areas | ||
| Lack of regional evidence / robust assessment criteria, but many concerns for some local areas | |||
Confidence assessment
|
Symbol |
Confidence rating |
|---|---|
|
Low |
|
|
Medium |
|
|
High |

Assessment regions
 and the Scottish Offshore Marine Regions (OMRs, O1 – O10)")
Key: S1, Forth and Tay; S2, North East; S3, Moray Firth; S4 Orkney Islands, S5, Shetland Isles; S6, North Coast; S7, West Highlands; S8, Outer Hebrides; S9, Argyll; S10, Clyde; S11, Solway; O1, Long Forties, O2, Fladen and Moray Firth Offshore; O3, East Shetland Shelf; O4, North and West Shetland Shelf; O5, Faroe-Shetland Channel; O6, North Scotland Shelf; O7, Hebrides Shelf; O8, Bailey; O9, Rockall; O10, Hatton.
 Regions. These have been used as the assessment areas for hazardous substances.")
, Regions.")