

What, why and where?
Marine renewable energy is provided by wind, wave and tidal devices. It has an important role in helping to tackle climate change by contributing to the Scottish Government’s ambitious emissions reduction and energy strategy. Total marine generation equates to 5% of total renewable energy generation in Scotland and 6% of installed capacity.
In 2018 offshore wind generated 1,371 GWh, while wave and tidal installations generated 9.3 GWh. Installed offshore wind capacity increased by 377 MW since 2017 to 623 MW in 2018 (mainly from the Beatrice wind farm) (Table 1). Hywind, the world’s first floating offshore wind farm became operational in 2017 and demonstrates the commercial potential of floating offshore wind technology. This opens up deep water sites and makes locating wind farms further offshore viable, increasing the potential of offshore wind power generation.

Scotland is a pioneer of wave and tidal technology, with more test and demonstration devices deployed than in any other country. Orkney is home to the world’s first grid-connected wave and tidal energy centre and the world’s largest tidal turbine. The Pentland Firth is home to the world’s largest planned tidal stream array.
|
|
Installed capacity (MW)
|
Generation (MWh)
|
|||
|
|
Wave/tidal capacity
|
Offshore wind capacity
|
Wave/tidal generation
|
Offshore wind generation
|
|
|
2014
|
7.388
|
197.35
|
2,146
|
569,226
|
|
|
2015
|
7.638
|
187.35
|
1,994
|
538,573
|
|
|
2016
|
13.007
|
187.35
|
9
|
502,426
|
|
|
2017
|
17.918
|
246.35
|
4,194
|
614,145
|
|
|
2018
|
19.918
|
623.15
|
9,298
|
1,370,571
|
|
Source: BEIS Energy Trends, September 2019 Table 6.1.
Installed capacity: the maximum output of electricity that can be produced under ideal conditions at time of installation.
Generation: The actual output of electricity produced in the given time period.
There are 4.47 GW of marine renewable projects currently in the pipeline (projects with consent) (Scottish Energy Statistics Hub). Almost 1 GW of this is currently under construction, mainly in the Moray Firth.
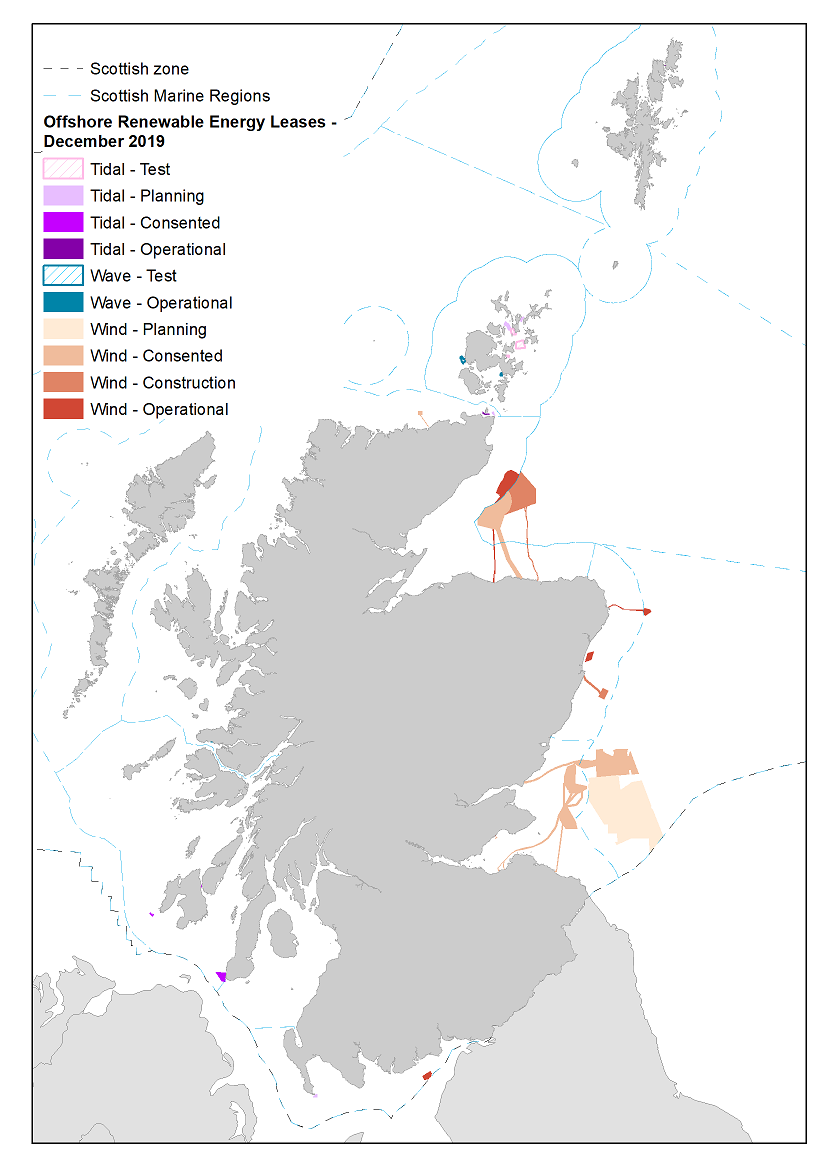
Figure 2: Location of wind, wave and tidal sites, in relation to Scottish Marine Regions / Offshore Marine Regions. Based on Crown Estate Scotland leases December 2019. Source: Crown Estate Scotland lease data © Scottish Government project data 2019.
Marine renewable energy and climate change
Renewable energy remains a huge opportunity and a strategic priority for the Scottish Government, playing a key role in decarbonising the energy system. In 2018, Scottish renewable electricity displaced an estimated 11.9 million tonnes of CO2 (Scottish Government Energy Statistics Database). Cables play an important role in bringing renewable ashore (see Subsea cables assessment).
Scotland is committed to a number of important energy targets, at both a national and EU level. The Climate Change (Scotland) 2009 Act establishes a long-term framework to cut greenhouse gas emissions by at least 80% below 1990 levels by 2050, with an interim target of 42% by 2020. In addition, the Scottish Government has made a commitment to generating 50% of energy demand from renewable sources by 2030, with an interim target of 30% by 2020 in the Scottish Energy Strategy.
Latest figures for progress towards these energy targets, as of March 2020, are:
- Offshore wind, wave and tidal generation makes is the equivalent of 10% of Scotland’s gross electricity consumption.
- 20.9% of total Scottish energy consumption came from renewable sources in 2018.
- 6.3% of non-electrical heat demand was generated from renewable sources in 2018.
- The equivalent of 90.0% of gross electricity consumption was from renewable sources in 2019.
(Scottish Energy Statistics, accessed May 2020).
To meet 2050 carbon reduction targets, domestic heating requirements will have to shift away from natural gas and use low carbon sources and the growth of electric vehicles will also impact demand.
National Grid (2019) scenarios for Scotland suggest a total Scottish generating capacity of between 15 and 25 GW by 2035 (10-20 GW low carbon generation). Demand in Scotland is not expected to exceed 4.7 GW by 2035 and therefore, there remains the potential to export power to other parts of the UK for a significant period of time. As of December 2019, Scotland’s installed renewable energy generating capacity is 11.8 GW, of which 981 MW was from offshore wind and 22 MW from wave and tidal energy.
Marine renewable energy: locations and installed capacity
For this assessment installed offshore marine energy is allocated to the region in which the structures are installed. Similarly, generation is allocated to the region to which its output is connected. Robin Rigg is an exception, the output comes ashore at Seaton, Cumbria, but the generation takes place in the Solway Scottish Marine Region off Dumfries and Galloway. Using this distribution method, for 2018 Dumfries and Galloway generated 40% of Scotland’s offshore wind electricity generation (note 36% could not be allocated to a Local Authority), Aberdeenshire 21% and Fife 3% (BEIS, Renewable electricity by Local Authority, September 2019).
For wave and tidal generation, Highland generates 78%, with Orkney Islands contributing 20% and Shetland Islands 2% (BEIS, Renewable electricity by Local Authority, September 2019).
The majority of offshore wind projects have been concentrated in the east and north east (Figure 2) whilst the tidal and wave projects have primarily been located in Orkney, Shetland and in the south west (Figures a and b).


Offshore wind
Wind is vital to Scotland’s future energy generation, with 92.4% of all planned capacity for renewables coming from wind. Even though the vast majority of Scotland’s wind generation to date has come from onshore rather than offshore installations, offshore wind is likely to play more of a role in the future. In 2018, offshore wind capacity and generation more than doubled compared to 2017 (Table 1), primarily due to the Beatrice wind farm becoming operational (National Grid, 2019).

There have been several years without any significant change in installed capacity of offshore wind (Table a). Due to the scale and nature of these projects, installation can follow many years after consent is initially granted. Furthermore, new consents must follow a seabed leasing process which itself must follow a sectoral planning exercise as outlined in the National Marine Plan (2015). A new Sectoral Marine Plan for Offshore Wind Energy is currently under development by Marine Scotland. This plan will identify new spatial Plan Options, from which new seabed leasing can be located. Accordingly, the number of projects currently in planning (Table f) is relatively low as the new plan and leasing process has not yet taken place.
|
|
Capacity (MW)
|
||||
|
Local authority
|
2014
|
2015
|
2016
|
2017
|
2018
|
|
Aberdeenshire
|
0
|
0
|
0
|
59
|
156
|
|
Argyll and Bute
|
0
|
0
|
0
|
0
|
0
|
|
Dumfries and Galloway
|
180
|
180
|
180
|
180
|
180
|
|
Fife
|
7
|
7
|
7
|
7
|
14
|
|
Highland
|
0
|
0
|
0
|
0
|
0
|
|
Moray
|
10
|
0
|
0
|
0
|
273
|
|
Orkney Islands
|
0
|
0
|
0
|
0
|
0
|
|
Shetland Islands
|
0
|
0
|
0
|
0
|
0
|
|
Total
|
197
|
187
|
187
|
246
|
623
|
|
|
Generation (MWh)
|
||||
|
Local authority
|
2014
|
2015
|
2016
|
2017
|
2018
|
|
Aberdeenshire
|
0
|
0
|
0
|
30,517
|
290,450
|
|
Argyll and Bute
|
0
|
0
|
0
|
0
|
0
|
|
Dumfries and Galloway
|
551,517
|
522,604
|
493,514
|
536,988
|
545,208
|
|
Fife
|
2,594
|
17,184
|
7,027
|
10,895
|
40,668
|
|
Highland
|
0
|
0
|
0
|
0
|
0
|
|
Moray
|
14,163
|
0
|
0
|
0
|
0
|
|
Orkney Islands
|
0
|
0
|
0
|
0
|
0
|
|
Shetland Islands
|
0
|
0
|
0
|
0
|
0
|
|
Total
|
568,273
|
539,788
|
500,541
|
578,400
|
876,326
|
Source: BEIS, Renewable electricity by Local Authority, September 2019. Notes: As noted in the source, there are many projects where generation is not available at the local authority level but are available at the wider region or country level. As such, the generation figures in Table a may be lower than those provided for Scotland as a whole.
Wave and tidal
The European Marine Energy Centre (EMEC) in Orkney is a global centre of expertise with more wave and tidal energy devices having been tested there than at any single site in the world. EMEC is also at the forefront in the development of international standards for marine energy, and is forging alliances with other countries, exporting its knowledge to stimulate the development of a global marine renewables industry.
|
|
Capacity (MW)
|
||||
|
Local authority
|
2014
|
2015
|
2016
|
2017
|
2018
|
|
Aberdeenshire
|
0
|
0
|
0
|
0
|
0
|
|
Argyll and Bute
|
1
|
1
|
0
|
0
|
0
|
|
Dumfries and Galloway
|
0
|
0
|
0
|
0
|
0
|
|
Fife
|
0
|
0
|
0
|
0
|
0
|
|
Highland
|
0
|
0
|
6
|
6
|
6
|
|
Moray
|
0
|
0
|
0
|
0
|
0
|
|
Orkney Islands
|
7
|
7
|
7
|
12
|
14
|
|
Shetland Islands
|
0
|
0
|
0
|
1
|
1
|
|
Total
|
7
|
8
|
13
|
18
|
20
|
|
|
|
||||
|
|
Generation (MWh)
|
||||
|
Local authority
|
2014
|
2015
|
2016
|
2017
|
2018
|
|
Aberdeenshire
|
0
|
0
|
0
|
0
|
0
|
|
Argyll and Bute
|
86
|
187
|
0
|
0
|
0
|
|
Dumfries and Galloway
|
0
|
0
|
0
|
0
|
0
|
|
Fife
|
0
|
0
|
0
|
0
|
0
|
|
Highland
|
0
|
0
|
9
|
2,892
|
7,228
|
|
Moray
|
0
|
0
|
0
|
0
|
0
|
|
Orkney Islands
|
2,060
|
1,808
|
0
|
1,251
|
1,882
|
|
Shetland Islands
|
0
|
0
|
0
|
51
|
189
|
|
Total
|
2,146
|
1,994
|
9
|
4,194
|
9,298
|
Source: BEIS: Renewable electricity by Local Authority, September 2019.
Wave Energy Scotland (WES) was established by the Scottish Government in 2014 as a collaborative model to support innovation and avoid duplication in addressing the technical challenges for wave energy of reliability, survivability, performance and affordability. It is the world’s largest wave technology programme and has maintained Scotland’s position as the leading nation in this emerging sector. In January 2019 WES announced details of the two Scottish wave energy prototypes that will be deployed in Orkney in 2020.
In February 2019, the Scottish Government’s £10 million Saltire Tidal Energy Challenge Fund was launched to drive innovation and incentivise investment in the Scottish tidal energy sector, supporting a pathway to cost reduction and commercialisation. Funding support will be provided for tidal projects to be deployed in Scottish waters by September 2020.
Scotland is home to a number of world leading tidal stream projects:
- Simec Atlantis Energy – MeyGen project in Pentland Firth (currently 6 MW installed capacity), with 86 MW of further development capacity under its seabed lease. The first 4 turbines were installed by February 2017 and by March 2020 had generated around 26 GWh of electricity according to the Offshore Energy web site.
- Nova Innovation – Shetland Tidal Array, including addition of Tesla’s battery storage technology. Under the Enabling Future Arrays in Tidal (EnFAIT) project now underway, the array will be extended from three to six turbines, with a total rated capacity of 600kW. See the Nova Innovation case study.
- Orbital Marine Power - SR2000 turbine deployed in Orkney between October 2016 and September 2018, and next generation Orbital O2 turbine under development and due to be deployed in Orkney in 2020.

What has happened since 2011?
Since 2011 when the Scottish Government published its plan for offshore wind development in Scottish Territorial Waters – Blue Seas Green Energy (Part A and Part B), three sites, identified that plan have gained consent, with Beatrice Offshore Wind Farm becoming operational in 2019 with an installed capacity of 588 MW.
Demonstration sites (new technology and <100 MW) have also progressed in Scotland since 2011. A few have been consented, with the potential to demonstrate an array of innovative and new substructure technologies. These include the 30 MW Hywind Scotland Pilot Park (located off the coast of Peterhead) which became operational in October 2017; the 50 MW Kincardine Offshore Wind Farm Project (under construction, with one turbine operational) and the 12 MW Dounreay Tri Wind Demonstration Project (currently on hold).
.")
Whilst offshore wind made up only 5.6% of the installed renewable capacity in Scotland in 2018, it was also the sector that saw the highest percentage growth when compared to 2014 and even just 2017 figures (Table c).
|
Technology
|
Installed capacity (MW) 2018 (4th quarter)
|
% change against 2017 (4th quarter)
|
% change against 2014 (4th quarter)
|
% of total (2018)
|
|
Onshore wind
|
7,936
|
8.1
|
56.2
|
71.9
|
|
Offshore wind
|
623
|
153.0
|
215.8
|
5.6
|
|
Shoreline wave / tidal |
20
|
11.2
|
169.6
|
0.2
|
|
Solar photovoltaics
|
344
|
6.5
|
96.5
|
3.1
|
|
Small scale hydro
|
315
|
0.7
|
67.1
|
2.9
|
|
Large scale hydro
|
1,339
|
0.0
|
0.0
|
12.1
|
|
Landfill gas
|
116
|
0.0
|
-0.4
|
1.0
|
|
Sewage sludge digestion
|
7
|
0.0
|
5.9
|
0.1
|
|
Energy from waste
|
20
|
11.4
|
11.4
|
0.2
|
|
Animal Biomass (non-AD)
|
13
|
0.0
|
0.0
|
0.1
|
|
Anaerobic Digestion
|
46
|
3.0
|
76.1
|
0.4
|
|
Plant Biomass
|
258
|
16.9
|
48.6
|
2.3
|
|
Total
|
11,036
|
|
|
Source BEIS, Renewable electricity capacity and generation (Energy Trends 6.1 – quarterly), March 2020.
92.4% of all planned capacity for renewables comes from wind, even though the vast majority of Scotland’s wind capacity has come from onshore sources to date – offshore wind is likely to play more of a role in the future as onshore capacity is used up and offshore wind allows for larger scale projects. As described above, in 2018 the installed offshore wind capacity more than doubled. These projects and increased capacity have helped contribute to a £0.26 bn turnover in 2018 and contributed to around 1,700 employees in 2018. With around 4.1 GW of offshore wind pipeline capacity (consented projects not yet constructed) as of December 2019 there is great potential for this to grow (see Offshore Wind tab of the Scottish Energy Statistics Hub).
Currently, the capacity of wave and tidal in Scotland is relatively small (22 MW in December 2019). However, it is a technology that is developing – projects totalling 344 MW are in the pipeline, including the Brims Array in the Orkney islands (200 MW capacity).
Marine renewable energy by Scottish Marine Regions, the assessment regions
Information on the installed capacity and generation of offshore wind, wave and tidal energy is collated by region (Scotland, Wales etc.) and at local authority level by BEIS. However, there are some places where the information is not available at a particular level and so inconsistencies may emerge in total figures. The installed capacity figures can be assigned to the relevant Scottish Marine Region or Offshore Marine Region based on their spatial location. The latest information from the Marine Scotland Licensing Operations Team is in Table d. 2019 data are provided in the Forward Look section (Table e) to highlight the continued growth of this sector. These figures are updated based on the most recent consent or licence variations.
|
Scottish / Offshore Marine Region (SMR / OMR)
|
Total installed capacity (MW) 2014
|
Total installed capacity (MW) 2018 (1)
|
||
|
SMRs
|
Wind
|
Wave and Tidal
|
Wind
|
Wave and Tidal
|
|
Solway
|
180
|
0
|
174
|
0
|
|
Argyll
|
0
|
0
|
0
|
0
|
|
West Highlands
|
0
|
0
|
0
|
0
|
|
North Coast
|
0
|
0
|
0
|
6
|
|
Orkney Islands
|
0
|
8.1
|
0
|
2.4
|
|
Shetland Isles
|
0
|
0
|
0
|
0.56
|
|
Moray Firth
|
10
|
0
|
273
|
0
|
|
North East
|
0
|
0
|
95.2
|
0
|
|
Forth and Tay
|
7
|
0
|
7
|
0
|
|
OMRs
|
|
|
|
|
|
Fladen and Moray Firth Offshore
|
0
|
0
|
0
|
0
|
|
Long Forties
|
0
|
0
|
30
|
0
|
|
Subtotal
|
197
|
8.1
|
579.2
|
8.96
|
|
Total
|
205.1
|
588.16
|
||
Source: Marine Scotland Licensing Operations Team Application details (December 2019) except for Orkney Islands 2014 wave and tidal figure from Ocean Energy Systems report. Total installed capacity 2018 includes the Beatrice Demonstration turbines which have been scheduled for decommissioning.
Note discrepancy of installed capacity. Table d provides the installed capacity figures for offshore wind, wave and tidal projects in the Scottish Marine Regions and Offshore Marine Regions whilst other tables have presented information by local authority. Generation figures are recorded where the export comes ashore. As such, depending on cable route, a project may be situated in one SMR but its generation is counted in another. Additionally, installed figures in the source for Table a do not account for variations in projects and consents. For example, the Robin Rigg project now has an installed capacity of 174 MW as two turbines were decommissioned.
Addressing the data gaps - Scottish Marine Energy Research
Due to the novel and innovative nature of wave and tidal devices, there is limited evidence regarding the potential impacts of these technologies on the marine environment. To address this, a phased approach is taken to the deployment of these technologies (see further, the draft Survey, Deploy and Monitor licensing policy guidance (April 2016)) which looks at smaller-scale deployment in low-sensitivity locations, coupled with monitoring, before scaling up of technologies to commercial-scale.
The Scottish Marine Energy Research (ScotMER) programme has been established to support ongoing, collaborative research projects to improve the understanding and assessment of the environmental and socio-economic implications of offshore renewable energy development.
ScotMER includes a process to identify high priority evidence gaps and then, where possible, facilitate research projects to address these. This research will support decision making and management by reducing uncertainty in consenting decisions and promote the sustainable development of the seas. Current projects include mapping seabird behaviour and habitat use, improving the modelling of population consequences of disturbance for marine mammals, and investigating the timing and pathways of salmon migrations.
Contribution to the economy
While the capacity and generation of offshore renewable energy are well documented, the financial information needed to estimate Gross Value Added (GVA) specifically for the offshore elements of renewable energy is not yet available. A research study is currently exploring the availability of specific marine economic data including, marine renewable energy related economic data in Scotland. This will be reviewed with a view to incorporating the information into Scotland’s Marine Economic Statistics.
Implementing and sustaining local involvement (i.e. jobs or construction/operations contracts) is critical for Scotland to realise the benefits of offshore wind. Scotland has existing engineering, project management and marine engineering expertise which is well placed to provide services for this sector. Several large-scale offshore wind developments and cable/interconnector projects have been concluded since 2011 (see Subsea cables assessment), with further projects anticipated to commence construction in the next 2 years (see Forward Look).
The offshore wind sector expects to invest up to £210 billion between 2016 and 2025, primarily in Europe. (Source: Scottish Enterprise, Oil and Gas ‘Seize the Opportunity’ Guides – Offshore Wind) which presents tremendous opportunities for Scottish supply chain and manufacture.
In 2018, the low carbon and renewable energy (LCRE) sector directly supported 23,100 full-time equivalent jobs in Scotland. This represents around 10% of employment in the UK LCRE sector. In 2018, the Scottish low carbon and renewable energy economy directly generated £6.4 billion. The renewable energy part of the LCRE sector is particularly important in Scotland where it accounts for more than half of Scotland’s low-carbon turnover. In contrast, renewable energy accounts for around 35% of LCRE turnover in the UK as a whole. Offshore wind itself produced an estimated £0.26 billion turnover during 2018, employing just under 2,000 people according to the ONS Low carbon and renewable energy economy survey published in January 2020.
The Offshore Renewable Energy Catapult, ‘Tidal Stream and Wave Energy Cost Reduction and Industrial Benefit’ report in April 2018 by the Offshore Renewable Energy Catapult found that the tidal stream industry could generate a net cumulative benefit to the UK of £1.4 bn and support 4,000 jobs by 2030. Also that wave energy could provide a net positive contribution to the UK economy of £4 bn and support 8,100 jobs by 2040.
Examples of socio-economic effects
- Increased employment (both full and part time) via manufacturing, construction, operation and maintenance, research, monitoring, decommissioning.
- Diversity of electricity supply and meeting energy objectives and climate change targets.
- Stable and reliable supply of power.
- Potential tourism associated with visits to offshore sites.
- Potential competition for marine space with other users.
The rapid growth of the renewable energy sector has been driven by Scottish, national and EU targets for renewable energy generation and reduction of emissions. This growth has been further facilitated by governmental support for energy generation, including schemes such as the Renewables Obligation Certificate and Contract for Difference schemes.
Scottish Government is investigating aspects of socio-economics related to Offshore Wind and Marine Renewable energy development to identify, measure and value the economic activity and social impact for Scotland from offshore wind, wave and tidal energy projects. The study is considering the potential economic activities and impacts across different stages of projects life-cycle, from scoping to the operational stage, including planning, manufacture of components, installation and maintenance. This study will also identify where there is the greatest potential to increase economic and social benefits.
A second study, due to be published in 2020, is reviewing current methods of identifying the local footprint for socio-economic impacts and will provide recommendations towards standardising how a local area is defined and measured for marine developments. To achieve this the study will review current methods for defining local boundaries for assessing the socio-economic impacts of marine developments. The review will focus on renewable energy, but draw on knowledge and information from other marine sectors that have more experience in defining these regions. The study will also develop and test principles for defining the local area of impact of marine developments to underpin future standardisation.
Pressures on the environment
An OSPAR agreed list of marine pressures is used to help assessments of human activities in the marine environment. The marine pressure list has been adapted for use in Scotland via work on the Feature Activity Sensitivity Tool (FeAST). Renewable energy activities can be associated with 23 marine pressures – please read the pressure descriptions and benchmarks for further detail.
The list of marine pressures is used to help standardise assessments of activities on the marine environment, and is adapted from an agreed list prepared by OSPAR Intercessional Correspondence Group on Cumulative Effects (ICG-C) (see OSPAR 2014-02 ‘OSPAR Joint Assessment and Monitoring Programme (JAMP) 2014-2021’ Update 2018’ (Table II).
The Feature Activity Sensitivity Tool (FeAST) uses the marine pressure list to allow users to investigate the sensitivity of Scottish marine features. It also associates all pressures that might be exerted by a defined list of activities at a particular benchmark. The extent and impact of each pressure from a given activity will vary according to its intensity or frequency. The extent and impact of the pressure will also vary depending on the sensitivity of the habitat or species on which it is acting. The existence of multiple activities, and potentially multiple pressures, at specific locations will result in a cumulative impact on the environment.
FeAST is a developing tool. A snap shot from 2019 was used for the development of SMA2020. Please consult the FeAST webpage for further information and up to date information.
The list of pressures below associated with this activity is given in alphabetical order. Clicking the pressure will give you more information on the pressure and examples of how it may be associated with the activity.
Forward look
Renewable energy development is anticipated to expand over the coming decades. Technological advancements will likely support the deployment of floating offshore wind within deeper waters, which is important given the increasing constraints posed to traditional, fixed-bottom offshore wind developments that require shallow water. The forthcoming Sectoral Marine Plan for Offshore Wind Energy, due in 2020, will identify Plan Options suitable for the deployment of several GW of offshore wind (Figure 3).
The volume of wave and tidal development predicted in 2011 has not come to fruition, due to issues surrounding the commercialisation of such technologies. Also due to the lack of a route to market resulting from the removal of the ring-fenced Contract for Difference (CfD) for wave and tidal energy in 2016. This means wave and tidal projects compete against the much cheaper offshore wind for a guaranteed energy price. The potential of these technologies as part of the future energy mix continues to be explored through numerous forums and programmes including the Scottish Marine Energy Industry Working Group, Wave Energy Scotland, and the significant level of marine energy expertise in Scotland’s universities, notably the University of Edinburgh. There are existing wave and tidal draft Plan Options from 2013 (Figure 3).
 and draft plan options for wave and tidal (2013).")
The decarbonisation of the energy system is an essential component of progress towards the 2045 net-zero emissions target set by the Scottish Government in response to the global climate emergency. As well as meeting Scotland’s own domestic requirements, these abundant renewable energy resources present the opportunity to export low carbon economy energy to other parts of the UK and Europe via interconnectors and other cable works (see Subsea cables assessment).
There are 4.1 GW of offshore wind projects in the pipeline compared to almost 1.0 GW of installed capacity as of December 2019 (BEIS, Energy Trends, December 2019, ET 6.1).
The developing Sectoral Marine Plan for Offshore Wind, including deep water plan options, will provide the strategic spatial and planning framework for the future leasing of the seabed for offshore wind. This and the progression of the ScotWind seabed leasing process by Crown Estate Scotland will likely lead to the deployment of further offshore wind, in both shallow and deeper waters.
The further growth of offshore wind energy in Scotland and across Europe may also drive further interconnector works, as well as innovative approaches such as offshore energy hubs, for example the North Sea Wind Power Hub.
Projects in the pipeline 2019
Table d demonstrated the change in installed capacity of marine renewable energy projects from 2014 to 2018. Table e shows that this growth has continued into 2019 and Table f, showing planned, consented awaiting construction and projects under construction demonstrates that much more development is expected over the next few years. This will be in addition to any offshore wind projects that come forward following the ScotWind leasing process.
|
Scottish / Offshore Marine Region (SMR / OMR)
|
Total installed capacity (MW) 2019
|
|
|
SMRs
|
Wind
|
Wave and Tidal
|
|
Solway
|
174
|
0
|
|
Argyll
|
0
|
0
|
|
West Highlands
|
0
|
0
|
|
North Coast
|
0
|
6
|
|
Orkney Islands
|
0
|
2.4
|
|
Shetland Isles
|
0
|
0.56
|
|
Moray Firth
|
598
|
0
|
|
North East
|
95.2
|
0
|
|
Forth and Tay
|
7
|
0
|
|
OMRs
|
|
|
|
Fladen and Moray Firth Offshore
|
0
|
0
|
|
Long Forties
|
30
|
0
|
|
Subtotal
|
904.2
|
8.96
|
|
Total
|
913.16
|
|
In addition, there are several GW of projects currently being planned with many more already consented and awaiting construction. In 2019, the total consented capacity, including projects already installed and operational, was 6,974 MW. This is 176 MW greater than the sum of the installed, consented awaiting construction and construction totals as not all consented capacity is built or becomes operational.
|
|
|
Capacity (MW)
|
||
|
Sector
|
Scottish / Offshore Marine Region
|
Planning
|
Consented awaiting construction
|
Construction
|
|
Wave and tidal energy
|
Argyll
|
|
40.5
|
|
|
North coast
|
|
80
|
|
|
|
Orkney Islands
|
|
7.6
|
1.2
|
|
|
Shetland Isles
|
|
|
|
|
|
Solway
|
30
|
|
|
|
|
West Highlands
|
|
|
|
|
|
Offshore wind
|
Fladen and Moray Firth Offshore
|
|
850
|
1,116
|
|
Forth and Tay
|
|
1,179.9
|
|
|
|
Long Forties
|
2,600
|
2,550
|
|
|
|
Moray Firth
|
|
|
|
|
|
North coast
|
|
12
|
|
|
|
North East
|
|
|
48
|
|
|
Solway
|
|
|
|
|
|
|
Project stage total
|
2,630
|
4,720
|
1,165.2
|
There are several tidal projects in the planning stage or consenting process at present. An additional 200 MW of tidal capacity could come from the Brims Tidal Array in the Orkney Islands. As this project is currently on hold it has not been counted above.
Ports and harbours
Scotland’s ports and harbour are well placed to take advantage of the opportunities presented by the growth of offshore renewables – including opportunities associated with manufacturing, construction, operation, maintenance and decommissioning activities. A detailed breakdown of each port’s capabilities can be found in the Scottish Energy Ports Capability Directory.
Since 2014, improvements have been made to many of the ports and harbours identified in the National Renewables Infrastructure Plan (N-RIP), to ensure that these facilities are fit for purpose and ready to take advantage of new these opportunities and further work is continuing across Scotland. For example, as a result of works to provide deep water access and other onshore facilities, Nigg Energy Park was successful in securing a contract, with support from HIE, for the assembly of turbines during the construction of the £2.6 billion Beatrice Offshore Windfarm. Wick has now been selected as the operations and maintenance port for the Beatrice Offshore Windfarm, resulting in further major investment in port facilities in the Cromarty Firth region.
Scottish Enterprise and HIE published the Decommissioning Action Plan in 2016 and in 2017 the Scottish Government announced the launch of the £5 million Decommissioning Challenge Fund, to support Scottish businesses to take advantage of opportunities associated with decommissioning activity, both nationally and globally. Funding has been awarded to numerous N-RIP ports, including Ardersier, Kishorn, Dundee, Methil and Hunterston. The funding awarded for Ardersier will be used to conduct feasibility studies for quayside extension and upgrade works, which would enable the port to take advantage of these emerging opportunities.
In addition to the forthcoming Sectoral Marine Plan for Offshore Wind Energy, the constraints of grid infrastructure and transmissions charges on Scottish offshore wind deployment and the benefits of grid upgrades will be investigated. Supply chain activities in the offshore wind sector are also being studied further.
Economic trend assessment
Economic trends are based on the change, between 2014 and 2018, in generation for offshore renewables, with wind, wave and tidal generation combined, and are reported by local authority. While trends are provided here, the full picture, showing generation by year, local authority and renewable energy type is given in Tables a and b . As not all offshore generation can be allocated to a local authority, the Scotland trend is based on total Scotland generation rather than the sum of the local authority figures. Where a change is less than 5% this is shown as stable. Where a percentage change cannot be calculated due to having generation figures in 2018 but none in 2014, this has been shown as an increase.
Confidence
Scotland, 3 stars as from published statistics. Local Authority level, 2 stars as not all offshore generation can be allocated to a local authority.
|
Local authority |
Offshore renewables |
|
Aberdeenshire |
|
|
Argyll & Bute |
|
|
Dumfries & Galloway |
|
|
Fife |
|
|
Highland |
|
|
Moray |
|
|
Orkney Islands |
|
|
Shetland Islands |
|
|
Scotland |
|
This Legend block contains the key for the status and trend assessment, the confidence assessment and the assessment regions (SMRs and OMRs or other regions used). More information on the various regions used in SMA2020 is available on the Assessment processes and methods page.
Status and trend assessment
|
Status assessment
(for Clean and safe, Healthy and biologically diverse assessments)
|
Trend assessment
(for Clean and safe, Healthy and biologically diverse and Productive assessments)
|
||
|---|---|---|---|
 |
Many concerns |
No / little change |
|
 |
Some concerns |
Increasing |
|
 |
Few or no concerns |
Decreasing |
|
 |
Few or no concerns, but some local concerns |
No trend discernible |
|
 |
Few or no concerns, but many local concerns |
All trends | |
 |
Some concerns, but many local concerns |
||
 |
Lack of evidence / robust assessment criteria |
||
| Lack of regional evidence / robust assessment criteria, but no or few concerns for some local areas | |||
 |
Lack of regional evidence / robust assessment criteria, but some concerns for some local areas | ||
| Lack of regional evidence / robust assessment criteria, but many concerns for some local areas | |||
Confidence assessment
|
Symbol |
Confidence rating |
|---|---|
|
Low |
|
|
Medium |
|
|
High |

Assessment regions
 and the Scottish Offshore Marine Regions (OMRs, O1 – O10)")
Key: S1, Forth and Tay; S2, North East; S3, Moray Firth; S4 Orkney Islands, S5, Shetland Isles; S6, North Coast; S7, West Highlands; S8, Outer Hebrides; S9, Argyll; S10, Clyde; S11, Solway; O1, Long Forties, O2, Fladen and Moray Firth Offshore; O3, East Shetland Shelf; O4, North and West Shetland Shelf; O5, Faroe-Shetland Channel; O6, North Scotland Shelf; O7, Hebrides Shelf; O8, Bailey; O9, Rockall; O10, Hatton.
 Regions. These have been used as the assessment areas for hazardous substances.")
, Regions.")