
Background
Grey and harbour seals breed around the Scottish coast and forage in its waters. As top predators, seals can reflect the state of the marine ecosystem. Key potential drivers or pressures include pathogens, toxins and contaminants, competition with other species, changes in prey availability, underwater noise, disturbance, and fisheries and aquaculture interactions.
This assessment uses estimates of seal numbers from regular monitoring programmes focused on seal haul-out sites and breeding colonies. The data may also indicate major changes in distribution, although this is less readily assessed from the abundance surveys.
The assessment uses three different datasets:
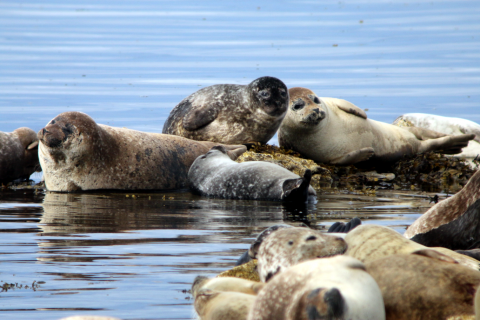
- Grey seal pup production during the autumn/winter breeding season (September – December): Grey seal females give birth to a single pup (Figure 1). Unlike harbour seals, these pups remain on land for the first few weeks of live and thus, can be counted, allowing regional ‘pup production’ to be estimated and trends assessed.
- Grey seal abundance during the summer (August): Outside the breeding season, grey seals are highly mobile and range over large distances, using different haul-out sites. However, regional numbers in the summer are useful for determining changes related to overall abundance or redistribution.
- Harbour seal abundance during the moult (August): Counts during their annual moult (Figure above), when the majority of the population are hauled out, are used to estimate population size and assess trends.


Seals are long-lived top marine predators whose populations can be readily monitored when they are on land, making them useful indicators of the health of the seas around Scotland. Changes in ecosystem health may be caused by natural or anthropogenic factors. Fluctuations may be caused by natural variations in food webs and prey populations or parasites and pathogens. Important human impacts include fisheries by-catch, fish resource competition, noise, habitat loss, disturbance, shooting related to aquaculture and fisheries protection, impacts from marine renewable energy developments and pollutants. However, ascribing changes in seal abundance or distribution directly to anthropogenic pressures is difficult but does not mean that human pressures are not driving population change. Nonetheless, changes in the numbers of animals and their distribution, particularly when assessed in conjunction with other indicators, can be indicative of human-induced perturbations.
As Scottish seals are protected species, impacts on them must be considered during marine developments and so seal population assessments are of direct relevance to marine spatial planning and longer term strategic developments
Under the Marine (Scotland) Act 2010, Part 6, the “Scottish Ministers must have regard to any advice about the management of seal populations which is given to them by the Natural Environment Research Council”. This duty is carried out by the NERC Special Committee on Seals (SCOS, 2019) with scientific advice and responses to questions from Scottish Government drafted by the Sea Mammal Research Unit. Further details of all three seal indicators can be found in the annual SCOS Advice document, downloadable from http://www.smru.st-andrews.ac.uk/research-policy/scos/
Grey seals and harbour seals are surveyed when they come ashore to haul out and in the case of grey seals when they breed. Surveys are usually conducted from the air but may also be carried out from land or occasionally by boat. In most areas aerial surveyors take photographs of haulouts or breeding colonies and animals are later counted from the images.
Grey seal pup production
This assessment presents trends in grey seal pup production as a measure of population condition. Although no straightforward link exists between changes in pup production and human activities, some activities may, at least in part, affect dynamics. Pup production is derived from counts of grey seal pups at their major breeding sites (“colonies”). Grey seals gather to breed at traditional colonies located on islands, sand banks and mainland coastlines around Scotland.
The locations of major breeding colonies are shown in Figure a. The size of individual breeding colonies varies greatly, from those where only a few pups are born to sites with over 6,000 pups. Aerial photographic survey methods are generally used, but in some areas ground counts are conducted. Multiple counts per colony are generated, spread across the breeding season (September – December, depending on colony location). These are then used to estimate total pup production by region (see Assessment method).

Grey seal summer abundance
During the harbour seal moulting surveys grey seals are also counted, although the probability of individual animals hauling out during this time of year is not necessarily high and varies considerably between surveys. Synoptic surveys coupled with telemetry data to determine haul out probabilities provide a robust estimate of grey seal population size, independent of pup production. However, because grey seals may travel extensively between breeding and foraging sites (Russell et al., 2013), animals counted in a location during the summer are not necessarily those that breed in the region. Through time, these summer counts can indicate changes in abundance or redistribution.
Harbour seal abundance during the moult
Harbour seals in Scotland are counted during their annual summer moulting period when the probability that animals will haul out, and so be detectable during a survey, is highest. A helicopter mounted thermal image camera is used to detect these camouflaged animals on rocky shores, coupled with a high resolution digital camera to determine species. Large sand bank haul-out sites (such as the Moray Firth and East Scotland areas) are counted from oblique aerial photographs. Minimum population sizes can be estimated from these counts.
Trends can also be estimated provided the moulting period does not shift over time. Using data from animal-borne telemetry devices, the proportion of seals hauled out during the survey window can be estimated and the haul counts scaled to population size (Lonergan, Duck, Moss, Morris, & Thompson, 2013). In this assessment counted seals are reported as a consistent index of minimum population size since there is no evidence the proportion of the population hauled out during the moult has changed over time.
Current Survey Work
Current survey work for all three indicators is carried out by the Sea Mammal Research Unit funded by UKRI (NERC), Scottish Natural Heritage (now Nature Scot) and Marine Scotland. Ground counts of grey seal breeding colonies are conducted by Scottish Natural Heritage (Shetland) and Fife Seal Group (Firth of Forth islands).
Harbour seal moult and grey seal summer counts are carried out over a 5 year period with a target of obtaining a complete survey of the Scottish coast within 3 years, weather conditions allowing (with some areas such as the Moray Firth and East Scotland being counted annually). See Figure b in Assessment Method.
Grey seal pup production was monitored annually until 2010, now biennially due to budget constraints. This decision has not impacted the ability to detect trends in abundance. However, SCOS continues to monitor this and will make recommendations regarding the survey design decisions and constraints in future.
Assessment values and baselines
Ideally baselines should equate to reference conditions, i.e. set at a point in the historical time-series when human impacts were negligible. However, such historical abundance and distribution data are not available for either species of seal and the data time series provides neither an indication of when an unimpacted state might have occurred nor what the values would have been.
Under the Habitats Directive, in the absence of an objective ‘favourable reference level’ for seal abundance and distribution, the baseline value defaults to that in 1992, the starting year of the Directive (Method C; OSPAR, 2012). The same default was adopted for the Marine Strategy Framework Directive (MSFD) even though this represents depleted populations in many areas. Indicator assessment values were set as a deviation from the baseline value (Method 3; OSPAR, 2012). It should be noted that where data series do not extend back to 1992 and a shorter timescale is assessed, a proportional decline threshold assessed since the baseline is not equivalent to those where data do extend to 1992 (for example, a 25% decline since 2003 describes a more rapid contraction in the population than a 25% decline since 1992).
Bearing in mind that the arbitrarily assigned baseline does not necessarily reflect an unimpacted state or ‘favourable reference level’, a short-term rate-based assessment value was also adopted that uses a rolling baseline (Method 1i; OSPAR, 2012). Here, the average annual rate of population change over the reporting period was assessed.
However, in their advice manual on biodiversity targets and indicators for MSFD, OSPAR’s Inter-sessional Correspondence Group on Co-ordination of Biodiversity Assessment and Monitoring (ICG-COBAM) noted that there is a potential problem with this type of quantitative trend assessment values, known as ‘shifting baselines’ (OSPAR, 2012). Thus, each successive assessment uses a different starting point as a basis for comparison. This could result in a substantial overall decline not being flagged as a problem because in any one time period the rate of decline remains below the assessment value.
To address the points above, two assessment values were used for the grey and harbour seal abundance to keep the assessment in line with others that use these data (OSPAR, MSFD).
- No decline in seal abundance of > 1% per year in the previous 6 year period (this is approximately 6% over 6 years).
- No decline in seal abundance of > 25% since the fixed baseline at the start of the Habitats Directive in 1992 (or closest value).
For the OSPAR intermediate assessment, a similar set of values was suggested for seal distribution but as meaningful changes in this metric are currently difficult to detect and assess from abundance surveys this was not taken forward as an indicator. These issues hold true for the Scottish seal data and therefore only abundance data will be used.
There are many factors that could cause the number of seals counted during any one year to vary aside from true changes in population size including variation in weather, or recent disturbance at a colony or haul-out site. It is therefore advisable to examine the variability in survey counts and incorporate this variability (as confidence intervals) into trend or population size change estimates.
Seal management areas
Seal management areas used in the assessment (Figure b) were drawn up to allow populations to be assessed and managed based on their ecology, life history and genetic structuring (Olsen et al., 2017).
 and Scottish Marine Regions (grey lines).")
Grey seals range more widely at sea than harbour seals and may visit multiple distant haul-out sites (McConnell, Fedak, Lovell, & Hammond, 1999). The seal management areas are sufficiently large that individuals will be distributed on land in relation to where they forage at sea. (Russell et al., 2013). Thus, grey seal summer counts are useful for monitoring where animals acquire resources and how this has changed. Insights into the seasonal movement of grey seals in the UK from telemetry data indicate that the foraging distribution can be considerably different from the grey seal breeding distribution (Russell et al., 2013). Despite this, individual mature seals of both sexes are usually faithful to breeding sites and may return to within 10–100 m of individual breeding locations (Pomeroy, Twiss, & Redman, 2000).
Harbour seals foraging areas are also linked to their haulouts on land. Typically harbour seal forage and haul out in the same management area. Thus, assessments based on haul out counts in a seal management area are likely representative of the population foraging in that region.
Data review
These data are reviewed annually by the Special Committee on Seals and are published in the SCOS reports available on the Sea Mammal Research Unit website. Peer reviewed papers have also been published, (Thompson, Duck, Morris, & Russell, 2019; Russell et al., 2019).
Datasets
- Grey seal pup production
Major colonies in Scotland were surveyed by the Sea Mammal Research Unit (SMRU) annually up to 2010 and are now surveyed biennially. Aerial surveys to estimate grey seal pup production (i.e. the total number of pups born annually) are flown at regular intervals 3-5 times across the breeding season. Using a model of the birth process and the development of pups, a colony-specific pup production estimate is derived. In 2012, SMRU replaced the film-based large-format, used since 1985, with a new digital camera system. The effect of changing methods is currently being assessed. Data from ground counted colonies in Shetland and the Firth of Forth provided by SNH and Fife Seal Group are also included. The dataset ranges from 1985 to 2016.
- Grey seal summer abundance
At the same time as harbour seals are surveyed during the moult, the number of grey seals on land are counted. Then the time grey seals spend hauled out during the survey window, obtained from telemetry data (SCOS, 2019), is used to scale these counts to population size estimates (denoted the independent estimate as it is not reliant on the pup production data and therefore provides an additional estimate of the size of the population using this independent approach). However, this dataset is only available on a 5-6 yearly rotation. For this assessment changes in abundance between 2008 and 2014 were compared.
- Harbour seal abundance during the moult
Harbour seal moult counts by seal management area (Figure b) from 1989-1996 (depending on the area) to 2016 were used to estimate their abundance in Scotland (Note: because not all areas are surveyed every year the baseline year varies between areas areas). Where possible a seal management area was surveyed within one season, although occasionally this would range across multiple years. Some small areas are not surveyed as regularly. Primarily at the estuarine sites on the east coast, surveys have been carried out more regularly (often at least annually) since the early 2000s. The coverage of these surveys typically encompassed the majority (but not all) seals in the Moray Firth and East Scotland. Detecting and estimating trends are carried out on the data from these regular surveys rather than the counts for the whole area. On rocky shore habitats, surveys are every 5 years though more regular surveys are attempted in areas once there is an indication of a decline. Trends were modelled using generalised linear and additive models. Confidence intervals around the trends were also calculated, allowing assessment of statistical significance to be determined. The surveys cover the entire coast of Scotland.
Spatial coverage
The harbour seal abundance and grey seal summer abundance data cover the whole of the coast of Scotland on approximately a 5-yearly cycle, with a view to reducing this to 3 years if weather and logistics permit. Grey seal pup production is assessed at all the major breeding colonies. The minor colonies are irregularly counted by SMRU or by other organisations (such as SNH) see Figure a.
Assessment
This assessment is therefore based on quantitative, robust, long-term seal abundance data that allowed trend analysis to be carried out for harbour seal abundance and grey seal pup production data. Comparison between two data points for grey seal summer abundance was also possible. The population trends and changes in abundance by seal management area were assessed against the assessment value criteria given above.
The assessment is useful at the regional scale with the seal management areas being the smallest spatial scale (SCOS, 2019). These areas have been denoted through a process of consultation and based on the life history, foraging ecology and genetics of these species.
Results
Grey seal pup production
There has been an increase in total pup production in Scotland since surveys began in the 1960s. The number of pups born on the east coast has increased exponentially. In the north and west increases have also been seen, although pup production has, for the most part, been stable since around 2000 (Figure 3).

Grey seal summer abundance
The grey seal summer counts are limited to two time points, 2008 and 2014 (Figure 4). The number of grey seals in Scotland during this time was higher in 2014 than in 2008. At a regional scale, numbers were stable in two of the management areas, Southwest Scotland and North coast and Orkney. Over the six year period, the abundance had increased by ~16.5%, thus not contravening the relevant assessment value.
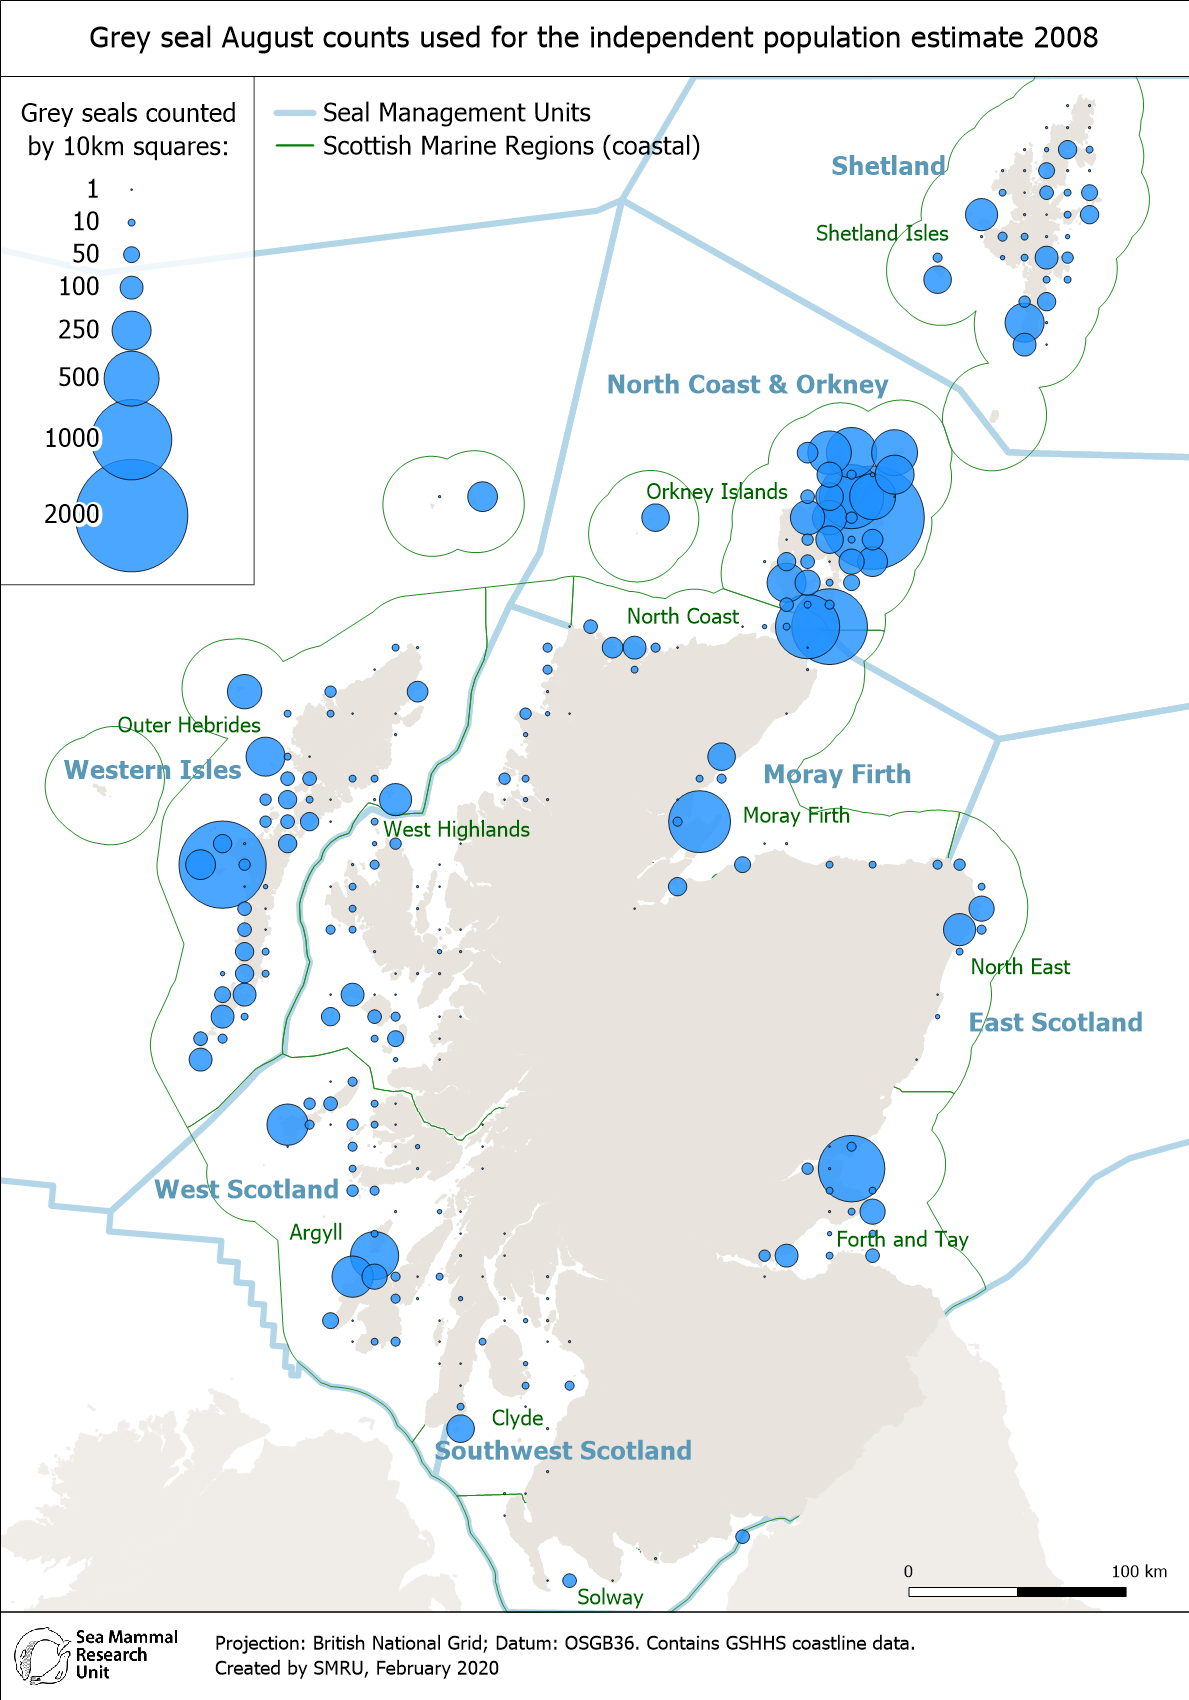
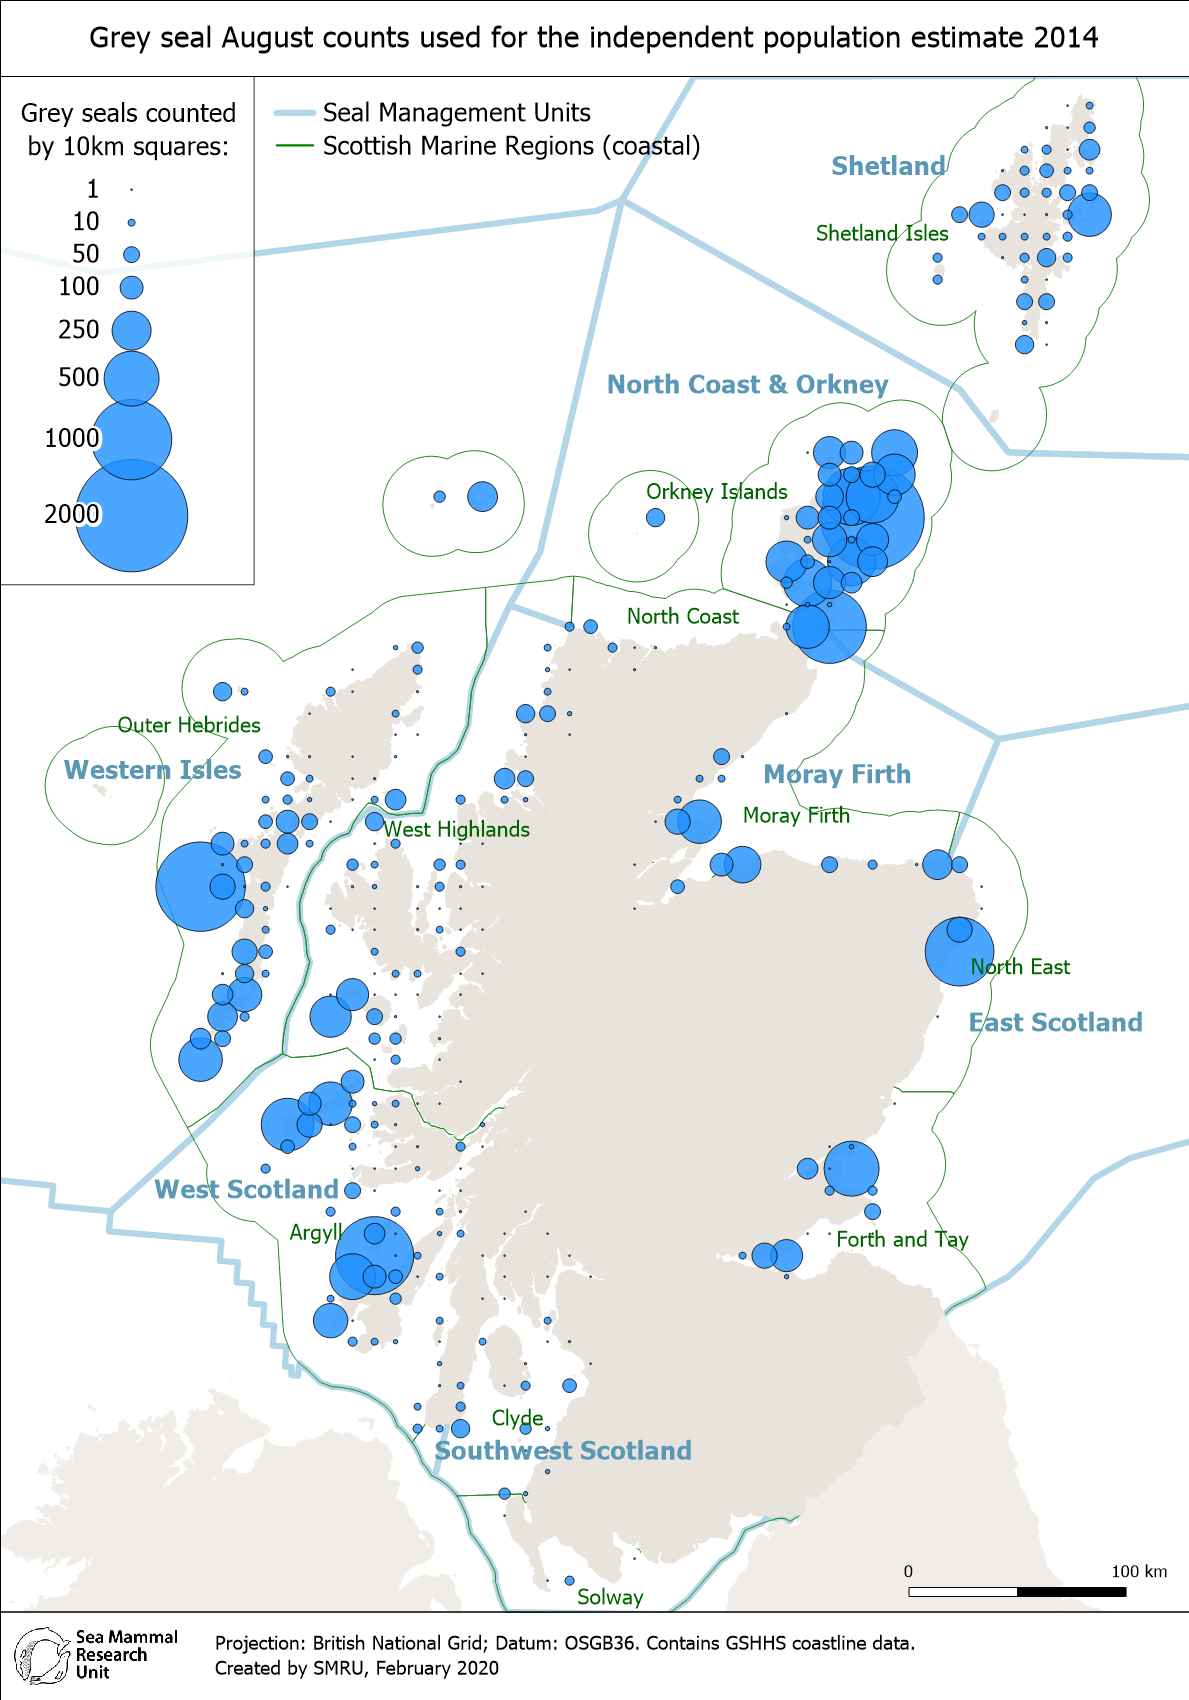
Figure 4: Grey seal summer abundance, 2008 (left) and 2014 (right). Seal management areas (blue lines) and Scottish Marine Regions (green lines) shown. Source: SMRU./p>
Harbour seal abundance during the moult
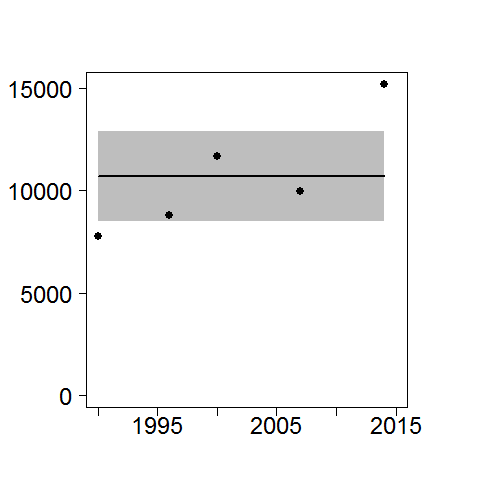
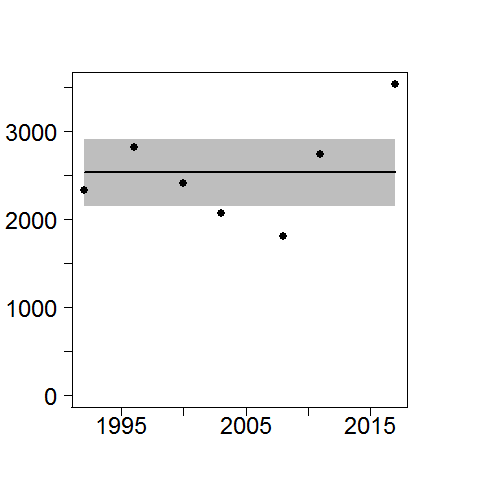
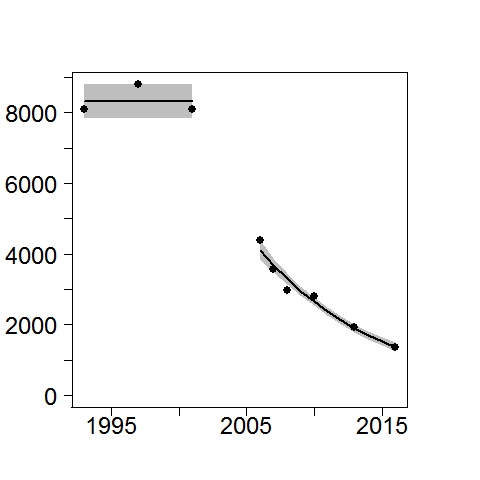
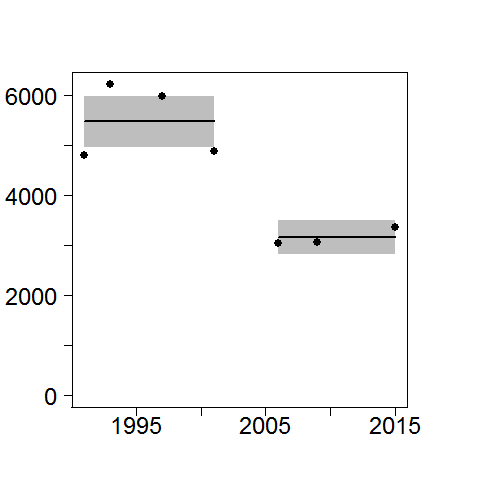
The trends in harbour seal abundance for each management area, across the time series available, is shown in Figure 5. In general, populations have declined in north and east Scotland (for unknown reasons), and trajectories fell below both assessment values for the North coast and Orkney, and East Scotland. Populations are stable on the west coast of Scotland and trajectories did not fall below the assessment values for Southwest Scotland, West Scotland, and the Western Isles. These contrasting trends have resulted in research to investigate the causes of the declines (Arso Civil et al., 2018).
 (a)
|
 (b)
|
 (c)
|
 (d)
|
 (e)
|
 (f)
|
 (g)
|
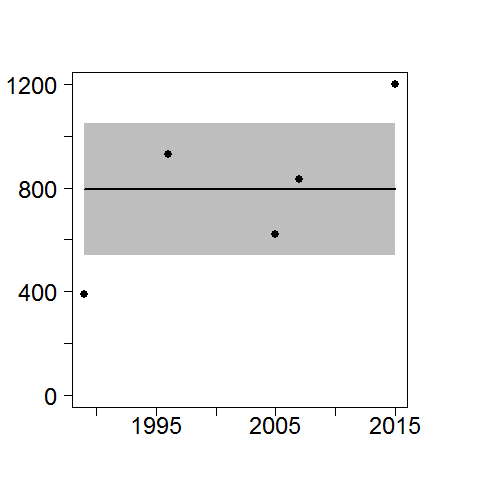
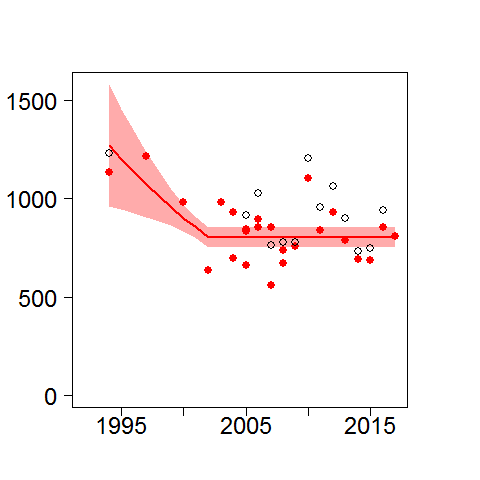
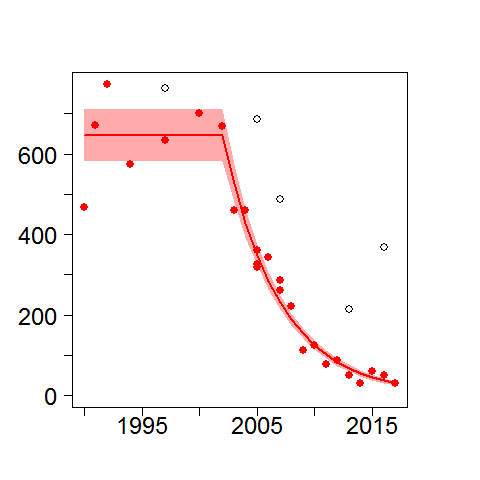
| Figure 5: Harbour seal population trends ((a) Southwest Scotland (b) West Scotland (c) Western Isles (d) Orkney and North coast (e) Shetland (f) Moray Firth (red dots and trend are fitted to the data for Loch Fleet to Findhorn, open circles are Moray Firth) (g) East Scotland (red dots and trend are Firth of Tay and Eden Estuary SAC, open circles are East Scotland). Source: SMRU. |
Grey seal pup production
Details of the most recent trends in pup production are given in SCOS (2019). Since 2011 the number of pups born across Scotland has increased although signs that some areas and colonies had reached their carrying capacity was evident between the early 1990s and the early 2000s with a slower or no increase in estimated production until 2012. In 2012, in all areas where the pup production is estimated entirely from aerial survey counts there was an apparent step change coincident with the transition to a new digital camera system. For logistical and technical reasons, it has not been possible to directly cross calibrate the two methods. However, as the new time series extends it becomes easier to determine the reasons for the differences in estimated production between the two methods and adjust the estimates accordingly. This work is ongoing. Table a shows the pup production by seal management area.
|
YEAR
|
West Scotland
|
Western Isles
|
North Coast and Orkney
|
East Scotland
|
Moray Firth
|
|
1984
|
1,332
|
7,594
|
5,147
|
517
|
94
|
|
1985
|
1,190
|
8,165
|
5,605
|
810
|
No survey
|
|
1986
|
1,711
|
8,455
|
6,202
|
891
|
No survey
|
|
1987
|
2,002
|
8,777
|
6,795
|
865
|
No survey
|
|
1988
|
1,960
|
8,689
|
6,354
|
608
|
No survey
|
|
1989
|
1,956
|
9,275
|
7,439
|
936
|
280
|
|
1990
|
2,032
|
9,801
|
7,648
|
1,122
|
No survey
|
|
1991
|
2,411
|
10,617
|
9,319
|
1,225
|
321
|
|
1992
|
2,816
|
12,215
|
10,466
|
1,251
|
225
|
|
1993
|
2,923
|
11,915
|
11,734
|
1,454
|
No survey
|
|
1994
|
2,719
|
12,054
|
12,551
|
1,325
|
No survey
|
|
1995
|
3,050
|
12,713
|
13,186
|
1,353
|
300
|
|
1996
|
3,117
|
13,176
|
15,257
|
1,567
|
No survey
|
|
1997
|
3,076
|
11,946
|
15,114
|
2,032
|
523
|
|
1998
|
3,087
|
12,434
|
17,274
|
2,241
|
No survey
|
|
1999
|
2,787
|
11,759
|
16,369
|
2,034
|
368
|
|
2000
|
3,223
|
13,472
|
17,216
|
2,514
|
No survey
|
|
2001
|
3,032
|
12,427
|
18,866
|
2,253
|
676
|
|
2002
|
3,096
|
11,248
|
18,627
|
2,509
|
No survey
|
|
2003
|
3,386
|
12,741
|
19,359
|
2,664
|
947
|
|
2004
|
3,385
|
12,319
|
19,684
|
2,706
|
No survey
|
|
2005
|
3,427
|
12,397
|
18,828
|
2,818
|
1,174
|
|
2006
|
3,470
|
11,719
|
19,856
|
2,793
|
1,284
|
|
2007
|
3,118
|
11,342
|
19,687
|
2,957
|
1,201
|
|
2008
|
3,396
|
12,712
|
19,215
|
3,382
|
1,098
|
|
2009
|
No survey
|
12,113
|
19,618
|
4,077
|
1,043
|
|
2010
|
3,391
|
12,846
|
20,780
|
4,300
|
No survey
|
|
2011
|
No survey
|
No survey
|
No survey
|
No survey
|
No survey
|
|
2012
|
4,027
|
14,134
|
23,394
|
5,218
|
1,588
|
|
2013
|
No survey
|
No survey
|
No survey
|
No survey
|
No survey
|
|
2014
|
4,054
|
14,331
|
24,354
|
5,860
|
1,665
|
|
2015
|
No survey
|
No survey
|
No survey
|
No survey
|
No survey
|
|
2016
|
4,541
|
15,732
|
24,489
|
6,426
|
1,959
|
Grey seal summer abundance
Grey seals in Scottish waters during the summer have increased, although only two robust datapoints are available. The increase suggests that, despite some redistribution of seals during the summer to the southern North Sea and increased foraging in that area (SCOS, 2019), animals are still foraging successfully in Scottish waters. However, numbers of animals using haul-out sites in the north (Shetland and Orkney) has not increased. The biggest increase has been in the West Scotland management area (Table b).
|
Seal Management Area
|
Year
|
Difference
|
||
|
2008
|
2014
|
|||
|
1
|
Southwest Scotland
|
374
|
374
|
0
|
|
2
|
West Scotland
|
2,399
|
5,064
|
2,665
|
|
3
|
Western Isles
|
3,808
|
4,065
|
257
|
|
4
|
North Coast and Orkney
|
8,525
|
8,106
|
-419
|
|
5
|
Shetland
|
1,536
|
1,558
|
22
|
|
6
|
Moray Firth
|
1,040
|
1,253
|
214
|
|
7
|
East Scotland
|
1,630
|
2,111
|
418
|
|
|
Total
|
19,312
|
22,531
|
3,219
|
Harbour seal abundance during the moult
All the details of the results are given in Thompson et al. (2019). The quantitative changes are summarised in Table c. The trend and the number of years of data contributing are given in Table d (from Thompson et al., 2019).
|
Seal management area
|
Current trend
|
Change since 2011
|
Management measure
|
Confidence
|
|
East Scotland
|
Decline - 2000-2017 decline in SAC 18.6% per annum.
|
None, continued decline (95% over 15 year period).
|
Conservation area designation, no licences to shoot seals issued.
|
High
|
|
Moray Firth
|
Decline (-28%) between 2000 and 2003, stable thereafter at lower abundance than pre-2000.
|
None
|
Conservation area designation, no licences to shoot seals issued.
|
High
|
|
Orkney and North Coast
|
Decline - 2001-2006 decline (-46%) and between 2006-2016 decline 10.4% per annum.
|
None
|
Conservation area designation, no licences to shoot seals issued.
|
High
|
|
Shetland
|
Decline - 2001-2005 decline (-40%), 2006-2015 stable thereafter at lower abundance than pre-2001.
|
None
|
Conservation area designation, no licences to shoot seals issued.
|
High
|
|
West Scotland, Southwest Scotland and Western Isles
|
All stable over time period
|
None
|
Licences required to shoot seals.
|
High
|
|
Seal management area
|
Area or sub-area surveyed
|
Years (n)
|
First trend
|
Second trend
|
|
Years trend % (95% C.I.)
|
Years trend % (95% C.I.)
|
|||
|
East Scotland
|
Firth of Tay and Eden Estuary SAC
|
22 (25)
|
1990-2002: constant
|
2002-2017: -18.58 (17.25, 19.88)
|
|
Moray Firth
|
Loch Fleet to Findhorn
|
19 (25)
|
1994-2002: -5.55 (2.47, 8.53)
|
2002-2017: constant
|
|
Moray Firth
|
Dornoch Firth and Morrich More SAC
|
20 (26)
|
1992-2017: -8.00 (6.30, 9.66)
|
---
|
|
North Coast and Orkney
|
Complete area survey
|
9
|
1993-2001: constant
|
2006-2016: ‑10.41 (9.29,11.52)
|
|
Sanday SAC
|
11
|
1993-2001: constant
|
2006-2016: -17.75 (13.29,21.99)
|
|
|
Shetland
|
Complete area survey
|
7
|
1991-2001: constant
|
2006-2015: constant
|
|
Mousa SAC
|
7
|
1991-2015: -11.13 (8.69,13.5)
|
---
|
|
|
Yell Sound Coast SAC
|
7
|
1991-2015: constant
|
---
|
|
|
Western Isles
|
Complete area survey
|
7
|
1992-2017: constant
|
---
|
|
West Scotland
|
Complete area survey
|
5
|
1990-2014: constant
|
---
|
|
West Scotland; North
|
Complete area survey
|
6
|
1991-2017: +4.86 (4.02, 5.70)
|
---
|
|
West Scotland; Central
|
Complete area survey
|
6
|
1989-2014: +4.02 (3.08, 4.97)
|
---
|
|
Ascrib, Isay and Dunvegan SAC
|
11
|
1990-2017: constant
|
---
|
|
|
West Scotland; South
|
Complete area survey
|
5
|
1990-2014: constant
|
---
|
|
Eileanan agus Sgeiran Lios mor SAC
|
9
|
1990-2014: constant
|
---
|
|
|
South-East Islay Skerries SAC
|
6
|
1990-2015: constant
|
---
|
|
|
Southwest Scotland
|
Complete area survey
|
5
|
1989-2015: constant
|
---
|
Populations along the east coast and in the Northern Isles have declined since the start of the surveys (although Shetland and the Moray Firth have now stabilised, they are not currently increasing). In all these areas the population size is at least 40% below the pre- 2002 level (Thompson et al., 2019).
The trend analyses revealed populations in the west are stable though there is some indication of a recent increase in West Scotland and the Western Isles. Further surveys in future will determine if this is the start of an upward trajectory.
The trends are calculated based on the changes in trajectories before and after an obvious change point in the counts (2002), a year in which a second epidemic of phocine distemper virus (PDV) was observed. However, results of the response to the outbreak suggest disease mortality rates in Scotland were low (Hall, Jepson, Goodman, & Harkonen, 2006) and the continued and sustained regional declines are not attributable to continued circulating infection. The regional declines cannot be explained by emigration. Additional studies into the likely causes are ongoing (Arso Civil et al., 2018).
Conclusion
Harbour seals
Harbour seals on the west coast are stable in abundance, although the most recent surveys indicate an increase. This will be confirmed when the next complete round of harbour seal survey data for Scotland are available. However, harbour seals foraging (i.e. feeding) and breeding on the North Sea coast and in the Northern Isles are generally not reaching the assessment values and are declining in abundance. Confidence in these conclusions is high. The long time series and extensive coverage of the surveys allow for robust trends and conclusions to be drawn. The types of pressures on harbour seals have not changed since the last assessment. Although there has been an increase in marine renewable energy developments, the population declines occurred before the start of these activities. Other pressures of concern remain; effects of toxins from harmful algal blooms and changes in prey or habitat as a result of human activities such as fisheries or climate change.
Grey seals
Grey seals in Scotland, both the number of pups born and the number of animals foraging in Scottish waters during the summer, have continued to increase and are above the assessment values.
Grey seal pup production
There has been a change in the method for counting seal pups, moving to digital photography. This coincided with a ‘jump’ in the pup counts. SMRU are currently investigating how much the change in method has contributed to the increase in estimated pup production so that they can be adjusted in future. However, this change does not affect the conclusions that are drawn from these data. The long length of the time series means that robust conclusions can be made from the overall pup production trajectories.
Grey seal summer abundance
There are only two robust grey seal summer abundance estimates and because these are highly mobile species, assessing them on a regional scale is potentially prone to some bias as animals forage widely. However, it is very rare for grey seals from the east and north coast to move to the west (Russell et al., 2013) so at that scale the summer counts are likely to be robust. Although data are reported here at the level of seal management area, it would not be recommended that these be used as indicators in isolation.
Harbour seal abundance during the moult
There has been no change in the method since the last assessment. There is the possibility that the declines in abundance of harbour seals in some areas is due to cumulative pressures but until the main drivers of change have been identified, it is not possible to say how they may be impacting this species.
The scale of the assessment is Scotland wide and at the level of seal management areas as determined in relation to the management of seals under the Marine (Scotland) Act, 2010. These were agreed upon in conjunction with SNH, Marine Scotland and JNCC and relate to the ecology and life history of the species as well as their genetic population structure. The spatial extent of many are also in line with the Scottish marine regions and although these are mobile species, where the boundaries coincide, these population trend assessments could be used by the Marine Planning Partnerships in their regional planning. A good example is the Shetland Islands Marine Spatial Plan.
Knowledge gaps
The main knowledge gap is a lack of understanding of the drivers of the decline in harbour seal populations. However, a long term research study is due to be completed in the next few years. This will estimate vital rates in declining and stable populations so that the factors involved can be narrowed down. For grey seal pups, some small colonies are not regularly counted and uncertainty in the estimates could be reduced. In addition, other more appropriate indicators would include at-sea usage and habitat preference. However, this involves more detailed knowledge of foraging and movements and research is continuing.
Some pressure data for seals are being collected through dedicated research projects (for example, the effects of noise and collision risks from marine renewable developments). However, other pressures, for example, exposure to persistent organic pollutants (POPs), which was a priority, now relies on ad hoc funding and no data for harbour seals has been collected since 2003 (when very high levels were found in some populations from south-west Scotland). With the risk of a phocine distemper virus (PDV) outbreak increasing with time and the immunosuppressive effects of POPs being now much better understood, this would seem to be an important knowledge gap for assessing current risks.
Competition between harbour and grey seals is also a possible explanation for the decline in harbour seal abundance. Comparative and contemporary data on the movement and interactions between sympatric species is needed, in areas of decline and stability.
Whilst the harbour seal surveys are generally sufficient for the assessment (and in those areas where annual surveys are carried out trends are very reliable), many areas have only sparse temporal coverage. The costs of thermal image surveys using helicopters continues to increase and other methods (such as drones) are being investigated, however, it will be some time before they have the capacity and endurance to be used. More regular surveys in many areas, particularly the West of Scotland (for example there was a gap of 5 years before the decline in Orkney was detected so when it started within that period is not known) is needed to reduce the uncertainty.
Information on the distribution and availability of seal prey is a major knowledge gap. Seals feed on many non-commercial species and in areas that are not regularly surveyed by fisheries biologists. Inshore fish distribution, at the spatial scale relevant to seal foraging areas, is urgently needed.
Status and trend assessment
Seal Management Areas (SMAs) are written in bold, Scottish Marine Regions (SMRs) between parenthesis. Refer to Figure b in Assessment method section for correspondence between SMAs and SMRs.
|
Region assessed |
Harbour seals |
Grey seals |
||
|---|---|---|---|---|
|
Status with confidence |
Trend with confidence |
Status with confidence |
Trend with confidence |
|
| All Scotland |
 |
|
 |
|
|
East Scotland
(Forth and Tay and North East)
|
 |
|
|
|
|
Moray Firth
(Moray Firth)
|
|
|
|
|
|
North Coast and Orkney
(North Coast and Orkney Islands)
|
 |
|
|
|
|
Shetland
(Shetland Isles)
|
|
|
|
|
|
Southwest Scotland
(Clyde and Solway)
|
|
|
|
|
|
West Scotland North and Central
(Western Highlands)
|
|
|
|
|
|
West Scotland South
(Argyll)
|
|
|
|
|
|
Western Isles
(Outer Hebrides)
|
|
|
|
|
This Legend block contains the key for the status and trend assessment, the confidence assessment and the assessment regions (SMRs and OMRs or other regions used). More information on the various regions used in SMA2020 is available on the Assessment processes and methods page.
Status and trend assessment
|
Status assessment
(for Clean and safe, Healthy and biologically diverse assessments)
|
Trend assessment
(for Clean and safe, Healthy and biologically diverse and Productive assessments)
|
||
|---|---|---|---|
| |
Many concerns |
No / little change |
|
| |
Some concerns |
Increasing |
|
| |
Few or no concerns |
Decreasing |
|
 |
Few or no concerns, but some local concerns |
No trend discernible |
|
 |
Few or no concerns, but many local concerns |
All trends | |
 |
Some concerns, but many local concerns |
||
 |
Lack of evidence / robust assessment criteria |
||
| Lack of regional evidence / robust assessment criteria, but no or few concerns for some local areas | |||
 |
Lack of regional evidence / robust assessment criteria, but some concerns for some local areas | ||
| Lack of regional evidence / robust assessment criteria, but many concerns for some local areas | |||
Confidence assessment
|
Symbol |
Confidence rating |
|---|---|
|
Low |
|
|
Medium |
|
|
High |

Assessment regions
 and the Scottish Offshore Marine Regions (OMRs, O1 – O10)")
Key: S1, Forth and Tay; S2, North East; S3, Moray Firth; S4 Orkney Islands, S5, Shetland Isles; S6, North Coast; S7, West Highlands; S8, Outer Hebrides; S9, Argyll; S10, Clyde; S11, Solway; O1, Long Forties, O2, Fladen and Moray Firth Offshore; O3, East Shetland Shelf; O4, North and West Shetland Shelf; O5, Faroe-Shetland Channel; O6, North Scotland Shelf; O7, Hebrides Shelf; O8, Bailey; O9, Rockall; O10, Hatton.
 Regions. These have been used as the assessment areas for hazardous substances.")
, Regions.")