What, why and where?
Dredging is needed to maintain the water depth required keep ports operating and this results in waste which must be disposed. Dredging and the deposit of dredged material at licensed disposal sites takes place all round the coast. Dredging is split into 2 main types:
- maintenance (or navigational) dredging, which is routine dredging to previously charted depths and where dredging has occurred in the last 7 years.
- capital dredging is dredging to a new depth, such as to allow for larger vessels in a harbour or in the creation of a new harbour, or in areas where dredging has not occurred in the last 7 years.
Generally licences are for larger amounts than required to allow for flexibility in dredge campaigns. Dredging activity is expensive so ports will not dredge more than they have to, but often apply for more tonnage than they need in order to avoid paying for a second application fee. All deposit activity is subject to a marine licence from Marine Scotland under the Marine (Scotland) Act 2010.
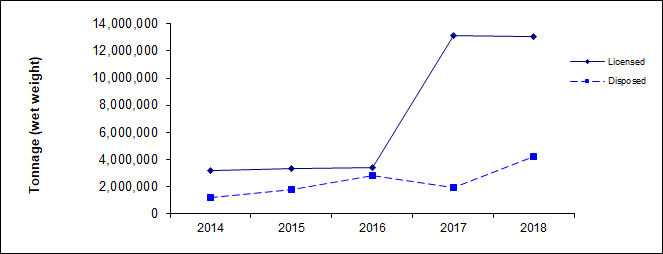
During 2018 a total of 4,191,664 tonnes was dredged and deposited of a total of 13,084,316 tonnes that could be allowed under licence. The amount deposited in 2018 increased due to an increase in the number of capital dredging projects (Figure 1).
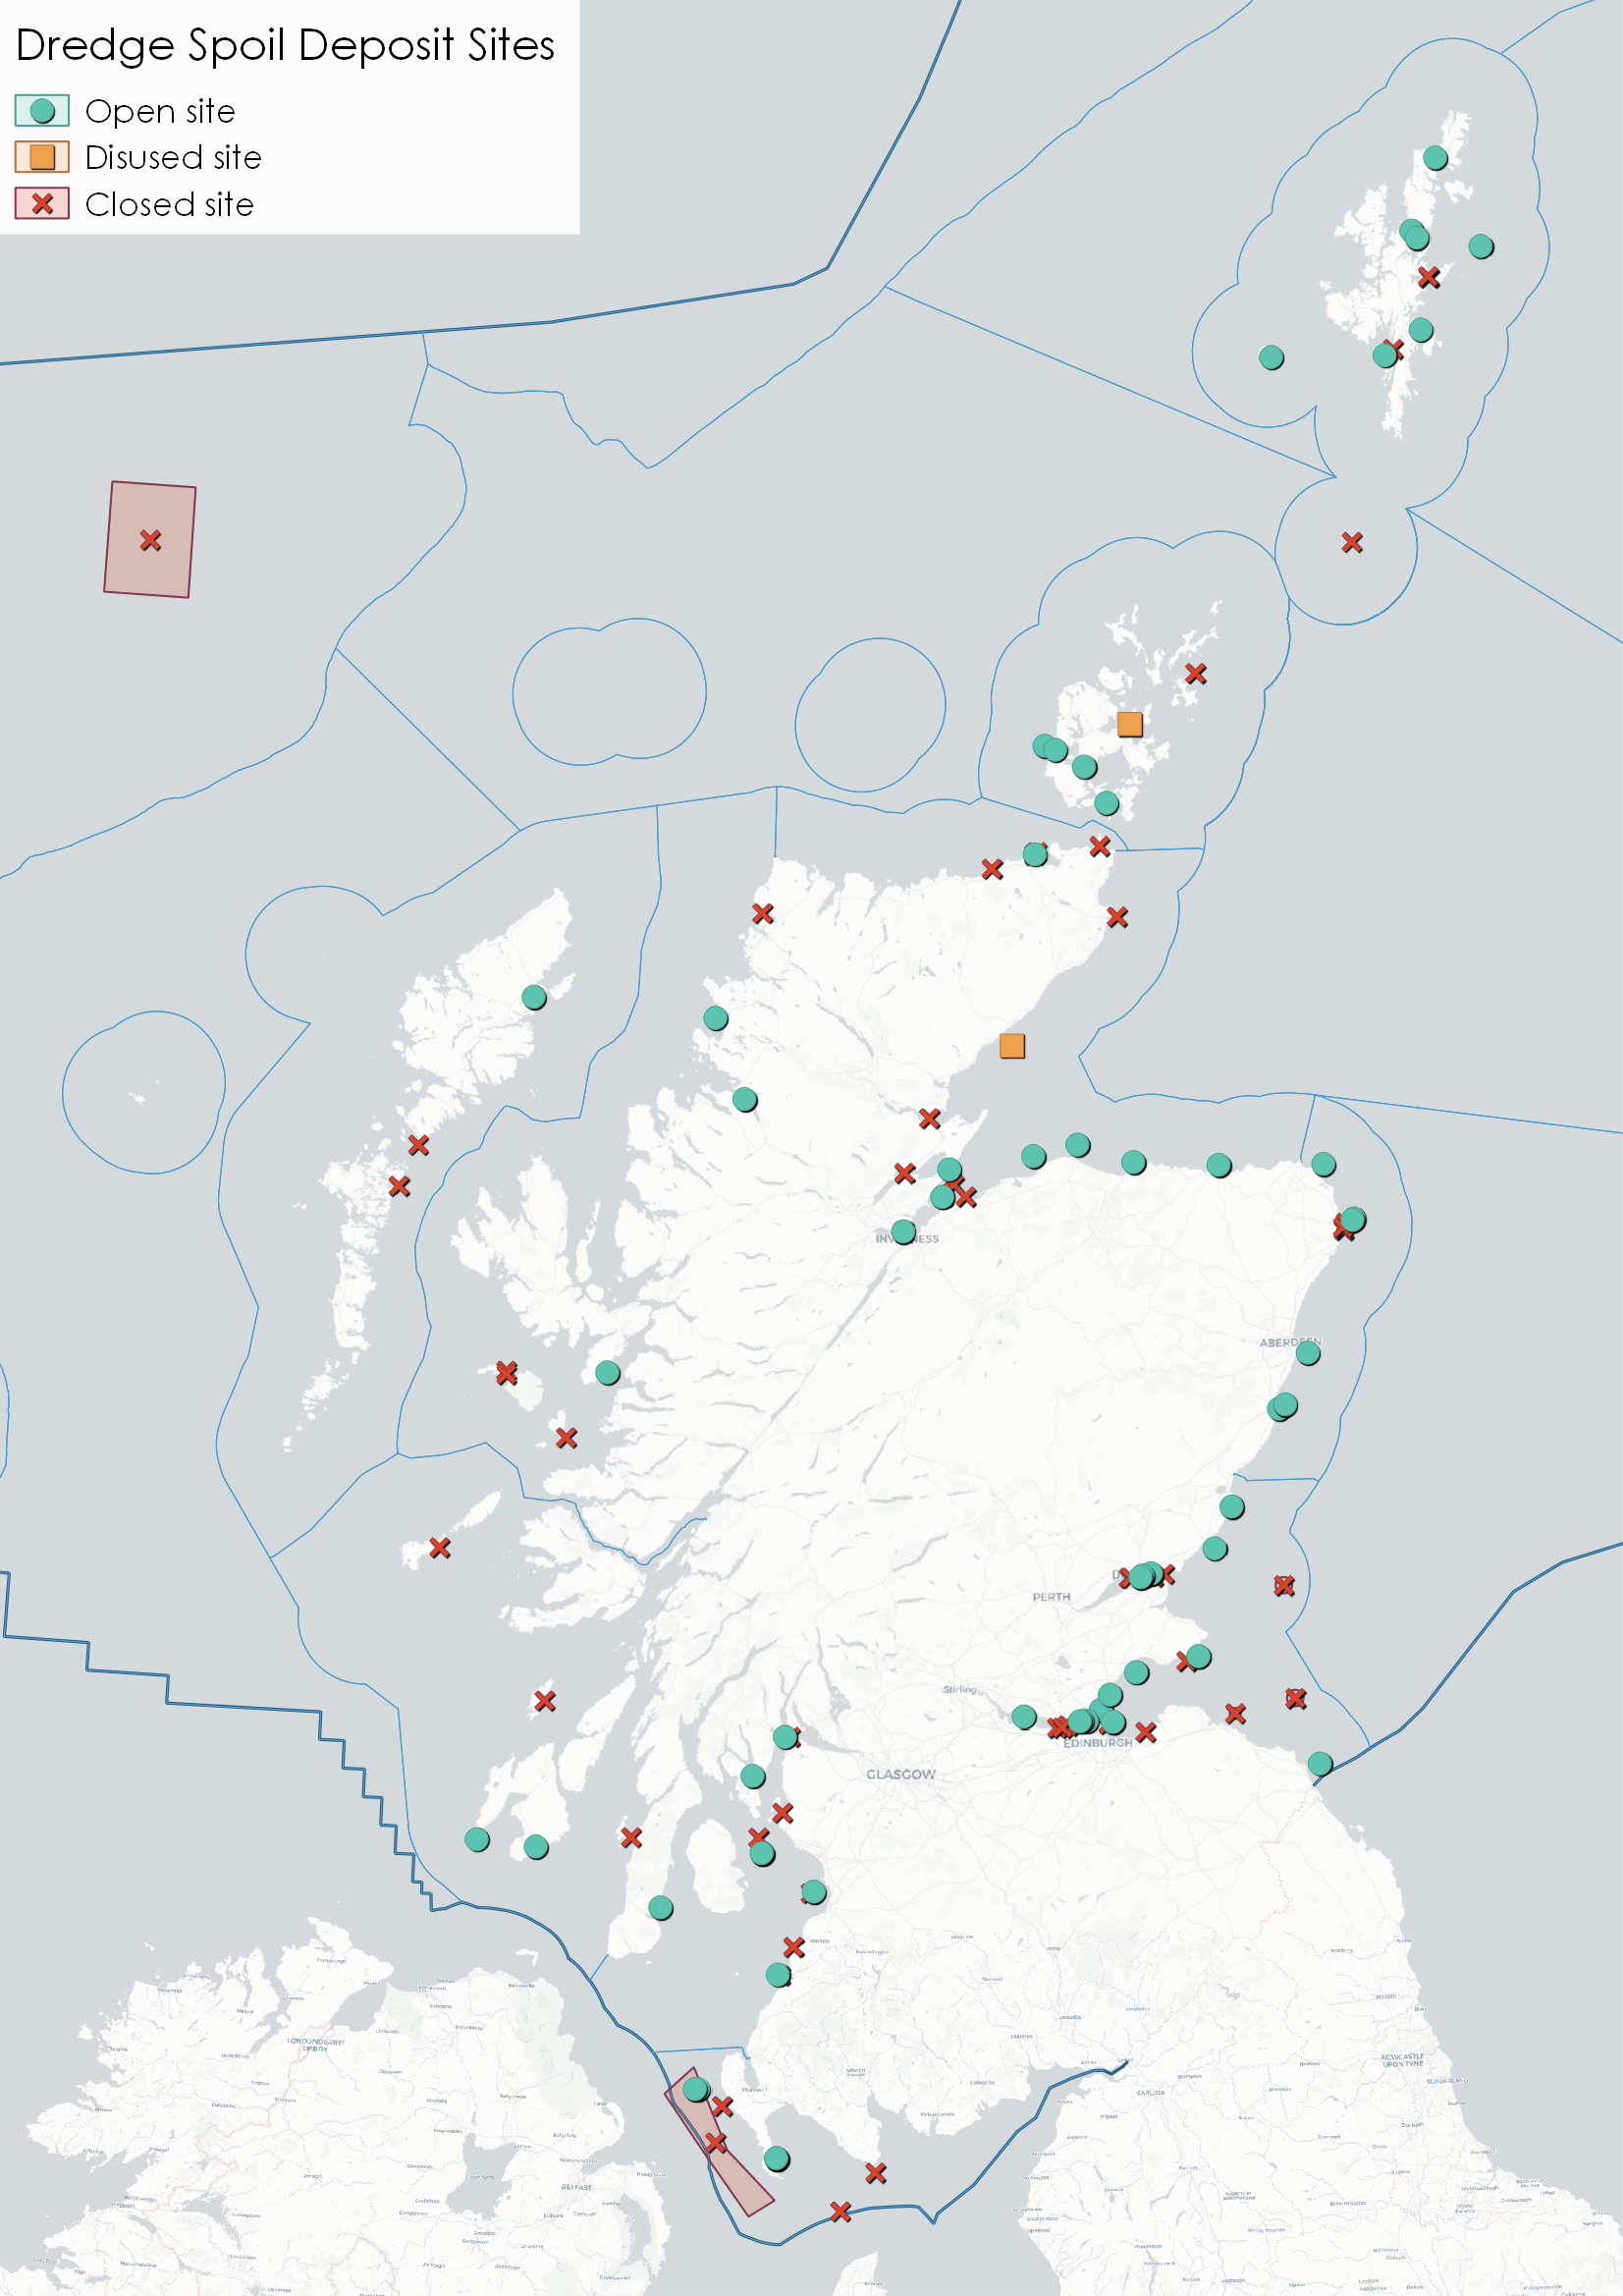
There are 63 open sites (Figure 2) either routinely used for deposit or used less routinely for operations such as beach nourishment operations. A further 57 sites are either closed (not having been used for at least 10 years) or disused (not having been used for at least five years).
Dredged material must be assessed for chemical contaminants before it can be considered for deposit elsewhere at sea.
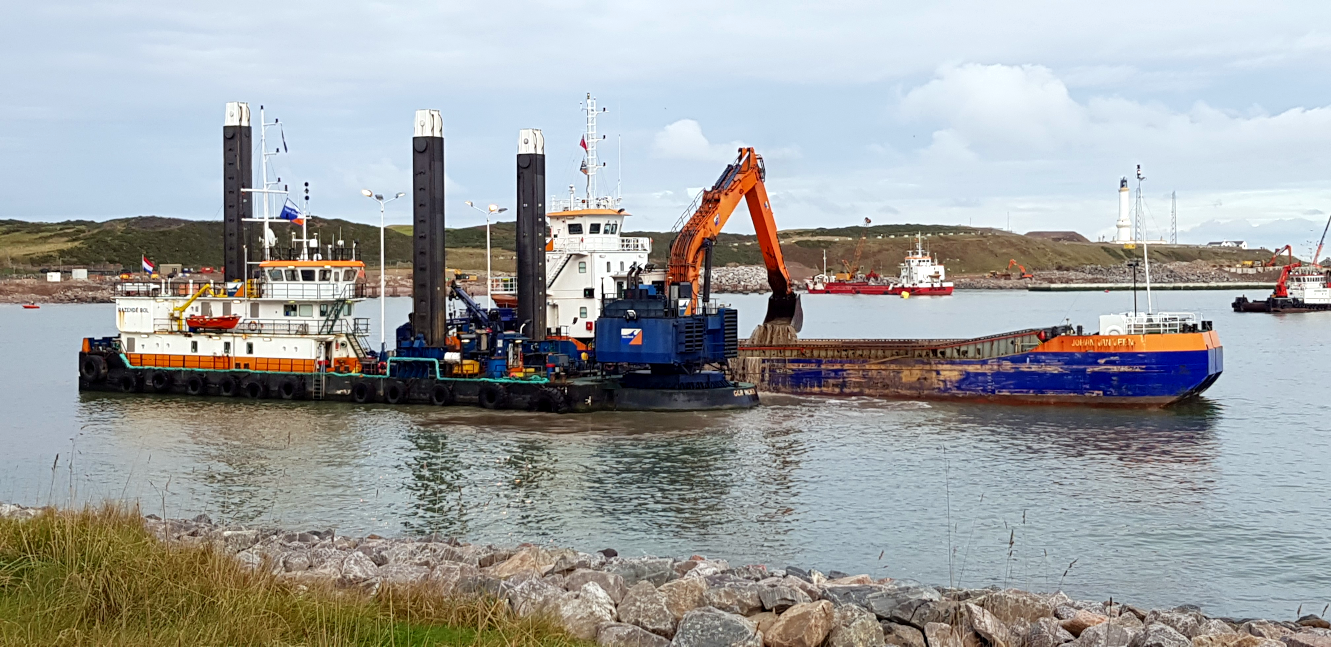
Since the 1980s deposit at sea of radioactive wastes (stopped in 1982), industrial wastes (1992), colliery minestone (1995) and sewage sludge (1998) has been progressively reduced, and is now prohibited. Only the deposit of dredged material from ports, harbours and marinas (Figure a) is presently allowed. This activity is essential to maintain navigation in ports and harbours as well as for the development of new port facilities.
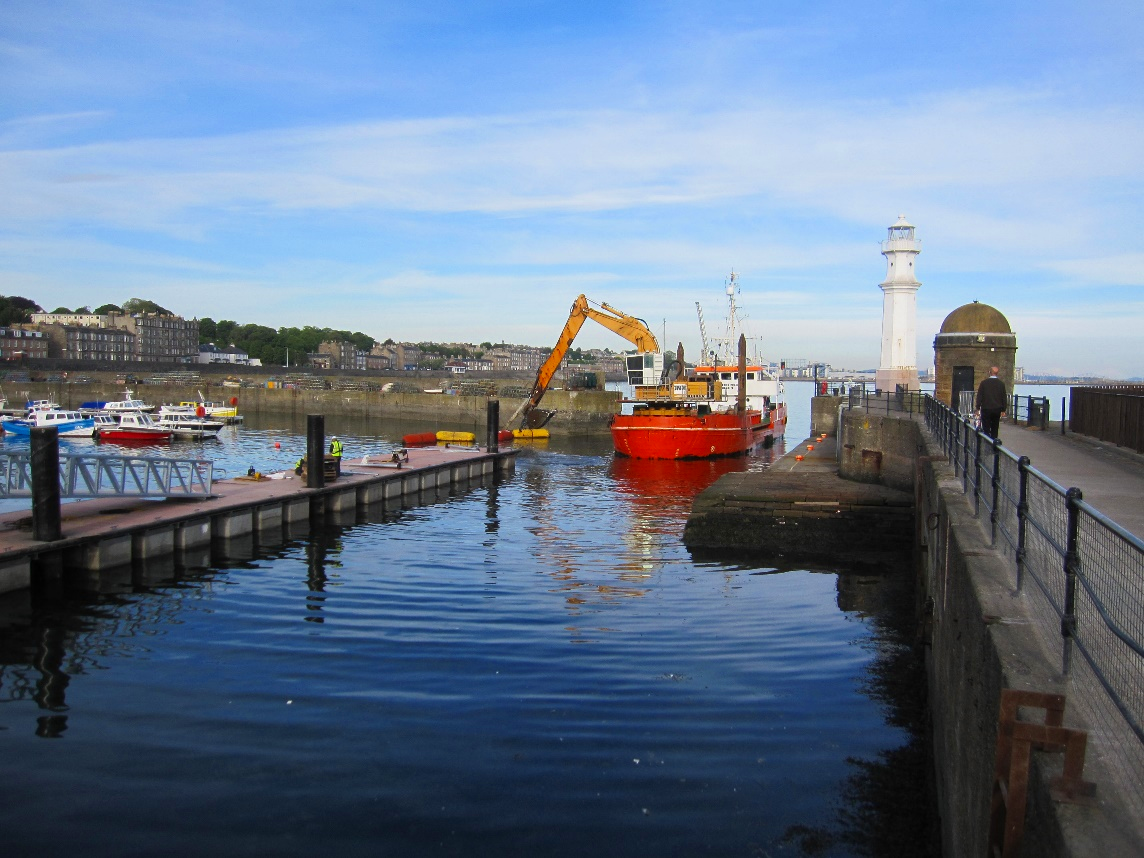
The aim is to minimise seabed deposit and seek alternative, beneficial use by conducting a Best Practicable Environmental Option (BPEO) assessment and considering practicable alternative options before granting a licence. Dredged material may be re-used for land reclamation, for example beneficial use of aggregates at the south harbour expansion in Aberdeen or beach nourishment where it is uncontaminated and physically suitable.
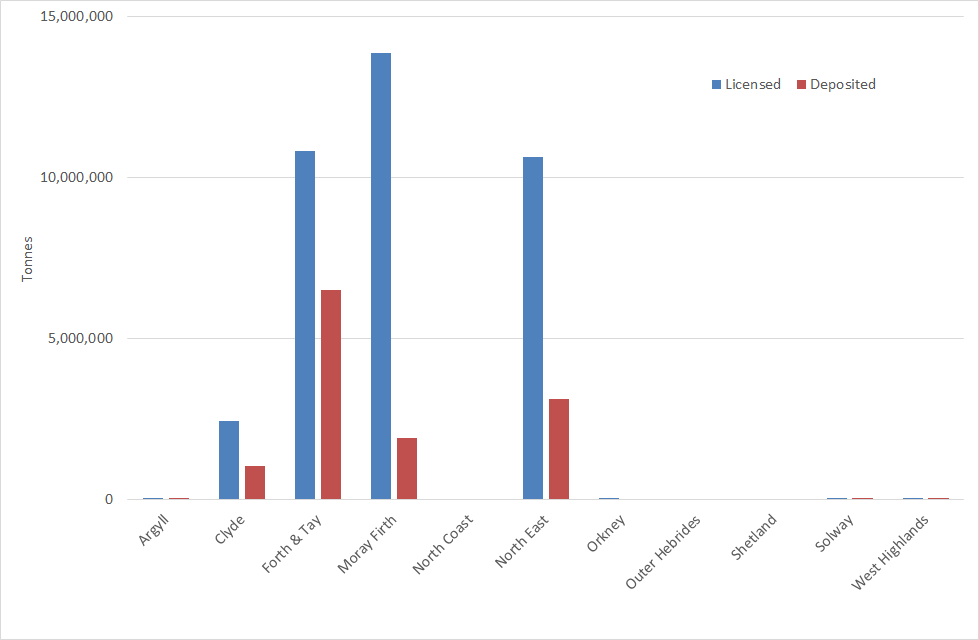
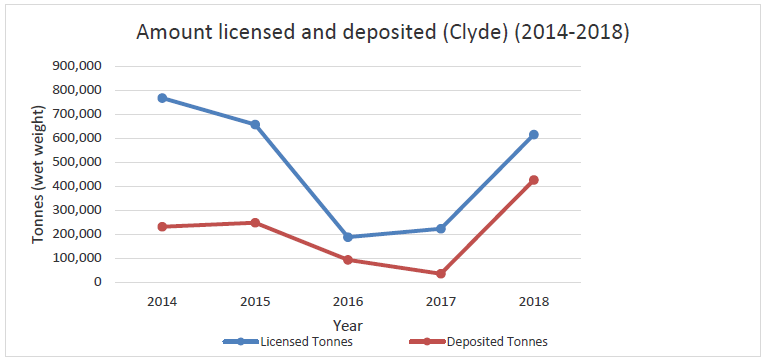
Most deposit occurs in the sea areas adjacent to the highest densities of human population and industry. Tonnages deposited are recorded by Marine Scotland and reported to OSPAR (Oslo Paris Convention) for international collation. Figure b identifies the spread of disposal amongst the Scottish Marine Regions (SMRs) for the period 2014-2018; Clyde (Figure c); Forth & Tay (Figure d); Moray Firth (Figure e); and the North East (Figure f) regions have the largest volumes. Figures for all SMRs are available on Marine Scotland Information Waste Disposal (Dredge Spoil Deposit) page. The amount of dredge spoil deposited at sea for a particular port will change. Harbours only undertake navigational / maintenance dredging when necessary to maintain a depth, which may not be every year. Capital dredging is associated with new harbour developments which by their nature are dictated by market forces.
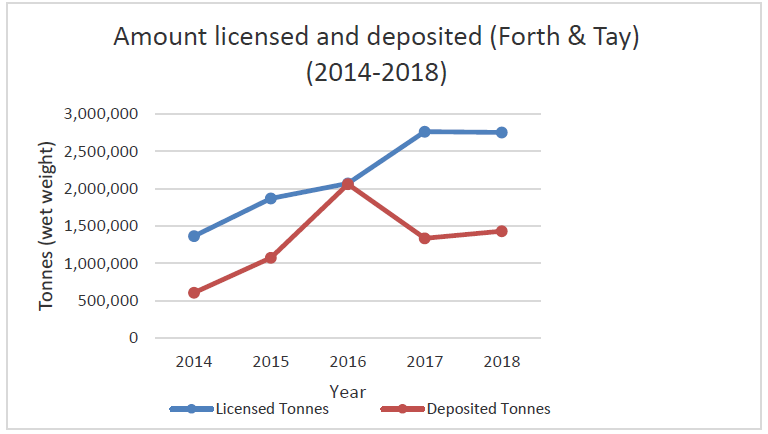
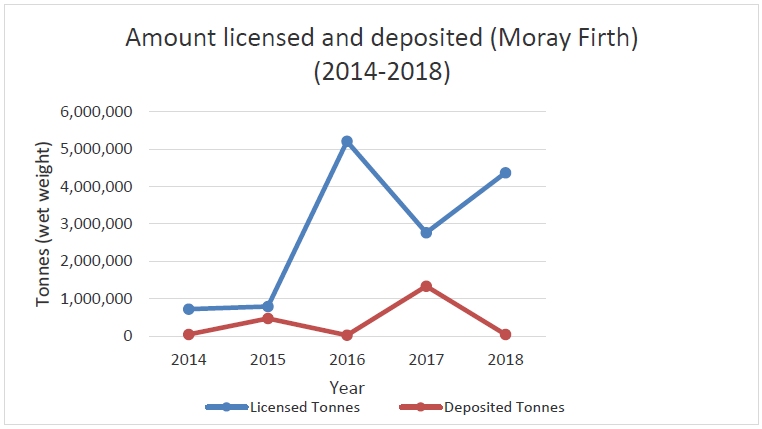
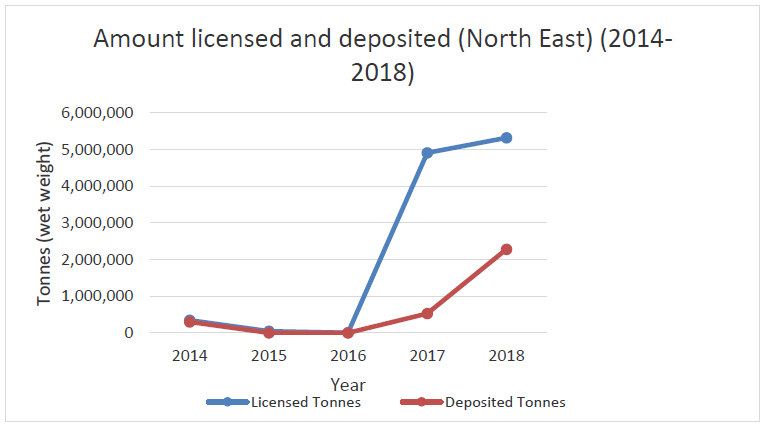
Sea deposit sites are selected based on a number of criteria including their location in relation to amenities and other uses of the sea in the area, economic and operational feasibility and physical, chemical and biological characteristics. A summary of sites currently or previously used for depositing dredged material is shown in table a. The closed offshore site in Bailey was only used for fish waste, but as discards are banned and industry best practice recommends against depositing things like scallop shells, it is no longer used.
|
Scottish Marine Region (SMR) or Offshore Marine Region (OMR)
|
Closed
|
Disused
|
Open
|
Total
|
|
SMR
|
|
|
|
|
|
Solway
|
4
|
|
6
|
10
|
|
Clyde
|
6
|
|
7
|
13
|
|
Argyll
|
3
|
|
2
|
5
|
|
West Highlands
|
4
|
|
3
|
7
|
|
Outer Hebrides
|
2
|
|
1
|
3
|
|
North Coast
|
4
|
|
1
|
5
|
|
Orkney Islands
|
1
|
1
|
4
|
6
|
|
Shetland Isles
|
4
|
|
7
|
11
|
|
Moray Firth
|
8
|
1
|
8
|
17
|
|
North East
|
4
|
|
6
|
10
|
|
Forth and Tay
|
14
|
|
18
|
32
|
|
OMR
|
|
|
|
|
|
Bailey
|
1
|
|
|
1
|
|
Total
|
55
|
2
|
63
|
120
|
Biologically inert or natural materials may also be considered for deposit. Fish waste (from land based processing) is sometimes disposed but this has not occurred in the period 2005- 2018.
Dredged material is assessed for contaminants before deposit to reduce environmental impacts. In general, dredged material with contaminant levels below a certain threshold can be disposed of at sea. Above this, but below a higher threshold, may require further consideration and testing before a decision can be made, whilst above the higher threshold there is a presumption against deposit at sea.
Contribution to the economy
Dredging is an essential activity to keep ports and harbours open and it is therefore economically important.
It is not possible to isolate the Gross Value Added (GVA) and number of jobs associated with dredge spoil deposit. Dredging is included in the construction of water projects industry as it is too small to be assessed separately. However, it is clear that without dredging, supported by deposit at sea, access to ports and harbours would either be limited or face costly alternative means of disposal, which could affect the maritime transport sector’s contribution to the economy.
Dredged material can also save costs, for example when suitable material is used to assist with construction projects, such as the use in 2017 of navigational dredging for Aberdeen port expansion, or to replenish sand on beaches providing coastal protection and supporting recreational uses of the coastline, thus enhancing economic performance.
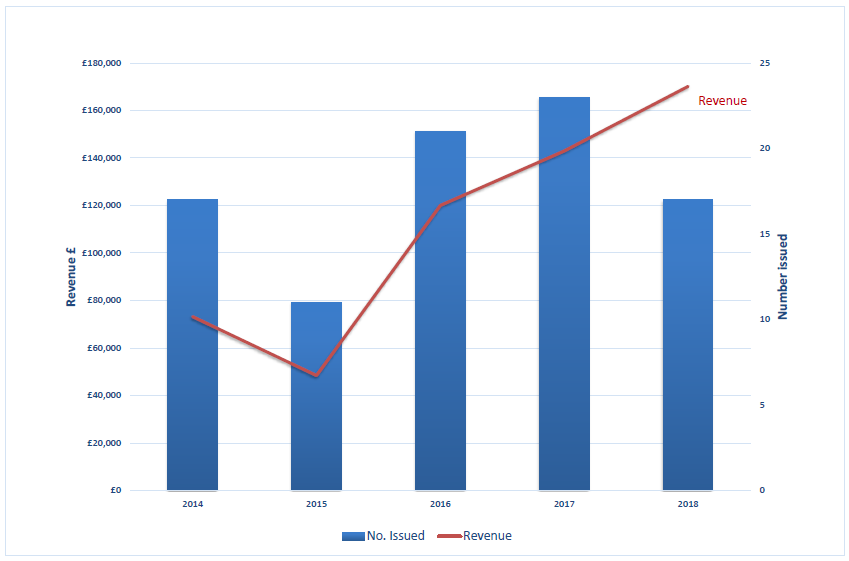
From 2014-2018, 89 licences were issued for the deposit of dredged material at sea. These were mainly for ports and generated a total licence revenue of £554,820 (Figure 4). The increase in income since 2016 is explained by increases in the amounts of dredged material licensed to be deposited at sea.
The tonnage licensed for disposal that is actually disposed of is provided by Scottish Marine Region (SMR) and provides an indication of the change in activity. While the arrow is determined by the change in actual dredged tonnage between 2014 and 2018, the values are sporadic and there are instances where there was zero dredge disposed in 2014 and 2018, with a consequent ‘no change’ arrow, which may mask activity between the beginning and end point. Figures c to f are therefore more informative than just the direction of travel arrow.
Table 2: Change in deposited tonnage, 2014-2018. Source: Marine Scotland.
|
Change in deposited tonnage
2014 to 2018
|
|
|||
|
Scottish Marine Region (SMR)
|
Change (tonnes)
|
%
|
|
|
|
Argyll
|
0
|
0%
|
↔
|
|
|
Clyde
|
194,784
|
84%
|
↑
|
|
|
Forth and Tay
|
825,865
|
136%
|
↑
|
|
|
Moray Firth
|
-400
|
-1%
|
↔
|
|
|
North Coast
|
0
|
0%
|
↔
|
|
|
North East
|
1,981,302
|
659%
|
↑
|
|
|
Orkney Islands
|
0
|
0%
|
↔
|
|
|
Outer Hebrides
|
0
|
0%
|
↔
|
|
|
Shetland Isles
|
0
|
0%
|
↔
|
|
|
Solway
|
6,445
|
N/A
|
↑
|
|
|
West Highlands
|
-820
|
-100%
|
↓
|
|
As an example of the sporadic nature of the tonnage dredged, between 2014 and 2018, Moray Firth decreased from 46 thousand tonnes to 45 thousand tonnes (1% decrease). This however misses the 1.3 million tonnes in 2017 and 470 thousand tonnes in 2015.
Examples of socio-economic effects
- Employment.
- Disposal allows industries/ports to function, alternative would be higher cost land disposal.
- Suitable dredged material can be used for construction projects including beach replenishment/ nourishment.
- Possible obstruction on seabed for other seabed users.
- Possible short-term sediment plumes could affect users requiring high water quality.
Pressures on the environment
An OSPAR agreed list of marine pressures is used to help assessments of human activities in the marine environment. The marine pressure list has been adapted for use in Scotland via work on the Feature Activity Sensitivity Tool (FeAST). Waste disposal – dredge material activities can be associated with 21 marine pressures – please read the pressure descriptions and benchmarks for further detail.
The list of marine pressures is used to help standardise assessments of activities on the marine environment, and is adapted from an agreed list prepared by OSPAR Intercessional Correspondence Group on Cumulative Effects (ICG-C) (see OSPAR 2014-02 ‘OSPAR Joint Assessment and Monitoring Programme (JAMP) 2014-2021’ Update 2018’ (Table II).
The Feature Activity Sensitivity Tool (FeAST) uses the marine pressure list to allow users to investigate the sensitivity of Scottish marine features. It also associates all pressures that might be exerted by a defined list of activities at a particular benchmark. The extent and impact of each pressure from a given activity will vary according to its intensity or frequency. The extent and impact of the pressure will also vary depending on the sensitivity of the habitat or species on which it is acting. The existence of multiple activities, and potentially multiple pressures, at specific locations will result in a cumulative impact on the environment.
FeAST is a developing tool. A snap shot from 2019 was used for the development of SMA2020. Please consult the FeAST webpage for further information and up to date information.
The list of pressures below associated with this activity is given in alphabetical order. Clicking the pressure will give you more information on the pressure and examples of how it may be associated with the activity.
Forward look
Dredging and deposit will continue to be undertaken to maintain existing shipping channels and to improve, develop and protect the coastline. National Planning Framework 3 (Scottish Government, 2014) identifies future port-related developments to provide facilities for the renewable energy sector, for example. Associated dredging may be required.
Dredged material is increasingly being seen as a resource rather than unwanted excess sediment. Stakeholders are starting to explore using sediment for beneficial uses such as beach nourishment, habitat creation and land reclamation. This may result in lower amounts of dredged material being deposited at sea.
One example of using dredge material as a resource is Montrose Port Authority’s most recent dredge deposit licence. This included trials of depositing in Montrose Bay to try and provide nourishment to the local beach which is currently undergoing rapid erosion.
New dredging to re-open old ports or further develop existing ports could result in an increase in the amount of material dredged. As a consequence there may be a need to develop new sea deposit sites as existing sites reach capacity; or where there are no sites (such as Uig) or protected areas have been designated over existing sites (such as Wick and Ullapool).
The designation of protected sites is a potential challenge as existing deposit sites may not be able to be used and harbours will need to carry out detailed investigation work to support applications to designate new deposit sites.
The hydrodynamic nature of most deposit sites within Scottish waters results in the natural dispersion of finer material leaving only larger, bulkier material such as rocks and boulders. It is likely that there will be reduced contamination loads in dredge spoil because of greater control on leaching of contaminants from land-based industry and also from those using harbours.
Economic trend assessment
There are no economic data available on dredge disposal, however information on the tonnage disposed can be used to indicate a change in activity.
Regional values for dredge disposal are sporadic and do not necessarily show a true trend. For this reason, trends are only supplied at a national level as this is less volatile.
The total tonnage of dredge material disposed at sea was over 250% higher in 2018 than in 2014 (from 1.2 to 4.2 million tonnes).
Confidence is 2 stars ** (medium). Based on collected statistics with some quality issues.
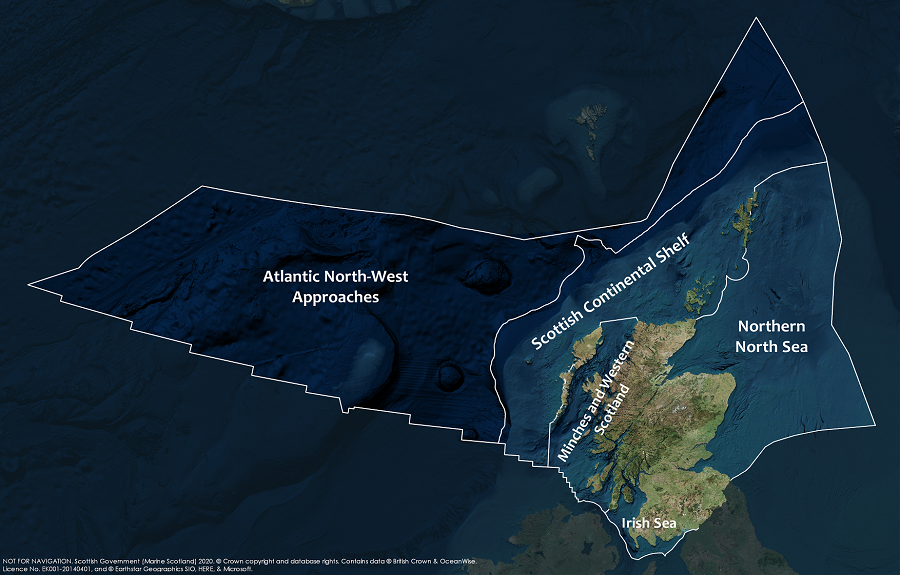
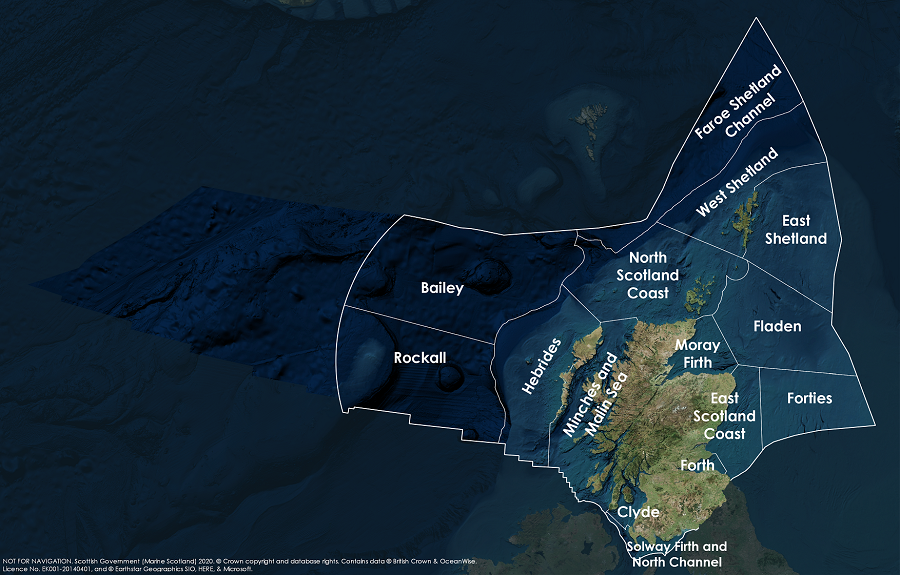
This Legend block contains the key for the status and trend assessment, the confidence assessment and the assessment regions (SMRs and OMRs or other regions used). More information on the various regions used in SMA2020 is available on the Assessment processes and methods page.
Status and trend assessment
|
Status assessment
(for Clean and safe, Healthy and biologically diverse assessments)
|
Trend assessment
(for Clean and safe, Healthy and biologically diverse and Productive assessments)
|
||
|---|---|---|---|
 |
Many concerns |
No / little change |
|
 |
Some concerns |
Increasing |
|
 |
Few or no concerns |
Decreasing |
|
 |
Few or no concerns, but some local concerns |
No trend discernible |
|
 |
Few or no concerns, but many local concerns |
All trends | |
 |
Some concerns, but many local concerns |
||
 |
Lack of evidence / robust assessment criteria |
||
| Lack of regional evidence / robust assessment criteria, but no or few concerns for some local areas | |||
 |
Lack of regional evidence / robust assessment criteria, but some concerns for some local areas | ||
| Lack of regional evidence / robust assessment criteria, but many concerns for some local areas | |||
Confidence assessment
|
Symbol |
Confidence rating |
|---|---|
|
Low |
|
|
Medium |
|
|
High |
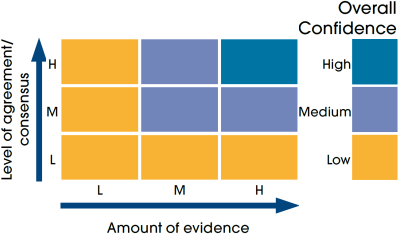
Assessment regions
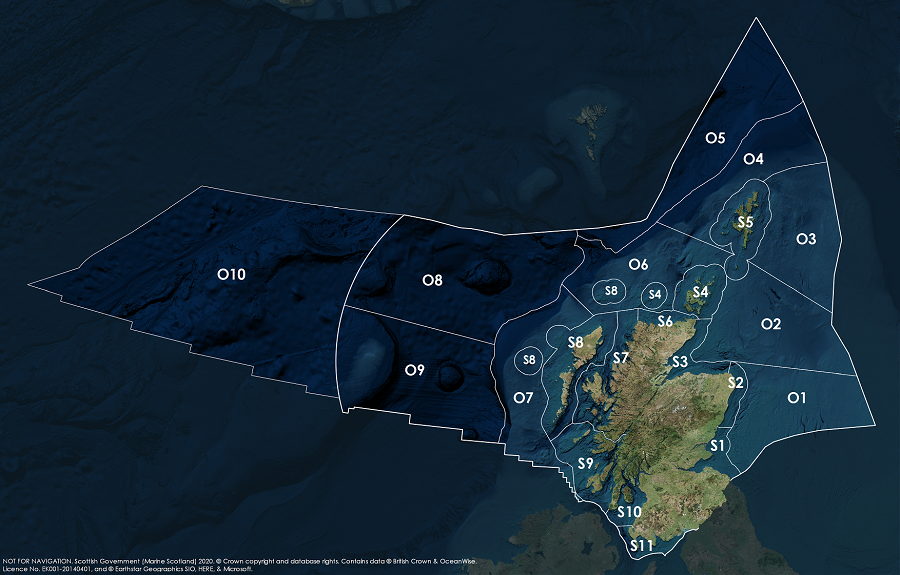
Key: S1, Forth and Tay; S2, North East; S3, Moray Firth; S4 Orkney Islands, S5, Shetland Isles; S6, North Coast; S7, West Highlands; S8, Outer Hebrides; S9, Argyll; S10, Clyde; S11, Solway; O1, Long Forties, O2, Fladen and Moray Firth Offshore; O3, East Shetland Shelf; O4, North and West Shetland Shelf; O5, Faroe-Shetland Channel; O6, North Scotland Shelf; O7, Hebrides Shelf; O8, Bailey; O9, Rockall; O10, Hatton.
