

What, why and where?
Abstraction involves taking water, via pipe, from the sea, using it for an industrial process and then returning it to the sea. Most abstracted water is used for cooling (Figure 1). There is a limit placed on the temperature at which water can be returned. The majority of coastal water abstractions, by volume, recorded as ‘Industrial or Commercial: Non-Evaporative Cooling’ are for power stations (97% of all abstraction in Scotland at 9.5 million m3 per day, down from 98% or 20.2 M m3 per day reported in 2011 (Baxter et al., 2011). The remainder are for use in fish processing and for process water. Process water is water abstraction for use in the production process for industry sectors not covered in another category in table 1 (e.g. food and drink sector, paper industry, brick and cement production). There has been an overall reduction from 20.6 to 9.8 M m3 per day. Information on cooling water used by ships is not included as this is not regulated. There is also no information available on abstraction of seawater by offshore installations.
Other uses of abstracted water include the operation of fish farms and fish processing factories, manufacture of food, wood and chemical products, agriculture, marine animal sanctuaries and navigation abstractions to maintain water levels in impounded docks. Use is also made by the defence industry.
There are abstractions in all Scottish Marine Regions (SMRs) except the north coast (Figure 2), more details about the numbers of licences per SMR are given in the extended section. However these abstractions represent a very small amount of the water available in the sea. If industry could not abstract water from the sea the alternative would be to abstract water from rivers or land based groundwaters, if available, or use cooling towers.
|
Type of extraction activity
|
Capacity of permitted extraction (m3/day)
|
Number of sites extracting
|
% of Scotland total
|
|
Non-Evaporative Cooling (more than 1M m3/day)
|
9,073,155
|
3
|
92.3%
|
|
Non-Evaporative Cooling (less than 1M m3/day)
|
477,147
|
17
|
4.9%
|
|
Fish Production
|
188,710
|
21
|
1.9%
|
|
Process Water
|
69,682
|
32
|
0.7%
|
|
Evaporate Cooling
|
15,000
|
1
|
0.2%
|
|
Other
|
4,661
|
15
|
<0.1%
|
|
Total
|
9,828,354
|
89
|
100%
|
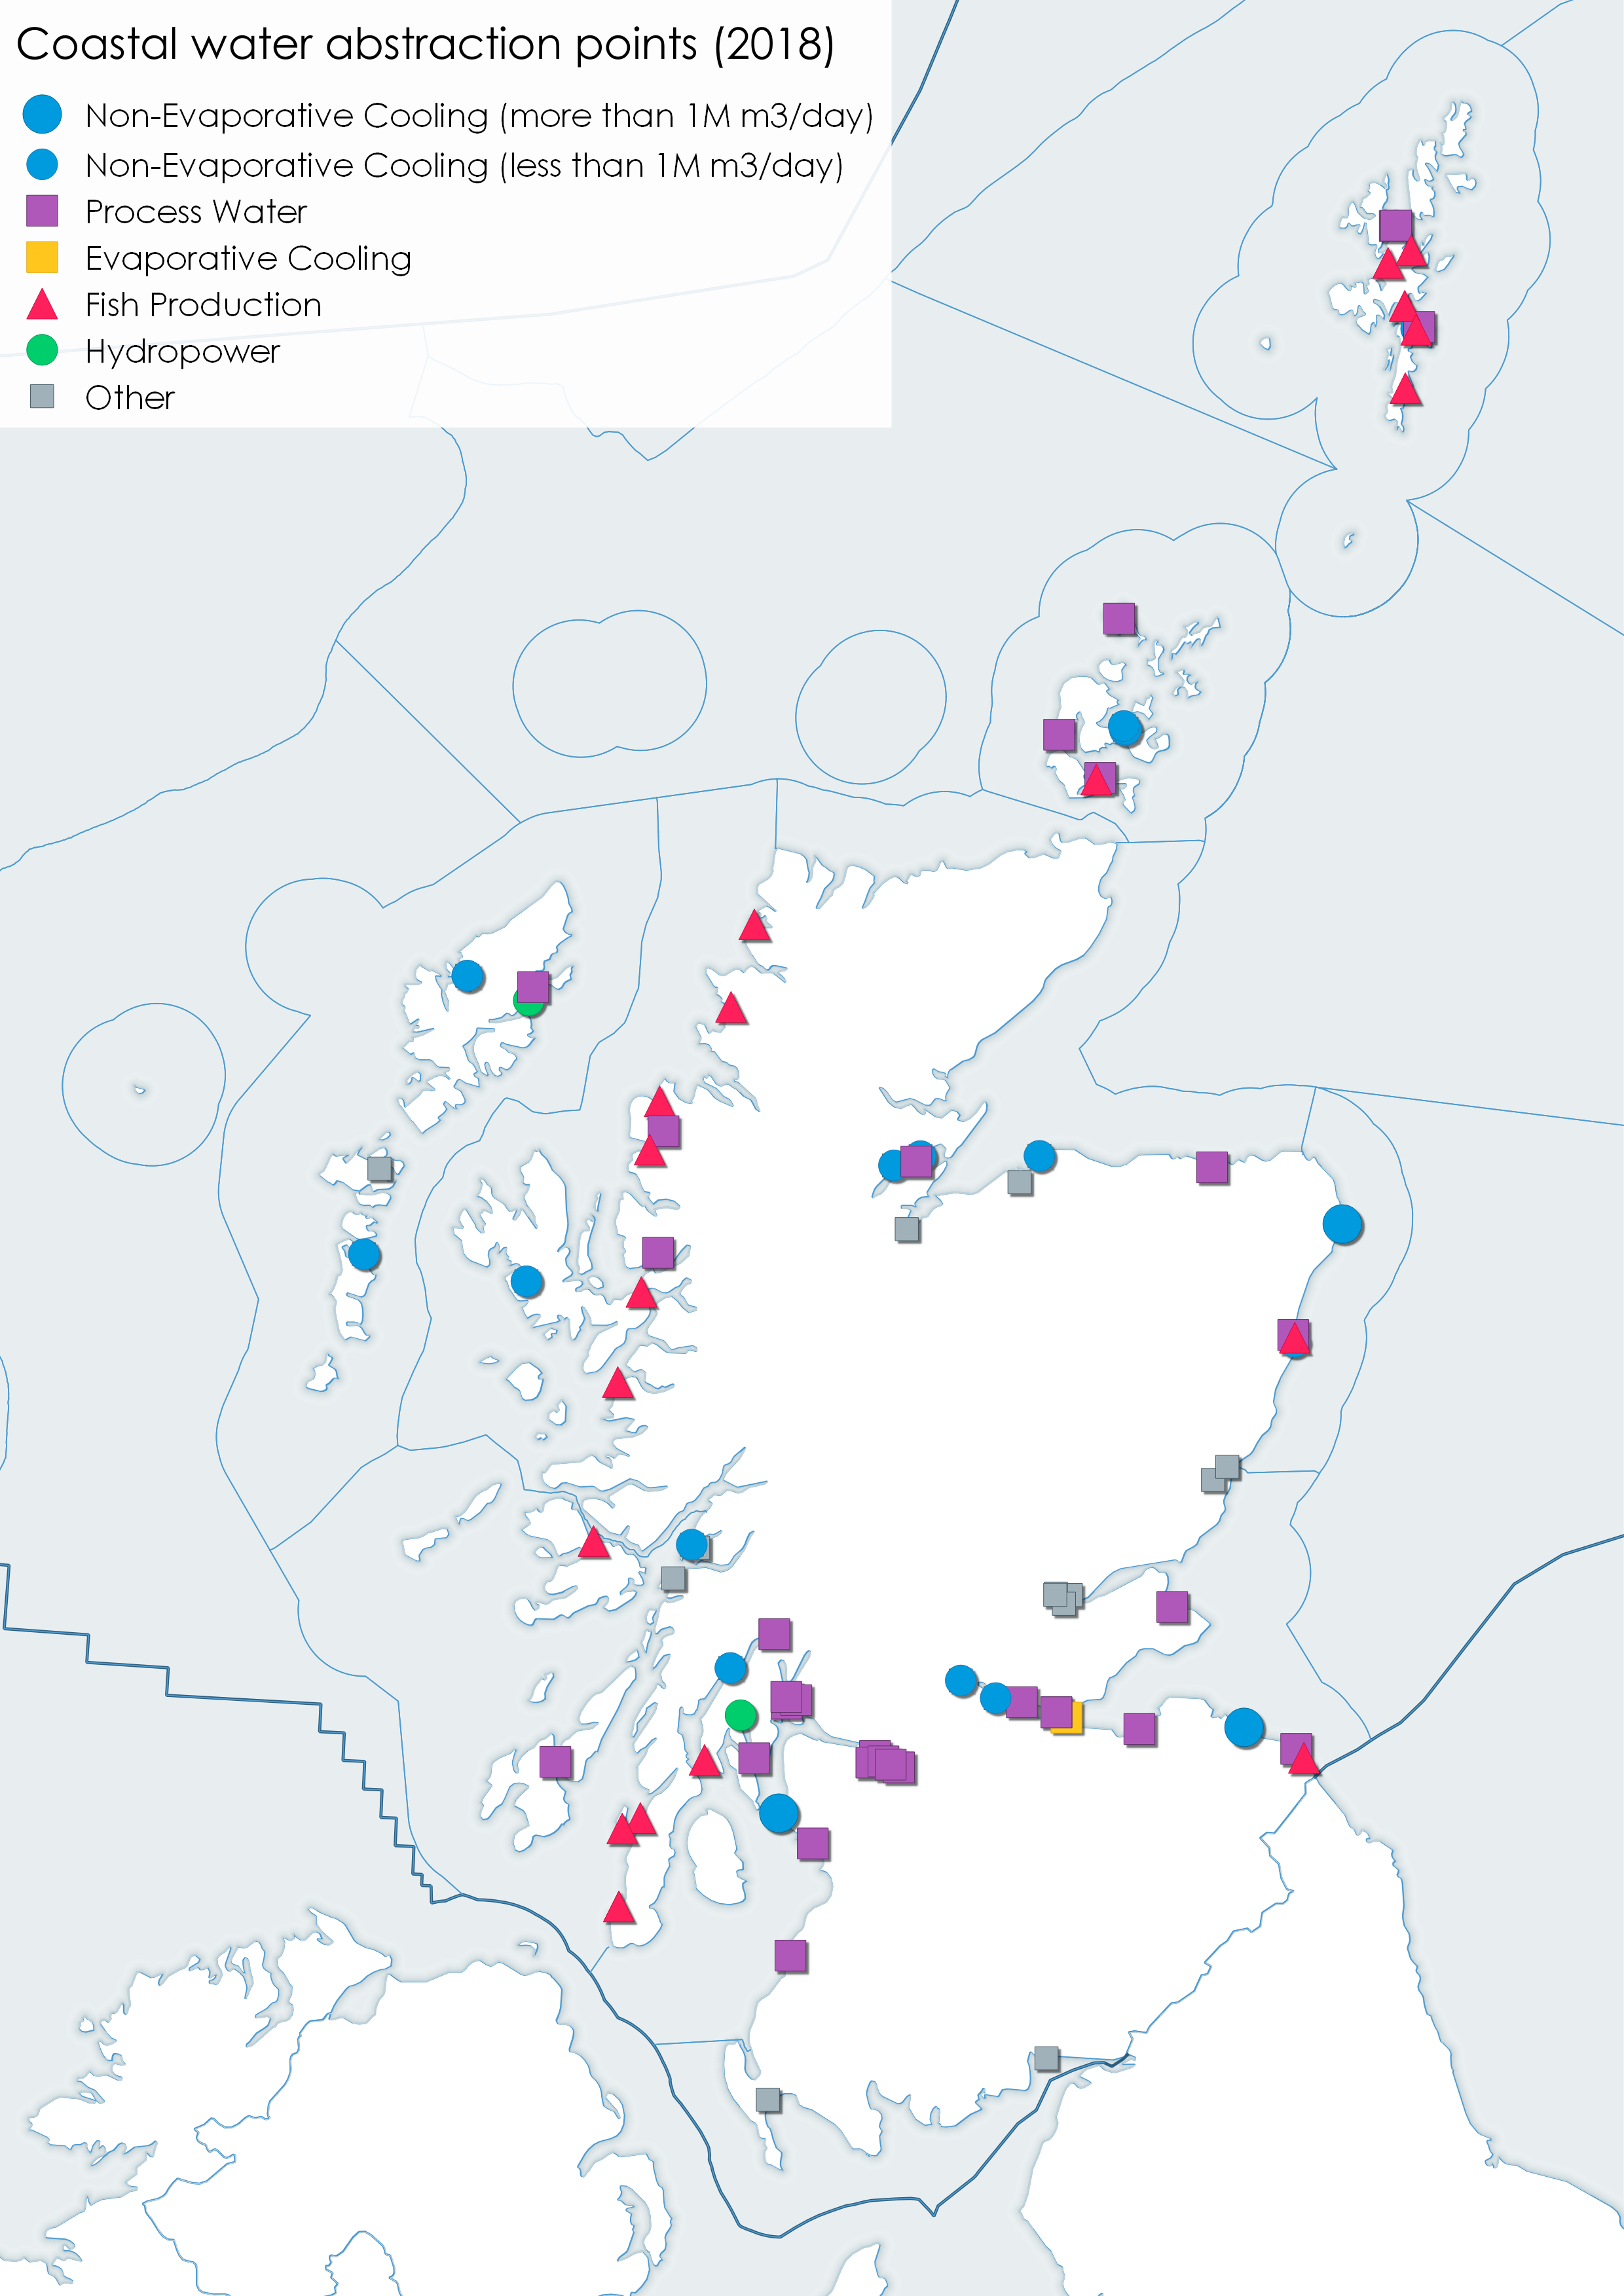
A large power station may abstract up to 200 m3/second or more during peak load for cooling from either coastal or estuarine waters. In most cases non-evaporative cooling is used where the steam turbine exhausts are cooled via main condensers before the water is discharged back to the sea. Evaporative cooling is often used by power stations located inland which use cooling towers to recycle the water. Given the majority of sea water abstraction is for non-evaporative cooling (i.e. power stations) the main locations of this type of activity are the Scottish Marine Regions adjacent to the main population centres. More details of the various types of extraction activity for each SMR are given in Tables a and b.
|
Type of extraction activity per Scottish Marine Region
|
Capacity of permitted extraction (m3/day)
|
Number of sites extracting
|
% of Scotland total
|
|
Forth and Tay
|
4,092,926
|
18
|
41.64%
|
|
Clyde
|
2,614,460
|
16
|
26.60%
|
|
North East
|
2,445,530
|
5
|
24.88%
|
|
Moray Firth
|
322,076
|
7
|
3.28%
|
|
Argyll
|
140,716
|
9
|
1.43%
|
|
Shetland Isles
|
95,825
|
11
|
0.97%
|
|
Orkney Islands
|
76,101
|
7
|
0.77%
|
|
Outer Hebrides
|
26,211
|
5
|
0.27%
|
|
West Highlands
|
14,365
|
9
|
0.15%
|
|
Solway
|
145
|
2
|
<0.1%
|
|
Total
|
9,828,354
|
89
|
100%
|
|
Type of extraction activity per Scottish Marine Region
|
Capacity of permitted extraction (m3/day)
|
Number of sites extracting
|
|
Argyll
|
140,716
|
9
|
|
Fish Production
|
130,610
|
5
|
|
Non-Evaporative Cooling (less than 1M m3/day)
|
25
|
1
|
|
Other
|
81
|
2
|
|
Process Water
|
10,000
|
1
|
|
Clyde
|
2,614,460
|
16
|
|
Fish Production
|
35,000
|
1
|
|
Non-Evaporative Cooling (less than 1M m3/day)
|
2,880
|
1
|
|
Non-Evaporative Cooling (more than 1M m3/day)
|
2,570,000
|
1
|
|
Other
|
21
|
1
|
|
Process Water
|
6,560
|
12
|
|
Forth and Tay
|
4,092,926
|
18
|
|
Evaporate Cooling
|
15,000
|
1
|
|
Fish Production
|
20
|
1
|
|
Non-Evaporative Cooling (less than 1M m3/day)
|
4,950
|
2
|
|
Non-Evaporative Cooling (more than 1M m3/day)
|
4,066,675
|
1
|
|
Other
|
2,396
|
6
|
|
Process Water
|
3,885
|
7
|
|
Moray Firth
|
322,076
|
7
|
|
Non-Evaporative Cooling (less than 1M m3/day)
|
316,973
|
3
|
|
Other
|
1,141
|
2
|
|
Process Water
|
3,962
|
2
|
|
North East
|
2,445,530
|
5
|
|
Fish Production
|
600
|
1
|
|
Non-Evaporative Cooling (less than 1M m3/day)
|
5,000
|
1
|
|
Non-Evaporative Cooling (more than 1M m3/day)
|
2,436,480
|
1
|
|
Other
|
50
|
1
|
|
Process Water
|
3,400
|
1
|
|
Orkney Islands
|
76,101
|
7
|
|
Fish Production
|
480
|
1
|
|
Non-Evaporative Cooling (less than 1M m3/day)
|
53,156
|
3
|
|
Process Water
|
22,465
|
3
|
|
Outer Hebrides
|
26,211
|
5
|
|
Non-Evaporative Cooling (less than 1M m3/day)
|
25,284
|
3
|
|
Other
|
827
|
1
|
|
Process Water
|
100
|
1
|
|
Shetland Isles
|
95,825
|
11
|
|
Fish Production
|
13,085
|
6
|
|
Non-Evaporative Cooling (less than 1M m3/day)
|
64,560
|
2
|
|
Process Water
|
18,180
|
3
|
|
Solway
|
145
|
2
|
|
Other
|
145
|
2
|
|
West Highlands
|
14,365
|
9
|
|
Fish Production
|
8,915
|
6
|
|
Non-Evaporative Cooling (less than 1M m3/day)
|
4,320
|
1
|
|
Process Water
|
1,130
|
2
|
|
Total
|
9,828,354
|
89
|
A 2010 Environment Agency report (Environment Agency, 2010) investigated the relative merits of cooling power stations using water abstraction against cooling towers. While the research was focussed on nuclear power stations, the findings are applicable to other large thermal power station projects. The criteria considered included the cooling water system design, how the design affects the performance of the cooling option and issues such as temperature differentials between water intake and discharge. In terms of efficiency, direct cooling (using extracted water) provided between 0.5% and 3% more efficient generation. The report concluded that direct cooling can be the best available technology for estuarine and coastal sites, provided that best practice in planning, design, mitigation and compensation are followed.
Contribution to the economy
Seawater abstraction does not generate a measurable economic value by itself. It is therefore not possible to report the value of abstraction in terms of Gross Value Added (GVA) or employee jobs. Water abstraction can create efficiency savings and it is clear that such abstractions are fundamental to sustaining certain key economic activities, for example the production of electricity.
The 2010 Environment Agency report (Environment Agency, 2010) estimated that cooling power stations using water abstraction provided between 0.5% and 3% more efficient generation than the use of cooling towers. This would translate into a significant economic benefit for a coastal location given the value of the electricity produced.
Since 2011 two large power stations closed reducing the need and therefore value of water abstraction for power generation.
Examples of socio-economic effects
- Water abstraction supports electricity generation which is important to the economy.
- Recreational angling may benefit from wild sea bass feeding in the plume of discharged waters (anecdotal evidence from Torness power station).
- Fish caught on intake grilles may reduce efficiency of industrial process.
- Possible restrictions on certain uses of the sea near large intakes.
Pressures on the environment
An OSPAR agreed list of marine pressures is used to help assessments of human activities in the marine environment. The marine pressure list has been adapted for use in Scotland via work on the Feature Activity Sensitivity Tool (FeAST). Water abstraction activities can be associated with 10 marine pressures – please read the pressure descriptions and benchmarks for further detail.
The list of marine pressures is used to help standardise assessments of activities on the marine environment, and is adapted from an agreed list prepared by OSPAR Intercessional Correspondence Group on Cumulative Effects (ICG-C) (see OSPAR 2014-02 ‘OSPAR Joint Assessment and Monitoring Programme (JAMP) 2014-2021’ Update 2018’ (Table II).
The Feature Activity Sensitivity Tool (FeAST) uses the marine pressure list to allow users to investigate the sensitivity of Scottish marine features. It also associates all pressures that might be exerted by a defined list of activities at a particular benchmark. The extent and impact of each pressure from a given activity will vary according to its intensity or frequency. The extent and impact of the pressure will also vary depending on the sensitivity of the habitat or species on which it is acting. The existence of multiple activities, and potentially multiple pressures, at specific locations will result in a cumulative impact on the environment.
FeAST is a developing tool. A snap shot from 2019 was used for the development of SMA2020. Please consult the FeAST webpage for further information and up to date information.
The list of pressures below associated with this activity is given in alphabetical order. Clicking the pressure will give you more information on the pressure and examples of how it may be associated with the activity.
Forward look
Water abstraction is generally important for industry and for economic growth. Predictions about future developments cannot be made with any certainty so new water abstraction is led by the needs of industry and markets.
The third National Planning Framework (Scottish Government, 2014) (NPF3) emphasises ‘generating the equivalent of at least 100% of gross electricity consumption from renewables’ and has ruled out the building of new nuclear power stations. Both aspirations may well reduce demand for water abstraction for power stations. However NPF3 also reflects the need to provide thermal generation at a refurbished Peterhead power station and a new coal-fired power station with Carbon Capture Utilisation and Storage technology at Grangemouth. Both of those could see demand rise in their respective regions. Therefore the extent to which the current level of water abstraction for power generation may continue is unknown.
Locations of future water intakes will need careful consideration, particularly if proposed for narrow estuaries or firths that are important for protected habitats and species.
Economic trend assessment
Economic trend assessment is not possible as seawater extraction does not generate GVA directly. While water abstraction can create efficiency savings, it does not generate a measurable economic value by itself.
This Legend block contains the key for the status and trend assessment, the confidence assessment and the assessment regions (SMRs and OMRs or other regions used). More information on the various regions used in SMA2020 is available on the Assessment processes and methods page.
Status and trend assessment
|
Status assessment
(for Clean and safe, Healthy and biologically diverse assessments)
|
Trend assessment
(for Clean and safe, Healthy and biologically diverse and Productive assessments)
|
||
|---|---|---|---|
 |
Many concerns |
No / little change |
|
 |
Some concerns |
Increasing |
|
 |
Few or no concerns |
Decreasing |
|
 |
Few or no concerns, but some local concerns |
No trend discernible |
|
 |
Few or no concerns, but many local concerns |
All trends | |
 |
Some concerns, but many local concerns |
||
 |
Lack of evidence / robust assessment criteria |
||
| Lack of regional evidence / robust assessment criteria, but no or few concerns for some local areas | |||
 |
Lack of regional evidence / robust assessment criteria, but some concerns for some local areas | ||
| Lack of regional evidence / robust assessment criteria, but many concerns for some local areas | |||
Confidence assessment
|
Symbol |
Confidence rating |
|---|---|
|
Low |
|
|
Medium |
|
|
High |

Assessment regions
 and the Scottish Offshore Marine Regions (OMRs, O1 – O10)")
Key: S1, Forth and Tay; S2, North East; S3, Moray Firth; S4 Orkney Islands, S5, Shetland Isles; S6, North Coast; S7, West Highlands; S8, Outer Hebrides; S9, Argyll; S10, Clyde; S11, Solway; O1, Long Forties, O2, Fladen and Moray Firth Offshore; O3, East Shetland Shelf; O4, North and West Shetland Shelf; O5, Faroe-Shetland Channel; O6, North Scotland Shelf; O7, Hebrides Shelf; O8, Bailey; O9, Rockall; O10, Hatton.
 Regions. These have been used as the assessment areas for hazardous substances.")
, Regions.")