

Background
Waves are generated by wind blowing across the ocean and this locally forms short steep waves. These waves lengthen as they propagate through the ocean to form swell waves. The waves in Scottish waters contain a spectrum of waves, from short, steep locally generated waves to longer swell waves typically originating in the Atlantic Ocean. There is large natural variability in the wave climate. Waves in Scottish waters tend to vary seasonally due to large scale weather conditions, such as large storms in the Atlantic being more likely during the autumn and winter months. There is also decadal variability in weather and consequently wave conditions.
In the sea there is always a spectrum of waves with different heights, periods and direction and the wave climate is often described by statistical indices describing these parameters as averages. This assessment examines the significant wave height and average wave direction, which can be defined as the average of the top one third of waves and the average direction of all waves, respectively, over a period of time.
Numerical spectral wave models can model the wave energy spectrum across large model domains, providing wave statistics at a high spatial resolution across a large spatial area. They are often used as tools to examine the wider temporal and spatial change in wave fields which a small number of point measurements, made by wave buoys for example, would be unable to provide.
This assessment used output from a numerical wave model of the North East Atlantic developed by Bricheno & Wolf (2018) at the National Oceanography Centre in Liverpool. The model is divided into a number of grid cells and has a regular grid with an approximate resolution of 5.4 x 9.1 km in Scottish waters (Bricheno & Wolf, 2018). The model is an implementation of the WaveWatch III spectral wave model (https://polar.ncep.noaa.gov/waves/wavewatch/), forced with winds data from ERA-Interim (Dee et al., 2011). Wave model output for a 35 year period, 1981 – 2015, was used for this analysis.
Bricheno & Wolf (2018) validated the wave model using observations obtained from wave rider buoys at 23 sites around UK waters. Time series of observed significant wave height, peak spectral wave period and mean wave direction were compared with the model outputs, and a number of indices were examined by Bricheno & Wolf (2018) to assess the model performance. They found that the model performed best in deep, swell dominated, sites, and performed least well in wind sea dominated sites in the North Sea.
Monthly average significant wave height and wave direction data at each grid cell of the model over Scottish waters were used. Seasonal average values were then calculated for each season of the 35 year time series. Winter, spring, summer and autumn were defined as December to February, March to May, June to August and September to November, respectively. Climatological averages were then calculated for a thirty year reference period of 1981 to 2010, and a more recent 5 year period of 2011 to 2015, giving spatial fields (at the model resolution) of the average seasonal wave climate for each period of time.
Figures 1 and 2 (in Results section), respectively, show the winter and summer climatological average significant wave height fields across Scottish waters for the reference period. These figures also present wave roses showing the monthly average data over the 30 year reference period for Offshore Marine Regions O1 (Long Forties), O3 (East Shetland Shelf), O5 (Faroe Shetland Channel) and O9 (Rockall), as representative examples.
Spatial averages of the wave statistics were taken across each of the Scottish Marine Regions and Offshore Marine Regions. Climatological seasonal averages of the significant wave height were then calculated for each region and for each time period (30 year reference and 5 year recent).
Normalised anomalies in significant wave height for the five year period 2011 - 2015, relative to the reference period of 1981 – 2010, were calculated for each climatological season. Figures 3 and 4 show these normalised anomalies for each region and for each season, for the Offshore Marine Regions and Scottish Marine Regions, respectively.
Results
Figures 1 and 2, respectively, show the winter and summer climatological average significant wave height fields across Scottish waters for the 30 year reference period of 1981 – 2010. Selected wave roses for four of the Offshore Marine Regions are also shown. The wave roses show the monthly average data for the whole 30 year period and present the frequency distribution of the average direction from which the waves are travelling and significant wave height for each month.
Figures 1 and 2 show that the wave climate varies spatially around Scotland. To the west the dominant wave direction is from the west-south-west, with typical winter offshore significant wave heights of 5 m and typical summer offshore significant wave heights of 2 m. In contrast, the offshore significant wave height to the east is typically 2 – 3 m in winter and 1 – 1.5 m in summer and come from a larger variety of directions, with more waves coming from the north during the summer.
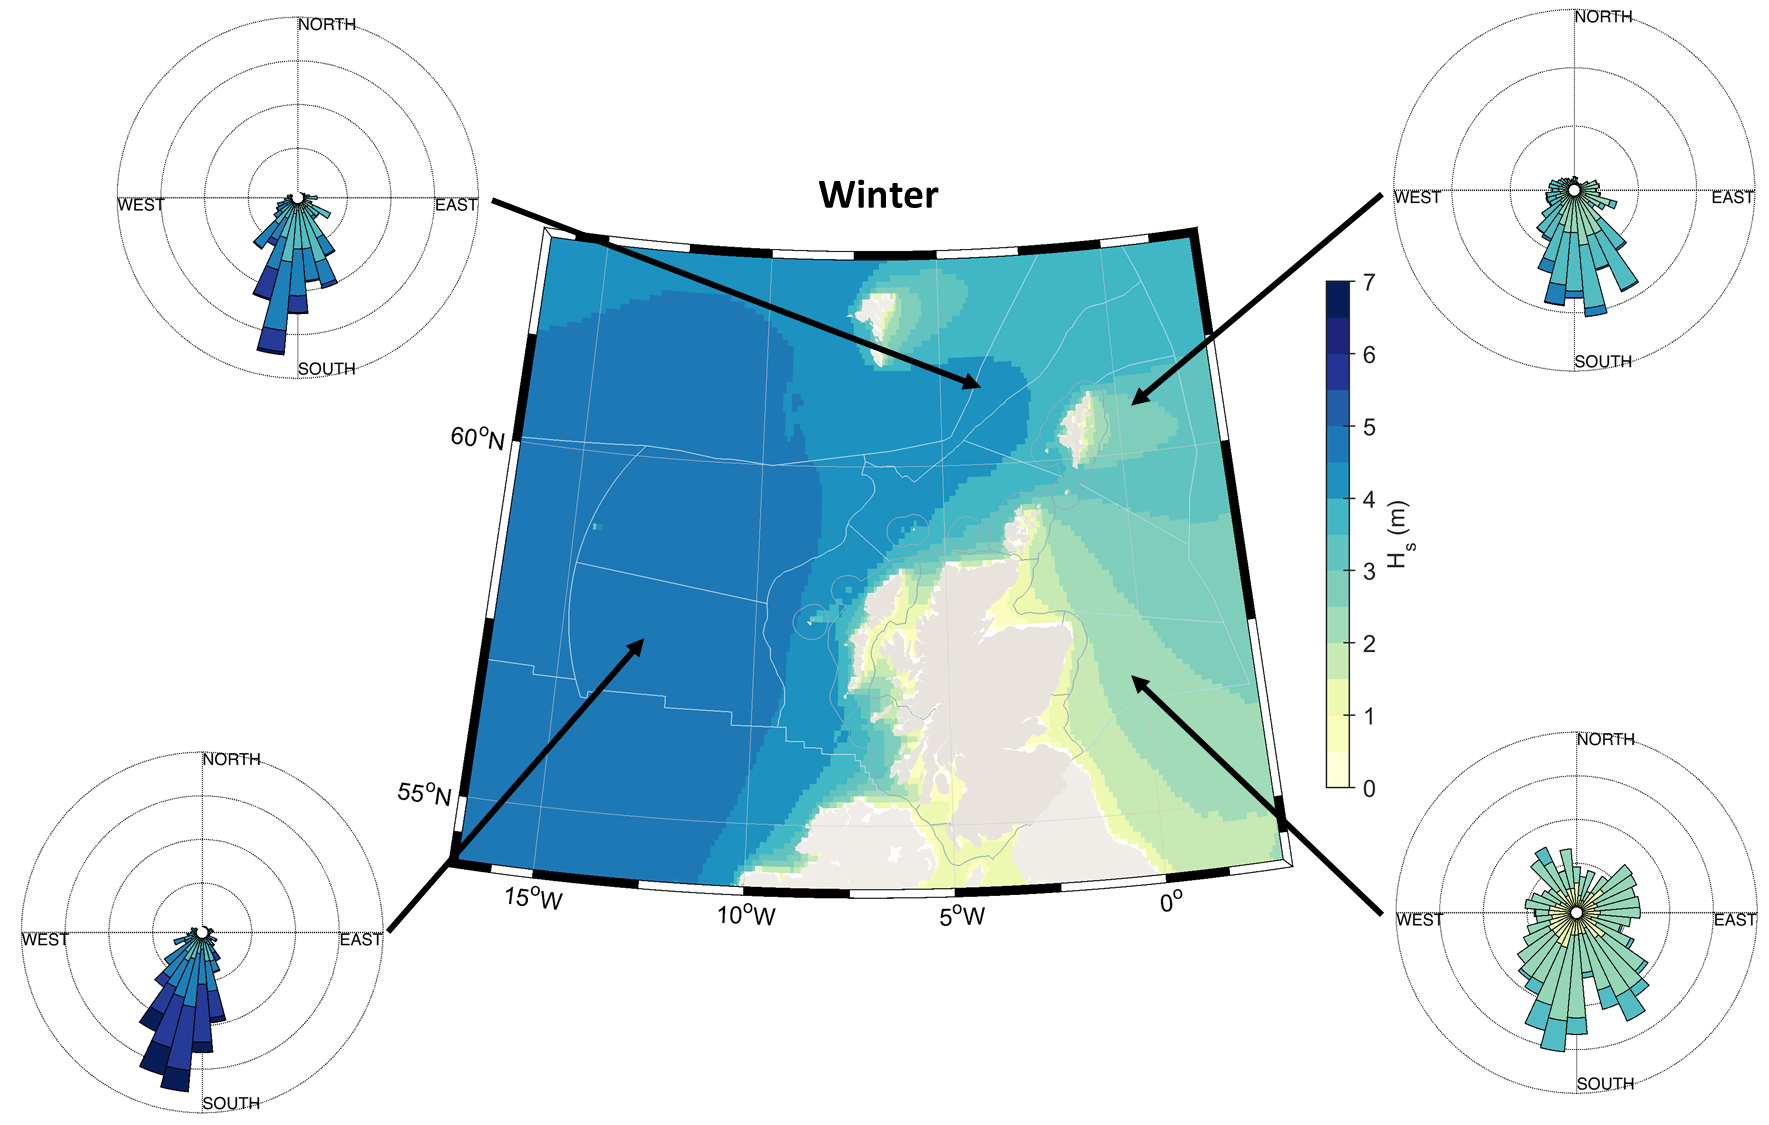
Figure 1: Winter (December – January) climatological average significant wave heights across Scottish waters from a hindcast wave model run. The Offshore Marine Regions and Scottish Marine Regions are shown, along with wave roses showing the frequency distribution of monthly significant wave height and direction data from Offshore Marine Regions O1, O3, O5 and O9.
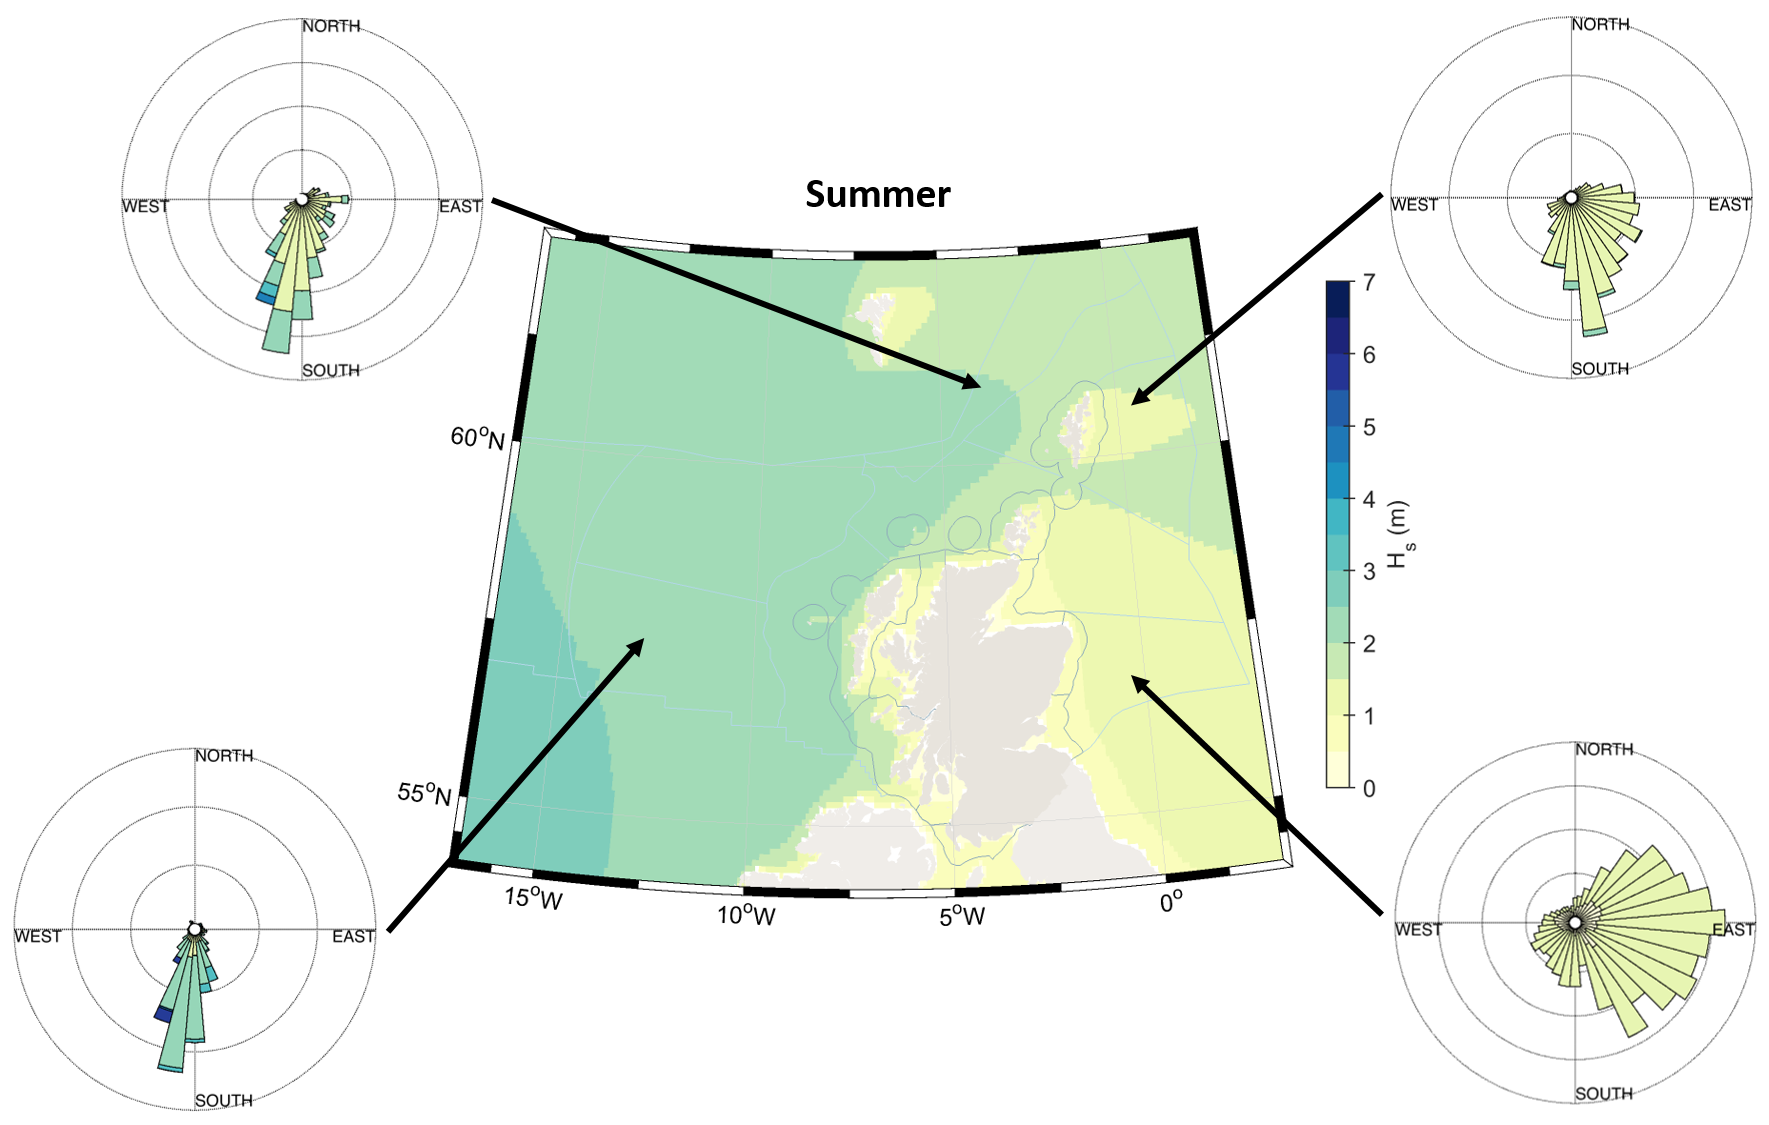
Figure 2: Summer (May - July) climatological average significant wave heights across Scottish waters. The Offshore Marine Regions and Scottish Marine Regions are shown, along with wave roses showing the frequency distribution of monthly significant wave height and direction data from Offshore Marine Regions O1, O3, O5 and O9.
The normalised anomalies for climatological average significant wave height are shown in Figures 3 and 4 for each of the Offshore Marine Regions and Scottish Marine Regions, respectively. These anomalies indicate how the significant wave height in recent years (2011 - 2015) has changed from the long term average (1981 - 2010). The anomalies are predominantly weakly positive for most marine regions throughout the year. The Offshore Marine Regions to the east of Scotland have weakly negative anomalies in the Spring and Autumn and the southernmost Scottish Marine Regions have weakly negative anomalies through some of the year. This generally shows that the significant wave height during 2011 - 2015 was close to average, but in general has a very small increase compared to the 30 year reference period.
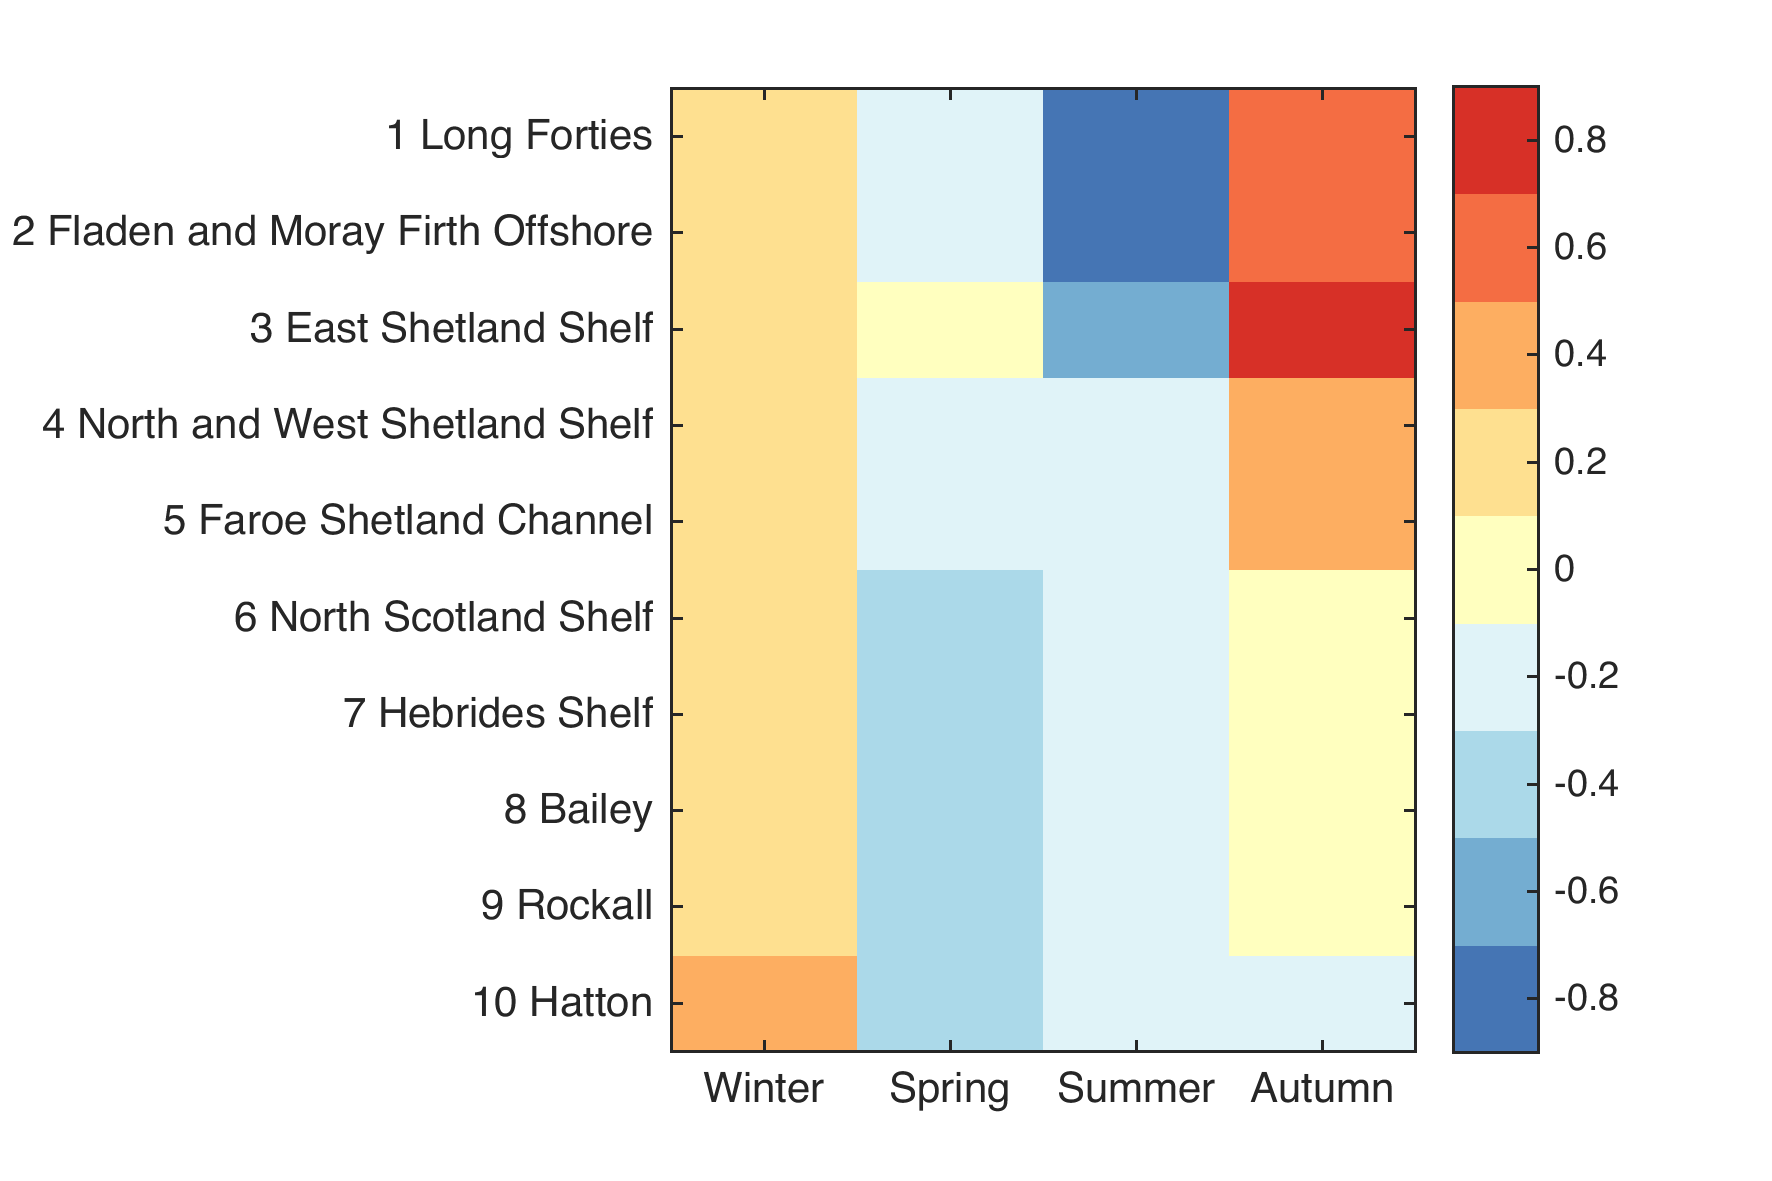
Figure 3: Normalised anomalies of seasonal climatological average significant wave height over the years 2011 - 2015 for the Offshore Marine Regions. The anomalies were calculated with respect to the 30 year 1981 - 2010 reference period and are normalised by the standard deviation of the seasonal 30 year time series. See the Introduction - Assessment processes and methods for full definition of the marine regions.
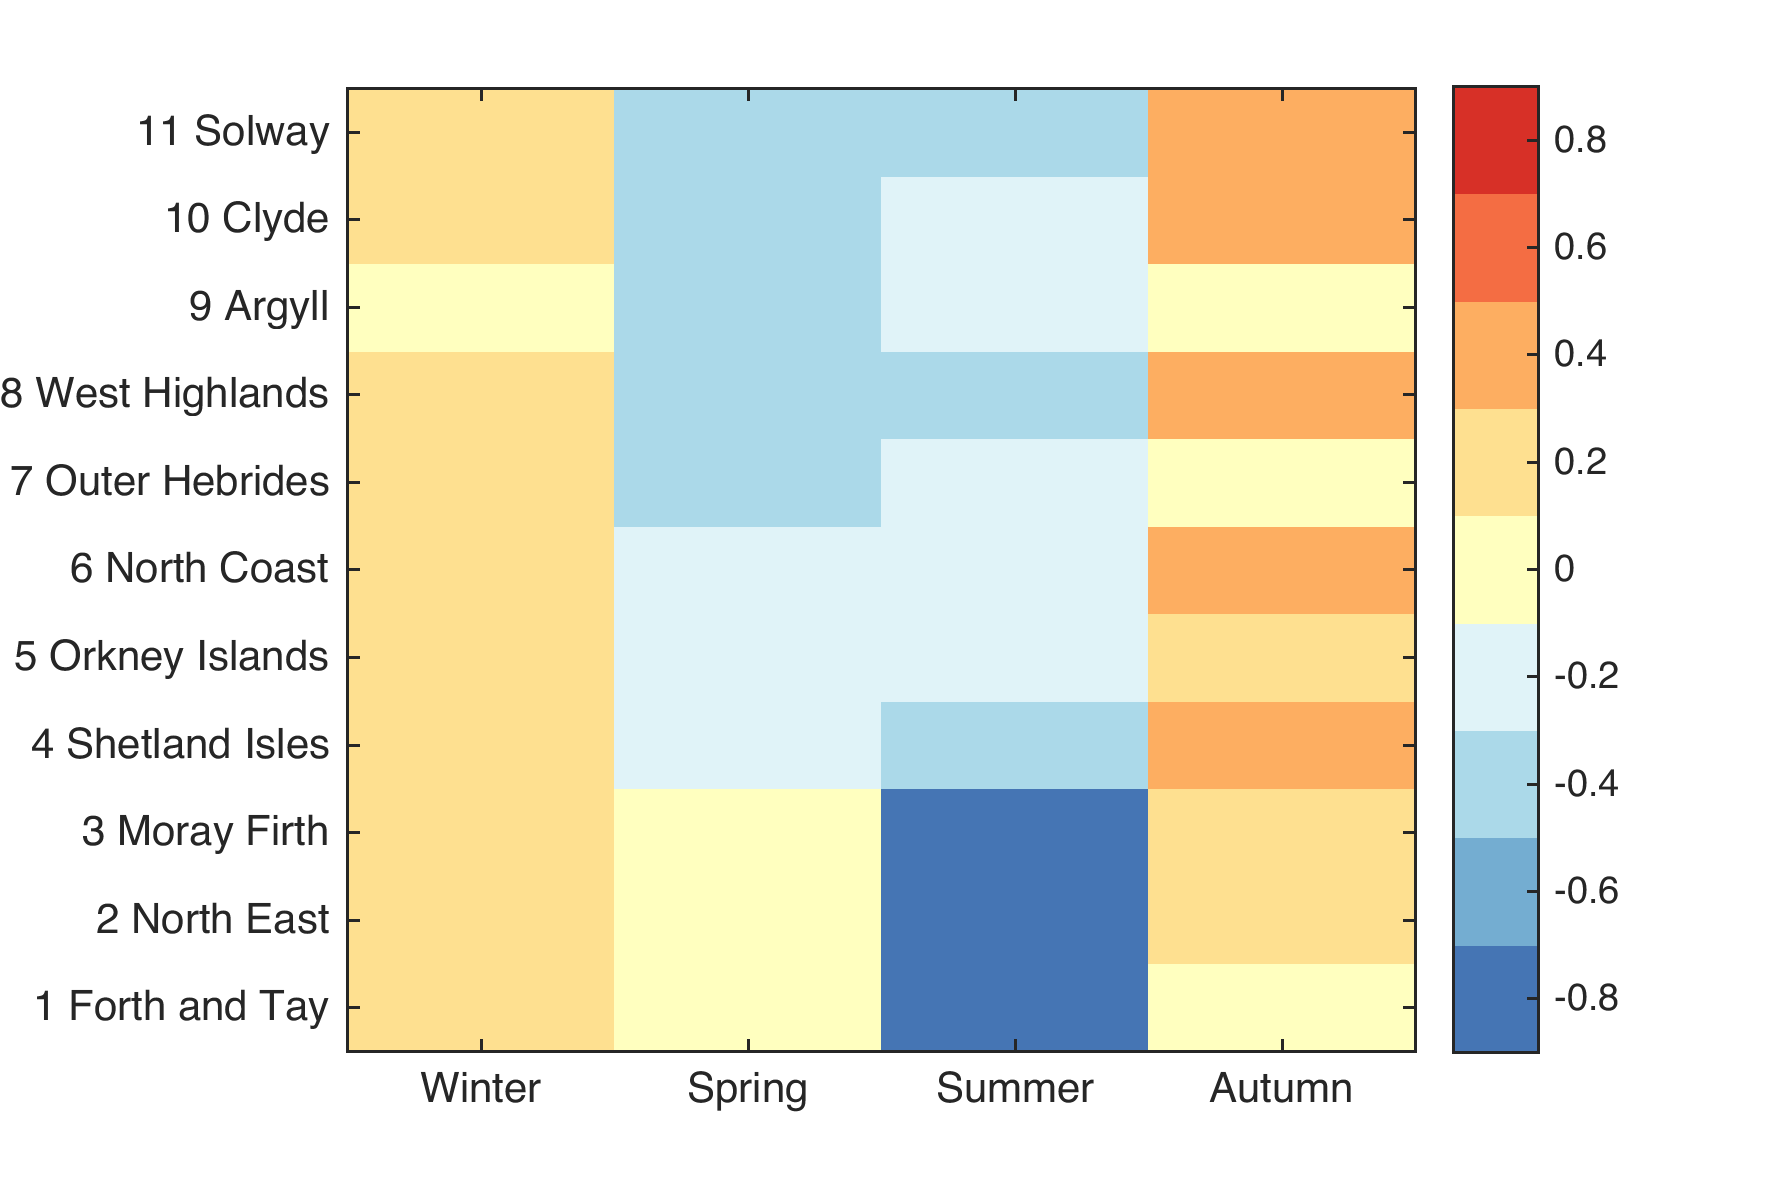
Figure 4: Normalised anomalies of seasonal climatological average significant wave height over the years 2011 - 2015 for the Scottish Marine Regions. The anomalies were calculated with respect to the 30 year 1981 - 2010 reference period and are normalised by the standard deviation of the seasonal 30 year time series. See the Introduction - Assessment processes and methods for full definition of the marine regions.
Conclusion
There is large natural variability in the Scottish wave climate with a large seasonal variation in the significant wave heights (average of the highest one third of waves). Output from a state-of-the-art, high resolution, numerical wave model run for a 35 year period was split into two time periods: a 30 year reference (1981 - 2010) and a 5 year more recent period (2010 - 2015). These data were analysed in order to determine the spatial variability in the wave climate across Scottish waters and whether the wave climate has changed in recent years.
To the west the dominant wave direction is from the west-south-west, with typical winter offshore wave heights of 5 m. In contrast, the offshore waves to the east are typically 2 – 3 m high and come from a larger variety of directions.
Normalised anomalies of seasonal climatological average significant wave height had magnitudes of < 0.8. This shows that in recent years the wave heights were close to the long term average, with only a very small increase in some regions.
Knowledge gaps
There are not many observations of waves around Scottish coasts. Numerical models can fill in this missing information, but these do require observations for validation and reliable information on forcing mechanisms (such as meteorology and bathymetry). The inshore waters around Scotland, such as the west coast sea lochs, are not always well resolved by wave models, including the one used in this analysis. More information on wave climate in coastal regions should be collected.