
Sections
Key message

What, why and where?
Oil and gas exploration has been a major activity in Scottish offshore waters since the late 1960s. There are 112 active platforms and 14,801 km of pipeline. While production has increased since 2014 (Figure 1) following a period of significant investment during high oil prices, it is expected to return to a trend of annual decreases over the remainder of its lifespan. The Oil and Gas Authority (OGA) assume that production will decrease by 5% annually from 2024. Production on the United Kingdom Continental Shelf (UKCS) has decreased 34% (1990 to 2018), and is down 62% from peak production in 1999.
Most oil and gas fields in the Scottish sector of the UKCS are located in the North Sea (Figure 2). Only the Lybster field in the Moray Firth (started production 2012) is close to shore and within the 12 nautical mile Territorial Sea limit now that the Beatrice field has ceased production and hosts wind turbines. There has also been activity to the west of Shetland, following the discovery of the Clair Field in 1977 (production started 2005).
There is extensive infrastructure associated with these developments, both on the seabed and on land. This includes platforms, pipelines and terminals. There is currently no natural gas storage activity in Scottish waters.
Between 2011 - 2018 forty-two new fields started production. Decommissioning also commenced, albeit slower than originally anticipated as operational efficiency has extended field life and delayed decommissioning on many mature fields. During 2017, the number of wells decommissioned exceeded wells drilled for the first time (Oil & Gas UK, 2018a). The Decommissioning Action Plan (SE & HIE, 2016) sets out how to make the most of decommissioning opportunities.
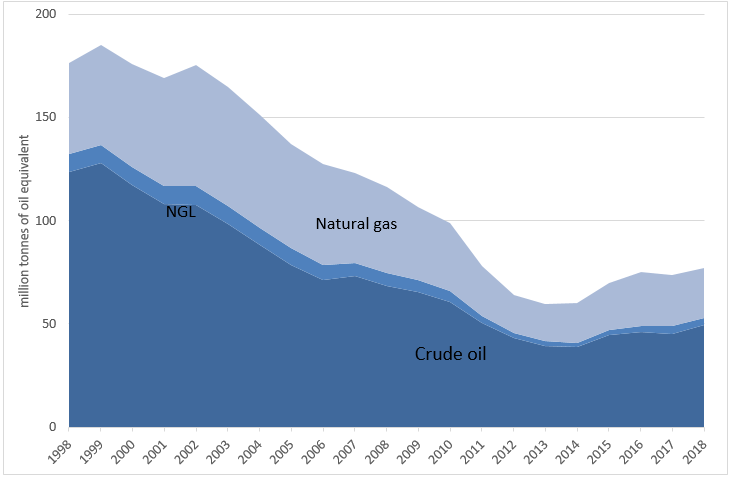
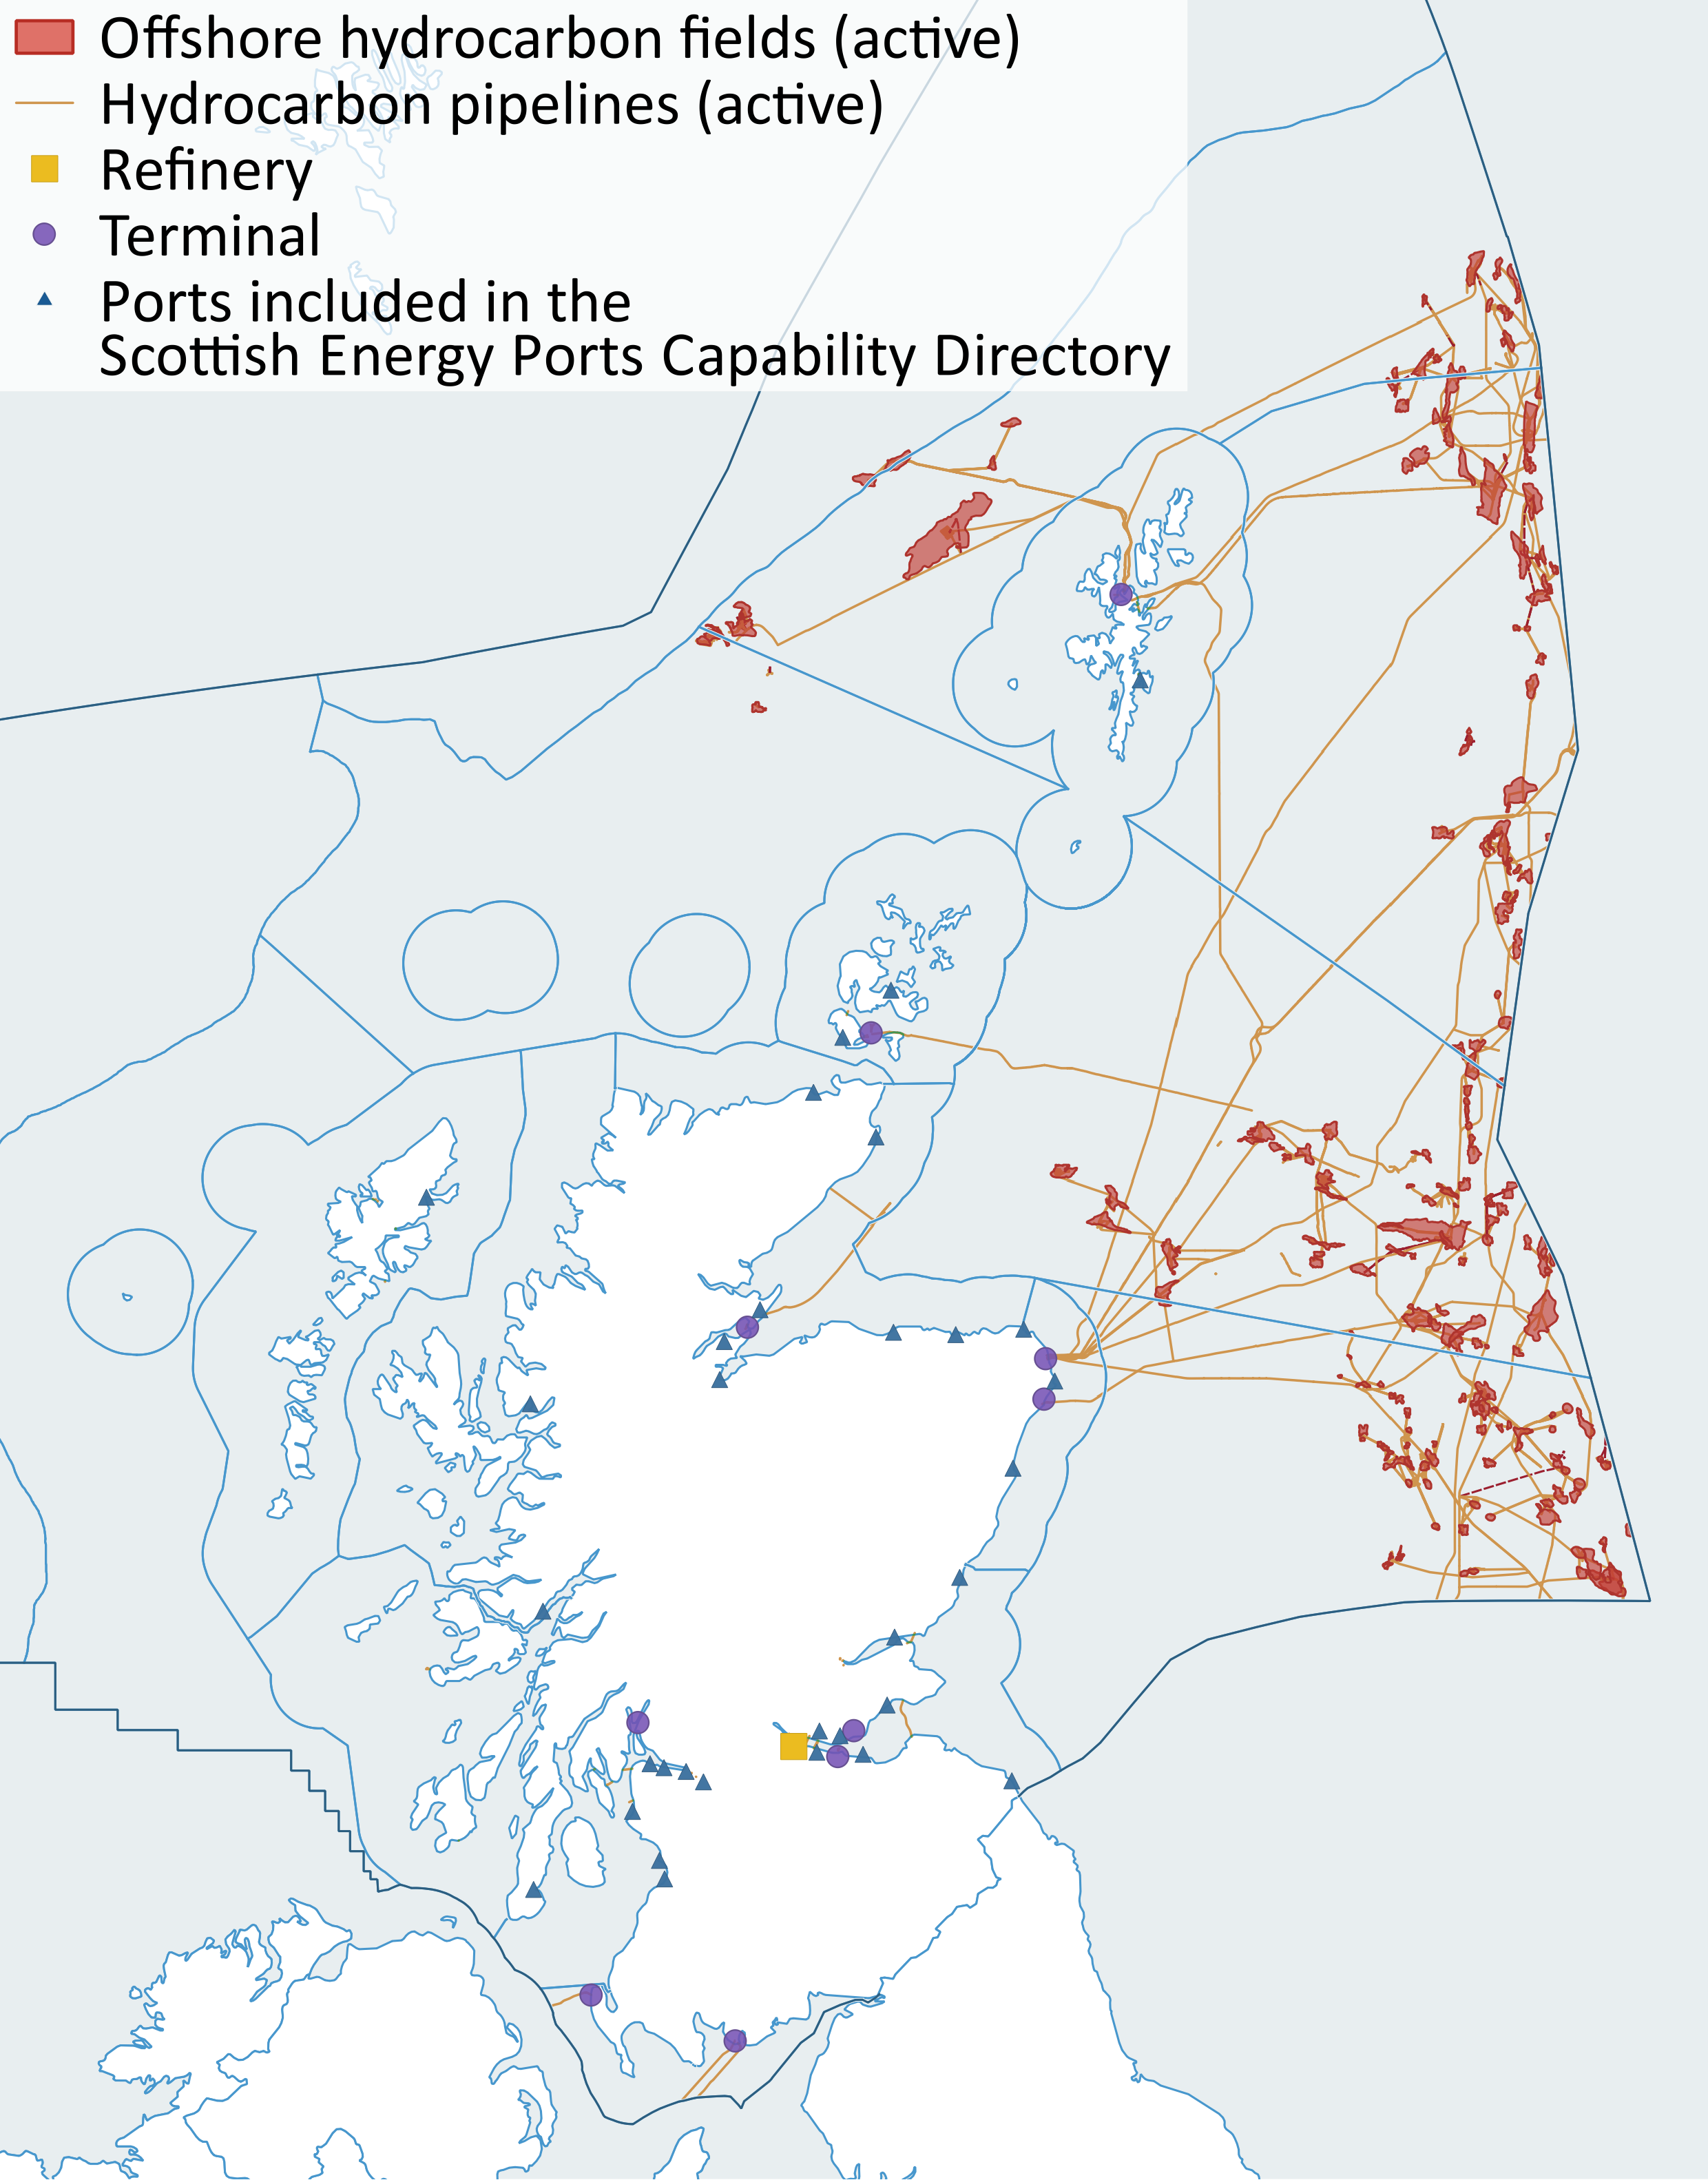
Figure 2: Map of active offshore hydrocarbon fields, pipelines and main coastal infrastructure with Scottish Marine Regions and Offshore Marine Regions. November 2019. Source: OGA, Ocean Wise and Scottish Energy Ports Capability Directory.
The Scottish Energy Strategy (2017) sets out a commitment to maximise economic recovery from the North Sea and to encourage new exploration in the North Sea. The Programme for Government (2019) confirmed that continued support for exploration and recovery will be conditional on the sector’s actions to help ensure a sustainable energy transition.
Oil and gas are Scotland’s principal sources of fuel and power, making up 78.8% of all energy consumption, accounting for 91.3% of all heat demand and almost all energy consumption in transport (Scottish Government, 2019a).
Between 2011 - 2018 forty-two new fields have started production (Table a). There are a number of fields for which consent has been granted but production has not started (Table b).
There is extensive infrastructure associated with oil and gas developments including seabed and platform-mounted production facilities and networks of pipelines (Table c) bringing oil and gas ashore for processing. The shore-side reception facilities include the gas terminal at St Fergus (Aberdeenshire) and the Sullom Voe oil terminal (Shetland), the largest oil terminal in Europe. There are three interconnector pipelines in the south west which take gas across the Irish Sea.
As production declines efforts have turned to decommissioning, which has commenced, albeit slower than originally anticipated. The increase in operational efficiency has helped to halve operating costs and boost production, as well as extend the field life on many mature fields causing decommissioning to be postponed. Seventeen projects have been postponed since 2016’s survey to outside the timeframe as operators have successfully extended field life.
Sustained efficiency improvements and cost reductions could defer cessation of production (COP) and therefore push back decommissioning in some cases, while the low oil price environment and access to infrastructure issues might expedite it in other cases. For example, over the last 12 months, 33 assets within the timeframe on the UKCS have deferred COP, 72 have brought forward COP, while for 135 COP remains unchanged. Since 2011 some fields have stopped production or are being decommissioned, for example the Beatrice (Moray Firth), which now hosts wind turbines.
In February 2018, in partnership with Highlands and Islands Enterprise and Scottish Enterprise, Scottish Government commissioned Westwood Energy Group to produce the Offshore Floating Asset Decommissioning Market Study (HIE, 2018) which explores decommissioning opportunities in the oil and gas sector. Funding and assistance to enhance the capability of the Scottish supply chain was also made available, with the aim of making Scotland a world leader in decommissioning. Scotland's network of ports (Scottish Energy Ports Capability Directory) offer a range of infrastructure, facilities, skills and supply chain to support the oil & gas, decommissioning, subsea and renewables industries.
While oil and gas continue to make a significant contribution to Scotland’s energy security during the transition towards net zero emissions economy, the Scottish Government aims for renewables to meet 50% of the energy for Scotland’s heat, transport and electricity consumption by 2030 (Scottish Energy Strategy, 2017).
. © BP.")
|
Scottish Offshore Marine Region
|
2011
|
2012
|
2013
|
2104
|
2015
|
2016
|
2017
|
2018
|
|
Long Forties
|
|
|
Jasmine (C)
|
|
Godwin (O)
|
Crathes (O)
|
Catcher (O)
Cayley (C)
Shaw (O)
Stella (O)
|
Burgman (O)
Harrier (C)
Varadero (O)
|
|
Fladen and Moray Firth Offshore
|
|
Bacchus (O)
|
Balloch (O)
Huntington (O)
Rochelle (C)
Tonto (O)
|
Golden eagle (O)
Kinnoull (O)
|
Enochdhu (O)
Peregrine (O)
Solitaire (O)
|
Alder (C)
Scolty (O)
|
Arundel (O)
|
|
|
East Shetland Shelf
|
Loirston (O)
|
Devenick (C)
Islay (C)
|
|
|
Cladhan (O)
|
|
Barra (O)
Callater (O)
Harris (O)
Kraken (O)
|
Garten (O)
|
|
North and West Shetland Shelf
|
Conrie (O)
Falcon (O)
|
|
Cormorant east (O)
|
|
Ythan (O)
|
|
Edradour (C)
Glenlivet (C)
|
|
|
Faroe Shetland Channel
|
|
|
|
|
|
Laggan (C)
Tormore (C)
|
|
|
|
North Scotland Shelf
|
|
|
|
|
|
Solan (O)
|
|
|
|
Moray Firth
|
|
Lybster (O)
|
|
|
|
|
|
|
|
Scottish Offshore Marine Region
|
2011
|
2012
|
2013
|
2014
|
2015
|
2016
|
2017
|
2018
|
|
Long Forties
|
|
Fram (C)
|
|
|
|
Culzean (C)
|
|
Columbus (G)
Arran (C)
Fram (C)
Vorlich (O)
|
|
Fladen and Moray Firth Offshore
|
Blackbird (O)
|
|
|
Aviat (G)
|
|
|
|
Finlaggan (C)
|
|
East Shetland Shelf
|
|
Fionn (O)
|
Mariner (O)
Morrone (O)
Kraken north (O)
|
|
|
|
Utgard (O)
|
Ballindalloch (O)
|
|
North and West Shetland Shelf
|
Causeway (O)
|
|
|
|
|
|
|
Alligin (O)
|
|
Faroe Shetland Channel
|
|
|
|
|
|
|
|
|
|
North Scotland Shelf
|
|
|
|
|
|
|
Lancaster eps (O)
|
|
|
SMR / OMR
|
|
|
|
|
Scottish Marine Region
|
Pipeline length (kms)
|
Active platforms and FPSO*
|
Abandoned, Not in use, Removed platforms & FPSO*
|
|
Solway
|
94
|
|
|
|
Clyde
|
10
|
|
|
|
Argyll
|
3
|
|
|
|
Outer Hebrides
|
1
|
|
|
|
Orkney Islands
|
44
|
|
|
|
Shetland Isles
|
596
|
|
|
|
Moray Firth
|
115
|
4
|
|
|
North East
|
268
|
|
|
|
Forth and Tay
|
42
|
|
|
|
Offshore Marine Region
|
Pipeline length (kms)
|
Active platforms and FPSO*
|
Abandoned, Not in use, Removed platforms & FPSO*
|
|
Faroe Shetland Channel
|
63
|
|
|
|
North and West Shetland Shelf
|
1,880
|
10
|
2
|
|
East Shetland Shelf
|
3,347
|
28
|
6
|
|
North Scotland Shelf
|
128
|
2
|
|
|
Fladen and Moray Firth Offshore
|
4,407
|
43
|
10
|
|
Long Forties
|
3,803
|
25
|
1
|
|
Total (2019)
|
14,801
|
112
|
19
|
|
Total (2011)
|
12,804
|
103
|
N/A
|
Contribution to the economy
The oil and gas industry is central to Scotland and the UK’s economy. In 2018 the Gross Value Added (GVA) from oil and gas production in Scotland was estimated to be £16.2 billion representing 9% of Scotland’s GDP (Scottish Government, 2019a) and contributing around £24 billion (1.2%) to UK GDP. GVA is the value of goods and services produced minus the cost of raw materials and other inputs used to produce them. Gross Domestic Product, abbreviated as GDP, is the total value of goods and services produced in a country.
The economic contribution of pipelines is included in the overall oil and gas value as they are part of the production process. Although pipelines do not have a direct economic contribution, they enable cost effective supply of oil and gas from the offshore fields.
Offshore activity is supported by a highly specialised supply chain which generated £27 billion of revenue in the UK in 2017 (Oil and Gas UK, 2019a).
Since responsibility for the oil and gas sector is reserved to the UK Government, all taxes go to the UK Treasury. Production from the UKCS has contributed significantly to UK tax revenues, with approximately £334 billion (in 2017-18 prices) paid since 1970-71 (NAO, 2019).
The oil and gas industry continues to be a major employer. Oil & Gas UK estimates that in 2018 some 101,400 Scottish based jobs were supported by the servicing of activity on the UKCS and in the export of oil and gas related goods and services. This includes not just direct employment but also wider effects on the supply chain. Overall, 39% of all jobs supported by the oil and gas industry are based in Scotland (Oil & Gas UK, 2019b).
The oil and gas sector remains vital to both the UK and Scottish economies. The North Sea remains an attractive place to invest, with around £11.3 billion of operating and capital expenditure in 2018 alone (Scottish Government, 2019b).
Decommissioning accounted for around 8 per cent of overall UKCS oil & gas industry expenditure in 2018 (Oil & Gas UK, 2018a).
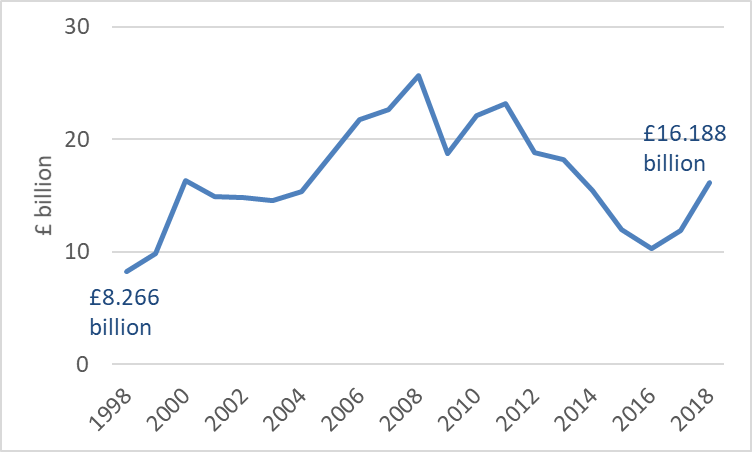
Figure 3 : GVA associated with Scottish Oil and Gas production. Source: Energy Statistics Database. Scottish Government (2019a).
.")
Figures a to e give a more detailed breakdown of production in the Scottish sector. Figure d in particular highlights the significance of production in the East Shetland Shelf, Fladen and Moray Firth Offshore and Long Forties Offshore Marine Regions. Table d highlights the overall associated revenues.
In addition to the contribution from oil and gas extraction, are the services that support the extraction of oil and gas. The support activities are largely exploration and test drilling, but also look ahead to oil and gas decommissioning, where there is substantial potential for economic growth. Scotland’s Marine Economic Statistics (Scottish Government, 2019d), which includes the direct contribution of these support activities, but not the oil and gas extraction, report that Oil and gas support activities are the largest contributors of turnover and GVA in the marine economy (see Figure f).
The 77.2 million tonnes of oil equivalent (Mtoe) in 2018 represents 95% of UK crude oil and natural gas liquids (NGL) production, and 62% of UK natural gas production. The approximate sales value of this was estimated at £24.8 billion, accounting for 88% of the UK total.
|
|
2014
|
2015
|
2016
|
2017
|
2018
|
|
|
£M
|
|
|||
|
Crude Oil and Natural Gas Liquids (£M)
|
17,075
|
12,393
|
11,765
|
14,952
|
20,401
|
|
Natural Gas (£M)
|
3,537
|
4,270
|
3,537
|
4,083
|
4,367
|
|
Other (£M)
|
1,318
|
1,432
|
1,451
|
1,368
|
1,341
|
|
Total
|
20,659
|
16,662
|
15,303
|
19,035
|
24,768
|
|
|
Million Tonnes of oil equivalent (Mtoe)
|
|
|||
|
Crude oil and Natural Gas Liquids (toe)
|
40.98
|
47.14
|
49.19
|
48.91
|
53.08
|
|
Natural Gas (toe)
|
18.98
|
22.48
|
26.01
|
24.92
|
24.14
|
|
Total
|
59.96
|
69.62
|
75.20
|
73.83
|
77.22
|
 1999-2018 per Scottish Offshore Marine Region and the Moray Firth SMR. Source: Scottish Government (2019c).")
 1999-2018 per Scottish Offshore Marine Region and the Moray Firth SMR. Source: Scottish Government (2019c).")
 1999-2018 per Scottish Offshore Marine Region and the Moray Firth SMR. Source: Scottish Government (2019c).")
.")
. Trend assessments are shown in Table e below.")
|
Combined oil, Natural Gas Liquids, gas (Mtoe)*
|
Change 2014 to 2018
|
|||
|
OMR / SMR
|
Mtoe at 2018
|
Mtoe
|
%
|
|
|
East Shetland Shelf
|
20.0
|
6.6
|
49%
|
↑
|
|
Fladen and Moray Firth Offshore
|
25.8
|
1.0
|
4%
|
↔
|
|
Long Forties
|
23.2
|
8.0
|
52%
|
↑
|
|
Moray Firth (SMR)
|
0.0
|
-0.1
|
-100%
|
↓
|
|
North Scotland Shelf
|
2.0
|
1.0
|
100%
|
↑
|
|
North and West Shetland Shelf
|
5.4
|
0.5
|
9%
|
↑
|
|
All areas
|
76.4
|
17.0
|
29%
|
↑
|
Examples of socio-economic effects
- Employment, both offshore and onshore.
- Transferable skills of use to other sectors, in particular the offshore renewable energy industry.
- Exports of both crude hydrocarbons and refined products.
- Research that can be transferred to other sectors.
- Supply chain benefits to a global market.
- Energy security from indigenous resource.
- Impacts on other sea users.
Pressures on the environment
An OSPAR agreed list of marine pressures is used to help assessments of human activities in the marine environment. The marine pressure list has been adapted for use in Scotland via work on the Feature Activity Sensitivity Tool (FeAST). Oil and gas sector and infrastructure activities can be associated with 25 marine pressures – please read the pressure descriptions and benchmarks for further detail.
The list of marine pressures is used to help standardise assessments of activities on the marine environment, and is adapted from an agreed list prepared by OSPAR Intercessional Correspondence Group on Cumulative Effects (ICG-C) (see OSPAR 2014-02 ‘OSPAR Joint Assessment and Monitoring Programme (JAMP) 2014-2021’ Update 2018’ (Table II).
The Feature Activity Sensitivity Tool (FeAST) uses the marine pressure list to allow users to investigate the sensitivity of Scottish marine features. It also associates all pressures that might be exerted by a defined list of activities at a particular benchmark. The extent and impact of each pressure from a given activity will vary according to its intensity or frequency. The extent and impact of the pressure will also vary depending on the sensitivity of the habitat or species on which it is acting. The existence of multiple activities, and potentially multiple pressures, at specific locations will result in a cumulative impact on the environment.
FeAST is a developing tool. A snap shot from 2019 was used for the development of SMA2020. Please consult the FeAST webpage for further information and up to date information.
The list of pressures below associated with this activity is given in alphabetical order. Clicking the pressure will give you more information on the pressure and examples of how it may be associated with the activity.
Forward look
Scottish waters are a mature oil and gas province but there could be up to 20 billion barrels of oil still recoverable from the UKCS, compared with 44.7 billion produced by the end of 2018. This could sustain production for at least the next 20 years (OGA, 2019a).
In 2018 the industry set out its Vision 2035, a plan developed by Oil & Gas UK (Oil and Gas UK, 2018b) together with Oil & Gas Authority to add a generation of life into the UKCS. The Vision 2035 also outlines how the industry intends to continue to meet the UK’s oil and gas needs from domestic resources, while progressively reducing associated production emissions and developing decarbonisation technologies.
In its Decommissioning Insight Facts and Figures (Oil & Gas UK, 2018a) (publication is updated annually, also see Oil and Gas UK Decommissioning), the industry highlights:
- 203 fields are to undergo decommissioning activity over next decade.
- 2,379 wells are expected to be decommissioned over the next ten years.
- 5,724 km of pipelines are due for decommissioning by 2027.
The timing of decommissioning will be subject to multiple factors such as trends in oil and gas prices, increased recovery from existing fields, future fiscal and regulatory regimes, reduction of decommissioning costs and technical innovations.
A potential new activity will be the use of depleted fields to store carbon dioxide captured onshore (see Carbon Capture Utilisation and Storage section).
The future is mainly centred on significant discoveries not yet developed in areas under current licence (Figure g) or regions where oil and gas can be expected to be found but has not yet been explored.
The Oil and Gas UK (OGUK) Pathway to a Net-Zero Basin: Production Emissions Targets Report 2020 includes a commitment to halving operational emissions in the next decade to 2030. It outlines that this target will be achieved through changes to operations, progressive reductions in flaring and venting, and major capital investment programmes aimed at using electricity, rather than gas, to power offshore facilities. The Scottish Energy Strategy (2017) recognises that maintaining domestic oil and gas production can lead to lower net global emissions than under a scenario where Scotland depends more on imports.
There is a significant opportunity for integrating the UK offshore energy, which includes closer links between oil and gas and renewables, can reduce carbon emissions from oil and gas production and longer term actively support delivery of net zero ambitions through technologies such as Carbon Capture and Storage. The UKCS Energy Integration project, led by the Oil and Gas Authority will look to develop a new strategic vision of the UKCS as an integrated energy basin.
. Source: OGA.")
The longevity of the industry will depend on commodity prices, exploration and operational costs over the medium to long term and the ability to secure investment to fund new exploration and extraction activities.
According to Oil & Gas UK, its Vision 2035 strategy could deliver revenues of up to £920 billion through the period of 2016-35, compared with £630 billion without any intervention. Of this total, £420 billion would come from production in the UKCS, and the remaining £500 billion from supply chain increasing its turnover by capturing a larger share of export markets (Oil and Gas UK, 2019a).
The Oil and Gas Authority estimate there to be over 250 fixed installations, over 250 subsea production systems, over 3,000 pipelines (Figure h), and approximately 5,000 wells which will need to be decommissioned (OGA, 2016) although not all in the Scottish sector of the UKCS.

Oil & Gas UK estimates that the industry will spend £15.3 billion over the next decade on decommissioning on the UKCS. Of this spend, 48% will take place in the central North Sea (OMR Long Forties, Fladen and Moray Firth Offshore), 30% in the northern North Sea (OMR East Shetland Shelf), 7% west of Shetland (OMR North and West Shetland Shelf) and 15% in the southern North Sea (not part of this assessment area) (Oil & Gas UK, 2018a).
A potential new activity will be the use of depleted fields to store carbon dioxide captured onshore (see CCUS section). When the geological conditions allow, depleted fields can be used as sites for the storage of gases, although this has not yet been developed in Scottish waters.
The skills and knowledge developed in the North Sea are still vital for the oil and gas sector but are also increasingly valuable to other energy sectors, such as CCUS, hydrogen, offshore wind and wave and tidal.
Economic trend assessment
The offshore hydrocarbon fields are not present in Scottish Marine Regions (SMRs) and so the reporting is on the basis of OMR only. Trends are based on combined oil, Natural Gas Liquids, gas in Mtoe (million tonnes of oil equivalent) and values between 2014 to 2018 (see table in Contribution to the Economy section). Confidence is three stars as based on published national statistics.
Economic trend
Scotland
Based on offshore production between 2014-2018
|
Region assessed |
Trend with confidence |
|
|---|---|---|
|
SSA |
||
|
East Shetland Shelf |
|
|
|
Fladen and Moray Firth Offshore |
|
|
|
Long Forties |
|
|
|
Moray Firth |
|
|
|
North Scotland Shelf |
|
|
|
North and West Shetland Shelf |
|
|
This Legend block contains the key for the status and trend assessment, the confidence assessment and the assessment regions (SMRs and OMRs or other regions used). More information on the various regions used in SMA2020 is available on the Assessment processes and methods page.
Status and trend assessment
|
Status assessment
(for Clean and safe, Healthy and biologically diverse assessments)
|
Trend assessment
(for Clean and safe, Healthy and biologically diverse and Productive assessments)
|
||
|---|---|---|---|
 |
Many concerns |
No / little change |
|
 |
Some concerns |
Increasing |
|
 |
Few or no concerns |
Decreasing |
|
 |
Few or no concerns, but some local concerns |
No trend discernible |
|
 |
Few or no concerns, but many local concerns |
All trends | |
 |
Some concerns, but many local concerns |
||
 |
Lack of evidence / robust assessment criteria |
||
| Lack of regional evidence / robust assessment criteria, but no or few concerns for some local areas | |||
 |
Lack of regional evidence / robust assessment criteria, but some concerns for some local areas | ||
| Lack of regional evidence / robust assessment criteria, but many concerns for some local areas | |||
Confidence assessment
|
Symbol |
Confidence rating |
|---|---|
|
Low |
|
|
Medium |
|
|
High |

Assessment regions
 and the Scottish Offshore Marine Regions (OMRs, O1 – O10)")
Key: S1, Forth and Tay; S2, North East; S3, Moray Firth; S4 Orkney Islands, S5, Shetland Isles; S6, North Coast; S7, West Highlands; S8, Outer Hebrides; S9, Argyll; S10, Clyde; S11, Solway; O1, Long Forties, O2, Fladen and Moray Firth Offshore; O3, East Shetland Shelf; O4, North and West Shetland Shelf; O5, Faroe-Shetland Channel; O6, North Scotland Shelf; O7, Hebrides Shelf; O8, Bailey; O9, Rockall; O10, Hatton.
 Regions. These have been used as the assessment areas for hazardous substances.")
, Regions.")