
Background
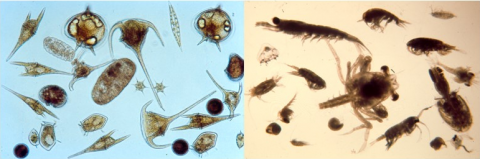
The pelagic habitat is the term used to describe the water column from the sea bed to the surface. The plankton community (phytoplankton and zooplankton) is the component that is used in this assessment. Phytoplankton are single celled microscopic organisms that harness light energy from the sun via photosynthesis. This energy is transferred, via grazing by small animals called zooplankton, to higher levels in the marine foodweb such as shellfish, fish and mammals.
Currently there is no defined threshold to assess if plankton communities are in a ‘good’ or ‘bad’ state. In Scottish waters the diversity of the plankton community can vary with region. Assessing the status of the plankton community over multiple regions thus presents a challenge as they are influenced by multiple pressures including climate change and eutrophication. Long term, high frequency time series e.g. thirty years of data are needed to robustly assess change in the plankton community (Edwards et al., 2010).
This assessment uses plankton data from Scottish waters (Figure 1) generated by government laboratories (Marine Scotland Science), agencies (Scottish Environment Protection Agency – SEPA) and institutes (Continuous Plankton Recorder (CPR) Survey at Marine Biological Association, Scottish Association for Marine Science - SAMS). Plankton taxa were grouped into different ecological life forms. The presence of increasing/decreasing trends in life form abundances and the relationship with sea surface temperature (SST), a proxy for climate change, were investigated. Due to the nature of the statistical methods employed, the full time duration of each data set was used (Bedford et al., 2020).
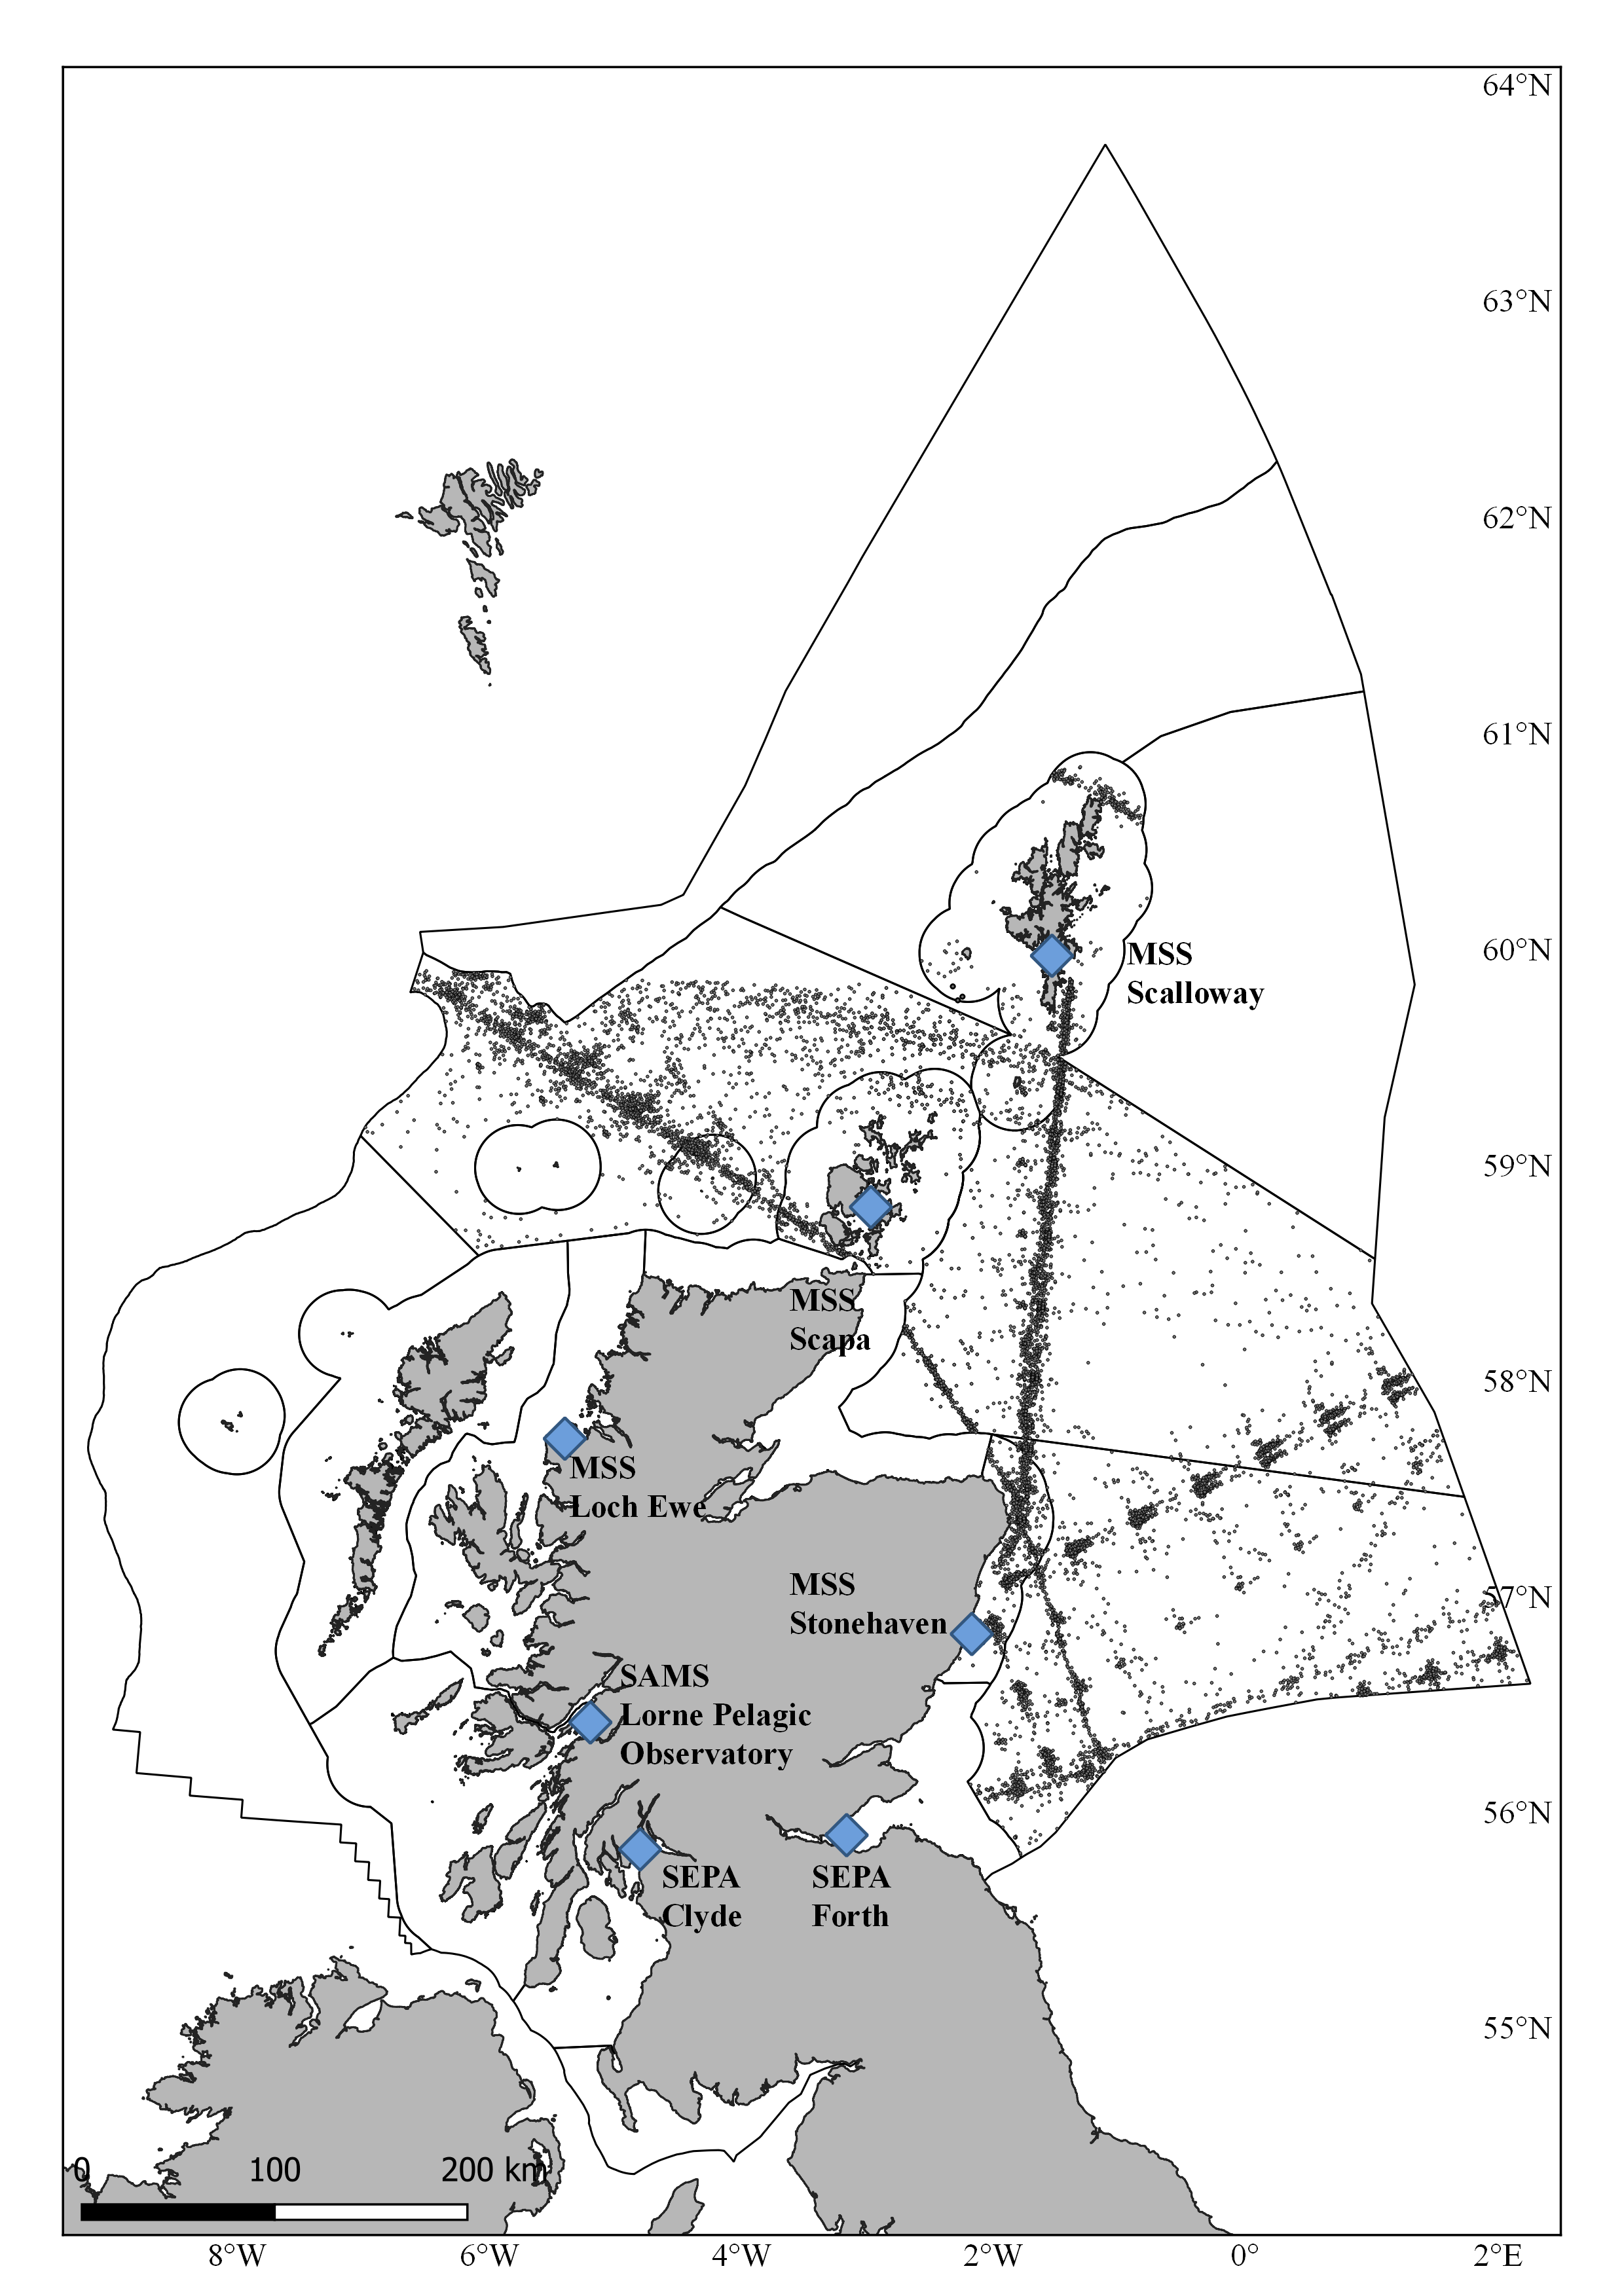
Figure 1: Map showing plankton sampling locations providing data used in the assessment and Scottish Marine Regions (SMRs) and Offshore Marine Regions (OMRs). Blue diamonds = fixed point sampling sites. Grey dots = CPR sampling tracks.
This assessment collates all of the plankton time series data in Scottish waters to facilitate the first investigation of the state of the plankton community to see if it has changed over time. This assessment follows the methodology used by the UK Pelagic Habitat Expert Working Group (Bedford et al., 2020).
Plankton are defined as any organism that cannot swim against a current. They range in size from the smallest microbes (< 0.2 µm in diameter: for context a human hair is roughly 80 µm in diameter) to the largest jellyfish (Castellani & Edwards, 2017). The plankton community plays a critical role in the marine ecosystem, forming the base of the marine food web. Plankton are variable in time and space. As a result high frequency time series data are needed to understand the dynamics and assess changes in the plankton community.
Marine phytoplankton
Marine phytoplankton occupy the base of the food web. Phytoplankton harness light energy from the sun to fix carbon and produce carbohydrates via the process of photosynthesis (primary production). They are an important food source for zooplankton, fish larvae, shellfish and benthic grazers (Chavez, Messie & Pennington, 2011). They also have a number of other very important ecological roles as marine phytoplankton produce approximately 50% of the world’s oxygen and represent an important carbon sink via photosynthesis and other biochemical pathways (Edwards et al., 2020).
The phytoplankton community in Scottish waters follows a strong seasonal cycle with different species recorded at different times of year. There are many different types of phytoplankton and some are very difficult to monitor routinely owing to their small size. The larger phytoplankton, the diatoms (cells with a silica outer shell) (Figure a) and dinoflagellates (cells with two flagellae) (Figure b), are routinely identified and enumerated in many monitoring programmes. The diatom life form can be further divided into pelagic (inhabit the water column) and tychopelagic (normally inhabit the sea bed) life forms to indicate the role of resuspension from the sediment.
Due to the dark and stormy nature of the weather during winter, phytoplankton growth from November to February is very low (Bresnan et al., 2016). Diatoms are more abundant during spring and autumn, while dinoflagellates can dominate the community during the summer months. Other smaller cells such as small flagellates (~20-30 µm diameter), nanoplankton (2 - 20 µm diameter) and picoplankton (0.2 -20 µm diameter) are more difficult to observe routinely and in many instances a different analysis method in required to record these cells accurately.
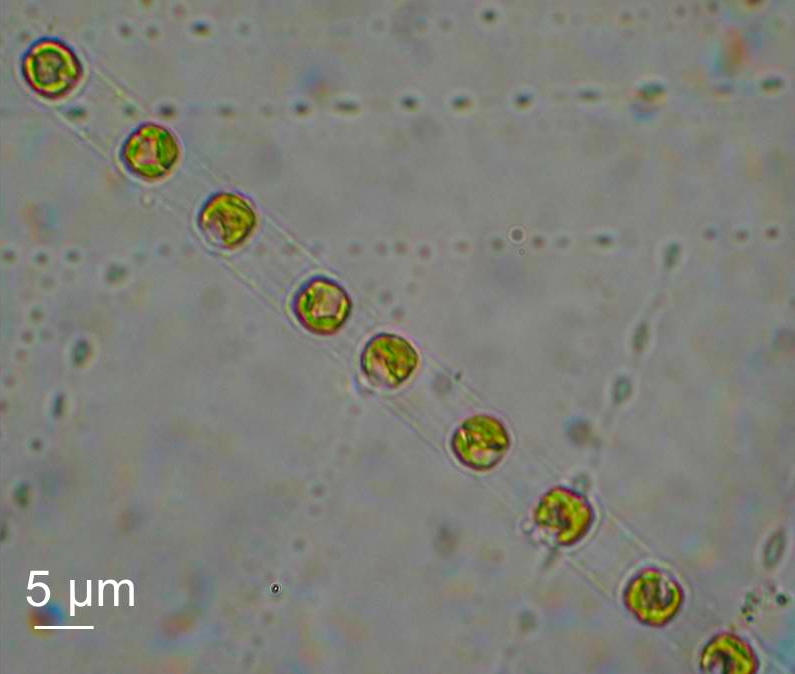
Figure a: Diatom (Skeletonema sp).
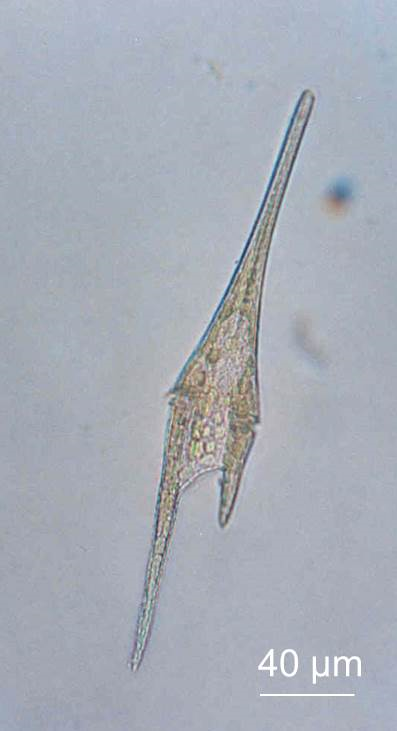
Figure b: Dinoflagellate (Tripos furca).
Some phytoplankton species when they increase in abundance can have a negative impact on the marine ecosystem and the goods and services it produces. These are known as harmful algal blooms (HABs). Some phytoplankton species produce toxins which accumulate in shellfish flesh and pose a risk to human health if consumed. These are reviewed in the ‘Clean and Safe’ Algal toxins assessment. Some phytoplankton species in Scottish waters can cause mortalities of farmed fish through the production of toxins called ichthyotoxins. High biomass blooms can also cause mortalities of the benthos and farmed fish through anoxia during bloom decay. Blooms of species which can irritate fish gills (e.g. Chaetoceros), can also induce mucus formation within the gills resulting in mortalities (Davidson et al., 2009).
Marine zooplankton
Zooplankton are animals with a large size range. Most (e.g. larval stages of some species) need a microscope to be viewed while others, such as jellyfish can be visible to the naked eye. The mesozooplankton (>0.2 mm) are the size fraction that is most routinely sampled. Zooplankton prey on phytoplankton or other zooplankton, and in turn form the main food source for fish larvae and other animals e.g. basking sharks. Zooplankton also play an important role in nutrient and organic matter recycling through their metabolism and life cycles (Ducklow, Steinberg & Bruesseler, 2001). Similar to phytoplankton, zooplankton communities consist of numerous taxa which have a seasonal cycle.
In Scottish coastal waters, the zooplankton community has two annual peaks in abundance, one in spring following the spring diatom bloom and one in late summer or early autumn (O’Brien, Wiebe & Falkenhaug, 2013). Zooplankton numbers are low during winter due to limited food availability. The zooplankton community comprises of a number of animals that spend part of their life cycle in the water column (meroplankton) and animals that live throughout their lifecycle in the water column (holoplankton). Examples of meroplankton (Figure c) include larval stages of commercial fish (e.g. cod, herring), shellfish (scallops, mussels), decapods (crabs, lobsters) and most jellyfish. Copepods (Figure d), a taxonomic group of crustaceans, dominate the holoplankton and are important food source, throughout their lifecycle, for larval and adult fish species (e.g. herring, sandeels).
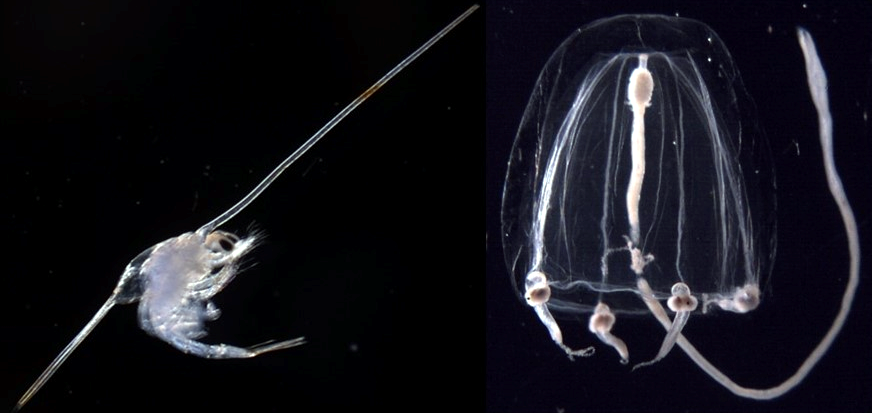
Figure c: Examples of meroplanktonic organisms, decapod larva on the left and gelatinous zooplankton (Sarsia tubulosa) on the right.
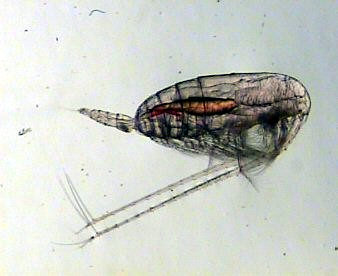
Figure d: Example of holoplanktonic organism, the copepod Calanus sp.
Jellyfish, when present in high numbers, have been linked to negative impacts on tourism, fishing, power generation and aquaculture (Purcell, Uye & Lo, 2007). The nematocysts of some jellyfish can cause physical damage to the gills of farmed fish like salmon and in combination with toxins and bacterial infections contribute to gill disorders (Baxter et al., 2011).
For this assessment, plankton taxa recorded in Scottish waters were grouped into ecological life forms based on their role in the food web and/or life cycle strategies. These life form groupings are adapted from McQuatters-Gollop et al., 2019 and are described in Table a.
| Lifeforms | Description | Importance | |
| Phytoplankton | Diatoms | Single photosynthetic phytoplankton cells with outer silica frustule. | Dominance by dinoflagellates may be an indicator of eutrophication or change in water column stability and may result in less desirable food webs |
| Dinoflagellates | Single phytoplankton cells with two flagellae. Some species are hetero/mixotrophic. | ||
| Large phytoplankton | single celled phytoplankton ≥ 20 µm diameter | Size based indicator of food web structure and energy flow | |
| Small phytoplankton | Single celled phytoplankton < 19 µm diameter | ||
| Pelagic diatoms | Diatoms that inhabit the pelagic water column | Indicator of benthic disturbance and frequency of resuspension events | |
| Tychopelagic diatoms | Diatoms that inhabit benthic sediment or other substrata | ||
| Zooplankton | Small copepods | Crustacea of the taxonomic group Copepoda with body length < 1.9 mm | Size based indicator of food web structure and energy flow |
| Large copepods | Crustacea of the taxonomic group Copepoda with body length ≥ 2 mm | ||
| Holoplankton | Zooplankton taxa who complete all of their life cycle in the water column | Indicator of strength of bentho-pelagic coupling and reproductive output of benthic vs pelagic faunas | |
| Meroplankton | Zooplankton taxa who complete only part of their life cycles in the water column, the remaining being in the benthos (excluding fish eggs and larvae) | ||
| Fish larvae | Larval stages of fish | Indicator of energy flow and possible trophic pathways | |
| Crustaceans | Taxa of the subphylum Crustacea, includes copepods, decapoda larvae, cirripedia larvae | ||
| Gelatinous | Taxa belonging to the Phyla Cnidaria and Ctenophora |
The plankton community is influenced by a variety of physical, chemical and biological drivers. These include temperature, salinity, water column stability, wind and freshwater input. Impacts can been seen over different spatial and temporal scales. Biological drivers such as release/increase in grazing pressure, parasite and viral infections can also impact plankton communities (Edwards et al., 2020). Long term anthropogenic pressures such as climate change have already been identified as having a significant impact on plankton distribution and abundance in the North East Atlantic over the last six decades (Edwards et al., 2002, Beaugrand et al., 2003, Edwards et al., 2006, Hinder et al., 2012) and there is evidence that ocean acidification has impacted the shells of some zooplankton such as pteropods and pelagic gastropod larvae (see Ocean Acidification assessment). Additional anthropogenic drivers include eutrophication, pollutants (chemical, microplastics) fishing pressure and disruption of the sea bed.
Assessing the state of the plankton community presents a challenge. In Scottish waters the diversity of the plankton community can vary with region, with different species and timings of occurrence being recorded at different locations. For example there are differences in species composition between the spring and summer phytoplankton communities in the Clyde and Shetland Islands. Some plankton groups play an important ecological role in the marine food web. Copepods are an important food source for fish larvae, many of which are species of commercial importance.
The 2011 Atlas (Baxter et al., 2011) contained only a very basic description of the plankton community in Scottish coastal waters over the preceding 12 years and no statistical trend was investigated. Since then, considerable progress has been made via the EU Marine Strategy Framework Directive process in developing the plankton life form approach to provide an overall assessment of the status of the plankton community. (Tett et al., 2008; Tett et al., 2013; Dickey-Collas et al., 2017; McQuatters-Gollop et al., 2019; Bedford et al., 2020). This approach allows disparate data sets collected using different methodologies and over different time frames to be assembled and compared. It also means that data sets from multiple institutes as well as longer term time series such as those collected by the Continuous Plankton Recorder (CPR) survey, which extend back multiple decades, can be included in the assessment (Richardson et al., 2006). This provides a much better understanding of how the plankton community has changed over both regional and temporal scales.
Data for this assessment come from a number of sources. These datasets include:
- Marine Scotland Science: Scottish Coastal Observatory (SCObs) (fixed point sites). Full community phytoplankton analysis weekly at Stonehaven, Loch Ewe, Scapa and Scalloway; full zooplankton community analysis weekly at Stonehaven and Loch Ewe. Sea surface temperature data from these sites were used in the analysis. See http://data.marine.gov.scot/dataset/scottish-coastal-observatory-1997-2013-parts-1-3 for more information.
- Marine Biological Association: Continuous Plankton Recorder (CPR). CPR surveys in a number of routes in Scottish waters where phytoplankton and zooplankton taxa are identified and enumerated. More information can be found at https://www.cprsurvey.org/.
- Scottish Association for Marine Science: Lorn Pelagic Observatory (Loch Creran and northern Firth of Lorn) (fixed point site). Sampling every 3 weeks, more frequently during the growing period for phytoplankton, nutrients, CTD deployments. More information can be found at https://www.sams.ac.uk/science/time-series/lorn-pelagic-observatory/.
- Scottish Environment Protection Agency: Water Framework Directive monitoring in the Firth of Forth and the Clyde (fixed point sites). Phytoplankton, zooplankton and environmental parameters (e.g. Sea surface temperature) sampled monthly. More information can be found at https://www.sepa.org.uk/.
- Sea surface temperature data from HADlSST for SMRs and OMRs.
The data from these programmes are collected for a variety of purposes including ecosystem/climate change monitoring, and EU Marine Strategy Framework Directive (MSFD) and EU Water Framework Directive (WFD) monitoring. These datasets cover 7 of the 11 SMRs and 3 of the 10 OMRs (see Figure 1 and Tables b and c for information on coverage). Not all of the plankton life forms are sampled in each of the different monitoring programmes due to the different sampling and analytical methodologies. These details are given in Tables b and c. Sample coverage in SMRs and OMRs in the west and north of Scotland was poor and no assessment could be made in many of these regions.
|
SMR/OMR
|
Time series
|
Institute
|
Duration of dataset used in assessment
|
Life forms
|
|||||
|
Diatoms
|
Dinoflagellates
|
Large phyto
|
Small phyto
|
Pelagic diatoms
|
Tychopelagic diatoms
|
||||
|
SMR
|
|
|
|
|
|
|
|
|
|
|
Forth and Tay
|
Water Famework Directive: Forth
|
Scottish Environment Protection Agency
|
2010 - 2017
|
x
|
x
|
-
|
-
|
x
|
x
|
|
North East
|
Scottish Coastal Observatory: Stonehaven
|
Marine Scotland Science
|
1997-2017
|
x
|
x
|
x
|
x
|
x
|
x
|
|
North East
|
Continuous Plankton Recorder
|
Marine Biological Association
|
1980 - 2017 (excluding 1982)
|
x
|
x
|
-
|
-
|
x
|
x
|
|
Moray Firth
|
-------
|
-------
|
-------
|
-
|
-
|
-
|
-
|
-
|
-
|
|
Orkney Islands
|
Scottish Coastal Observatory: Scapa
|
Marine Scotland Science
|
2001-2017
|
x
|
x
|
x
|
x
|
x
|
x
|
|
Orkney Islands
|
Continuous Plankton Recorder
|
Marine Biological Association
|
2001 (excluding 2003,2010)
|
x
|
x
|
-
|
-
|
x
|
x
|
|
Shetland Islands
|
Scottish Coastal Observatory: Scalloway
|
Marine Scotland Science
|
2008-2017 (excluding 2010)
|
x
|
x
|
x
|
x
|
x
|
x
|
|
Shetland Islands
|
Continuous Plankton Recorder
|
Marine Biological Association
|
1980 - 2017
|
x
|
x
|
-
|
-
|
x
|
x
|
|
North Coast
|
-------
|
-------
|
-------
|
-
|
-
|
-
|
-
|
-
|
-
|
|
West Highlands
|
Scottish Coastal Observatory: Loch Ewe
|
Marine Scotland Science
|
2003-2017
|
x
|
x
|
x
|
x
|
x
|
x
|
|
Outer Hebrides
|
-------
|
-------
|
-------
|
-
|
-
|
-
|
-
|
-
|
-
|
|
Argyll
|
LPO-Loch Creran
|
Scottish Association for Marine Science
|
1970 - 1982, 1999-2015
|
x
|
x
|
x
|
x
|
x
|
x
|
|
Clyde
|
Water Famework Directive: Clyde
|
Scottish Environment Protection Agency
|
2010 - 2017
|
x
|
x
|
-
|
-
|
x
|
x
|
|
Solway
|
-------
|
-------
|
-------
|
-
|
-
|
-
|
-
|
-
|
-
|
|
OMR
|
|
|
|
|
|
|
|
|
|
|
Long Forties
|
Continuous Plankton Recorder
|
Marine Biological Association
|
1958 - 2017
|
x
|
x
|
-
|
-
|
x
|
x
|
|
Fladen and Moray
|
Continuous Plankton Recorder
|
Marine Biological Association
|
1980- 2017
|
x
|
x
|
-
|
-
|
x
|
x
|
|
East Shetland Shelf
|
-------
|
-------
|
-------
|
-
|
-
|
-
|
-
|
-
|
-
|
|
North and West Shetland Shelf
|
-------
|
-------
|
-------
|
-
|
-
|
-
|
-
|
-
|
-
|
|
Faroe-Shetland Channel
|
-------
|
-------
|
-------
|
-
|
-
|
-
|
-
|
-
|
-
|
|
North Scotland Shelf
|
Continuous Plankton Recorder
|
Marine Biological Association
|
1990 (excluding 1991, 1996, 1999)
|
x
|
x
|
-
|
-
|
x
|
x
|
|
Hebrides Shelf
|
-------
|
-------
|
-------
|
-
|
-
|
-
|
-
|
-
|
-
|
|
Bailey
|
-------
|
-------
|
--------
|
-
|
-
|
-
|
-
|
-
|
-
|
|
Rockall
|
-------
|
-------
|
-------
|
-
|
-
|
-
|
-
|
-
|
-
|
|
Hatton
|
-------
|
-------
|
-------
|
-
|
-
|
-
|
-
|
-
|
-
|
|
SMR/OMR
|
Time series
|
Institute
|
Duration of dataset used in assessment
|
Life forms
|
||||||
|
Small copepods
|
Large copepods
|
Holoplankton
|
Meroplankton
|
Fish larvae
|
Crustaceans
|
Gelatinous plankton
|
||||
|
SMR
|
|
|
|
|
|
|
|
|
|
|
|
Forth and Tay
|
Water Famework Directive: Forth
|
Scottish Environment Protection Agency
|
2010 - 2017
|
-
|
-
|
-
|
-
|
-
|
-
|
-
|
|
North East
|
Scottish Coastal Observatory: Stonehaven
|
Marine Scotland Science
|
1997-2017
|
x
|
x
|
x
|
x
|
x
|
x
|
x
|
|
North East
|
Continuous Plankton Recorder
|
Marine Biological Association
|
1980 - 2017 (excluding 1982)
|
x
|
x
|
x
|
x
|
x
|
x
|
-
|
|
Moray Firth
|
-------
|
-------
|
-------
|
-
|
-
|
-
|
-
|
-
|
-
|
-
|
|
Orkney Islands
|
Scottish Coastal Observatory: Scapa
|
Marine Scotland Science
|
2001-2017
|
-
|
-
|
-
|
-
|
-
|
-
|
-
|
|
Orkney Islands
|
Continuous Plankton Recorder
|
Marine Biological Association
|
2001 (excluding 2003,2010)
|
x
|
x
|
x
|
x
|
x
|
x
|
-
|
|
Shetland Islands
|
Scottish Coastal Observatory: Scalloway
|
Marine Scotland Science
|
2008-2017 (excluding 2010)
|
-
|
-
|
-
|
-
|
-
|
-
|
-
|
|
Shetland Islands
|
Continuous Plankton Recorder
|
Marine Biological Association
|
1980 - 2017
|
x
|
x
|
x
|
x
|
x
|
x
|
-
|
|
North Coast
|
-------
|
-------
|
-------
|
-
|
-
|
-
|
-
|
-
|
-
|
-
|
|
West Highlands
|
Scottish Coastal Observatory: Loch Ewe
|
Marine Scotland Science
|
2003-2017
|
x
|
x
|
x
|
x
|
x
|
x
|
x
|
|
Outer Hebrides
|
-------
|
-------
|
-------
|
-
|
-
|
-
|
-
|
-
|
-
|
-
|
|
Argyll
|
LPO-Loch Creran
|
Scottish Association for Marine Science
|
1970 - 1982, 1999-2015
|
-
|
-
|
-
|
-
|
-
|
-
|
-
|
|
Clyde
|
Water Famework Directive: Clyde
|
Scottish Environment Protection Agency
|
2010 - 2017
|
-
|
-
|
-
|
-
|
-
|
-
|
-
|
|
Solway
|
-------
|
-------
|
-------
|
-
|
-
|
-
|
-
|
-
|
-
|
-
|
|
OMR
|
|
|
|
|
|
|
|
|
|
|
|
Long Forties
|
Continuous Plankton Recorder
|
Marine Biological Association
|
1958 - 2017
|
x
|
x
|
x
|
x
|
x
|
x
|
-
|
|
Fladen and Moray
|
Continuous Plankton Recorder
|
Marine Biological Association
|
1980- 2017
|
x
|
x
|
x
|
x
|
x
|
x
|
-
|
|
East Shetland Shelf
|
-------
|
-------
|
-------
|
-
|
-
|
-
|
-
|
-
|
-
|
-
|
|
North and West Shetland Shelf
|
-------
|
-------
|
-------
|
-
|
-
|
-
|
-
|
-
|
-
|
-
|
|
Faroe-Shetland Channel
|
-------
|
-------
|
-------
|
-
|
-
|
-
|
-
|
-
|
-
|
-
|
|
North Scotland Shelf
|
Continuous Plankton Recorder
|
Marine Biological Association
|
1990 (excluding 1991, 1996, 1999)
|
x
|
x
|
x
|
x
|
x
|
x
|
-
|
|
Hebrides Shelf
|
-------
|
-------
|
-------
|
-
|
-
|
-
|
-
|
-
|
-
|
-
|
|
Bailey
|
-------
|
-------
|
--------
|
-
|
-
|
-
|
-
|
-
|
-
|
-
|
|
Rockall
|
-------
|
-------
|
-------
|
-
|
-
|
-
|
-
|
-
|
-
|
-
|
|
Hatton
|
-------
|
-------
|
-------
|
-
|
-
|
-
|
-
|
-
|
-
|
-
|
The methodology used in this assessment follows that of the UK implementation of the EU Marine Strategy Framework Directive (MSFD) and Oslo Paris (OSPAR) Commission pelagic habitat assessments (see Bedford et al., 2020). The assessment method involves grouping plankton taxa from time series data, into ecologically meaningful life forms (Table a). Life forms include taxa that perform similar functions in the ecosystem or have similar biochemical characteristics and lifecycles. Examples include diatoms, dinoflagellates, holoplankton, meroplankton, small and large copepods. The balance between life forms with different functions is important for a resilient ecosystem that can maintain a stable state or return to it after a perturbation driven by natural or anthropogenic pressures. Plankton time series show a high degree of inter and intra annual variability. That is why it is difficult to interpret trend analyses from time series of a short duration (<20 years) with confidence. For this assessment, data from the entire datasets were used. The current six year assessment period is too short a time frame for trends in plankton to be considered statistically robust.
Significant trends, increasing or decreasing, in annual averages of plankton life forms were investigated using a Mann Kendall statistical test. There is no defined threshold to establish whether the plankton communities are in a good or bad state. This assessment depends on a degree of expert judgement based on the potential impacts these trends may have on the marine ecosystem. For example a reduction in diatom abundance means there may be less food available for copepods or benthic animals. A reduction in abundance of copepods means that there will be less food available for adult and larval fish. Potential correlations between lifeforms and environmental drivers were examined using Pearson correlation coefficient and modified Chelton method for probability estimation accounting for autocorrelation. A standardised R script was used. See Bedford et al. (2020) for more information on the methodology. It is important to note that a significant trend does not provide information on the composition of the planktonic communities, but is a first step in assessing if the plankton community is ecologically resilient and has the potential to adapt to pressures such as climate change, ocean acidification, fishing and more. This method will also not identify changes in phenology (timing) of occurrence of different plankton life forms.
Phytoplankton species counts (cells L-1 and CPR data) and zooplankton (individuals m-3 and CPR data) taxa were grouped in relevant lifeforms and transformed using a logarithmic scale (log10x+1). Monthly means were used in the calculation of annual averages for each lifeform and for each data set. In order to determine an annual average, only data sets with high frequency sampling were included in this analysis. As a result some years with gaps in the data (less than 10 months sampling) were discarded e.g. the early years of some CPR tracks and early years of some SCObs sites. SEPA time series had many gaps, which owing to the short duration of these time series made the results difficult to calculate. In this instance, a mean of all available monthly averages from these sites were used to fill these gaps. For the Lorn Pelagic Observatory time series there is a gap of 17 years in the middle of the time series and this needs to be considered when interpreting the results from this dataset.
Each institute has its own quality system for laboratory protocols and data handling procedures. MSS (phytoplankton) and SAMS work within UKAS ISO 17025 accreditation. All organisations participate in IPI phytoplankton and NMBAQC zooplankton exercises as appropriate and there is frequent consultation on identification queries. MSS follows SeaDataNet system for data quality control and quality flagging. The institutes are also active in the UK Pelagic Habitat Working Group for the MSFD PH1 assessment. This assessment follows the life form approach developed by the UK Pelagic Habitat Working Group for the MSFD which has been published in the peer review literature (McQuatters-Gollop et al., 2019; Bedford et al., 2020).
Results
Analysis of the full time series of data reveals significant trends in the abundance of selected plankton life forms in SMRs and OMRs. A summary of trends is given in Tables 1 and 2.
|
Lifeform
|
Forth
|
North East
|
Orkney Islands
|
Shetland Islands
|
West Highlands
|
Argyll
|
Clyde
|
|||
|
SEPA (2010-2017*)
|
SCObs Stonehaven (1999-2017)
|
CPR (1980-2017)
|
SCObs Scapa (2001-2017*)
|
CPR (2001-2017*)
|
SCObs Scalloway (2008-2017)
|
CPR (1980-2017)
|
SCObs Loch Ewe (2003-2017)
|
SAMS Loch Creran (1970- 2015*)
|
SEPA (2010-2017)*
|
|
|
Diatoms
|
↔
|
↔
|
⭧
|
⭧
|
⭧
|
↔
|
⭧
|
↔
|
⭨ |
↔
|
|
Dinoflagellates
|
↔
|
↔
|
↔
|
↔
|
↔
|
↔
|
↔
|
⭧
|
↔ |
↔
|
|
Large phytoplankton
|
nd
|
↔
|
nd
|
⭧
|
nd
|
↔
|
nd
|
↔
|
nd |
nd
|
|
Small phytoplankton
|
nd
|
↔
|
nd
|
↔
|
nd
|
↔
|
nd
|
↔
|
nd |
nd
|
|
Pelagic diatoms
|
↔
|
↔
|
⭧
|
⭧
|
↔
|
↔
|
⭧
|
↔
|
nd |
↔
|
|
Tychopelagic diatoms
|
↔
|
↔
|
↔
|
⭧
|
↔
|
↔
|
↔
|
↔
|
nd |
↔
|
|
Small copepods
|
nd
|
↔
|
↔
|
nd
|
↔
|
nd
|
↔
|
⭨
|
nd |
nd
|
|
Large copepods
|
nd
|
↔
|
⭧
|
nd
|
↔
|
nd
|
⭨
|
⭨
|
nd |
nd
|
|
Holoplankton
|
nd
|
↔
|
↔
|
nd
|
⭨
|
nd
|
↔
|
⭨
|
nd |
nd
|
|
Meroplankton
|
nd
|
↔
|
↔
|
nd
|
↔
|
nd
|
⭧
|
⭨
|
nd |
nd
|
|
Fish larvae
|
nd
|
↔
|
↔
|
nd
|
↔
|
nd
|
↔
|
⭨
|
nd |
nd
|
|
Crustaceans
|
nd
|
↔
|
↔
|
nd
|
⭨
|
nd
|
↔
|
⭨
|
nd |
nd
|
|
Gelatinous
|
nd
|
↔
|
nd
|
nd
|
nd
|
nd
|
nd
|
⭨
|
nd |
nd
|
|
|
* a number of missing data points
|
|
|
*excluding 2003, 2010
|
|
|
|
*excluding 1982 - 1999
|
* a number of missing data points
|
|
|
Lifeform
|
Long Forties
|
Fladen & Moray Firth
|
North Scotland Shelf
|
|
CPR (1958-2017)
|
CPR (1980-2017)
|
CPR (1990-2017*)
|
|
|
Diatoms
|
↔
|
⭧
|
⭧
|
|
Dinoflagellates
|
⭨
|
↔
|
⭨
|
|
Large phytoplankton
|
nd
|
nd
|
nd
|
|
Small phytoplankton
|
nd
|
nd
|
nd
|
|
Pelagic diatoms
|
↔
|
⭧
|
⭧
|
|
Tychopelagic diatoms
|
↔
|
↔
|
↔
|
|
Small copepods
|
⭨
|
↔
|
↔
|
|
Large copepods
|
⭨
|
⭨
|
↔
|
|
Holoplankton
|
⭨
|
↔
|
↔
|
|
Meroplankton
|
⭧
|
⭧
|
⭧
|
|
Fish larvae
|
⭧
|
↔
|
↔
|
|
Crustaceans
|
⭨
|
↔
|
↔
|
|
Gelatinous
|
nd
|
nd
|
nd
|
|
|
|
|
* excluding 1991, 1996, 1999
|
Diatoms show a significant increasing trend since the 1980s in SMRs in the north and east of Scotland i.e. North East (CPR), Orkney (SCObs, CPR), Shetland (CPR), Fladen and Moray (CPR) and North Scotland Shelf (CPR). This is coincident with an increase in phytoplankton biomass as determined by the Plankton Colour Index (PCI), determined by the CPR. This increase in diatoms also led in some instances to increases in associated life forms such as pelagic diatoms and large phytoplankton. There is only one time series (CPR: Long Forties) where the dataset extends back to the 1960s. This time series shows a declining trend in diatoms from 1960s – 1980s, followed by a subsequent increase. The Lorn Pelagic Observatory showed a decrease in abundance but there is a gap of 17 years in the time series of data. No trend was observed in sites in the Forth and Clyde but this could be an artefact of the short duration of the time series.
Dinoflagellates in Long Forties (CPR) and North Scotland Shelf (CPR) show a significant decreasing trend, while the SCObs monitoring site at Loch Ewe (West Highlands) showed an increasing trend. Data from other SMRs did not show any significant trends.
Large copepods show significant declining trend in Long Forties (CPR), Fladen and Moray Firth (CPR) and Shetland (CPR) whereas at North East (CPR) the trend was positive. Small copepods, more abundant than large copepods, show significant decreasing trend only at Long Forties (CPR). Meroplankton show significant increase in Long Forties (CPR), Fladen and Moray Firth (CPR), Shetland (CPR) and North Scotland Shelf (CPR).
The short duration of fixed point monitoring sites meant that trends identified were in the main not significant. This could be due to the short number of years compared with CPR data and assessing trends using these fixed point datasets will improve in the future as the duration of these time series increases. Some sites, however, show changes in many life forms e.g. zooplankton in Loch Ewe with negative trends for all life forms. The paucity of data from the west and northern areas mean that the plankton community in these regions have not been assessed.
Examples of trend plots for the different life forms are presented in Figure 2a, 2b, 2c, 2d and 2e.


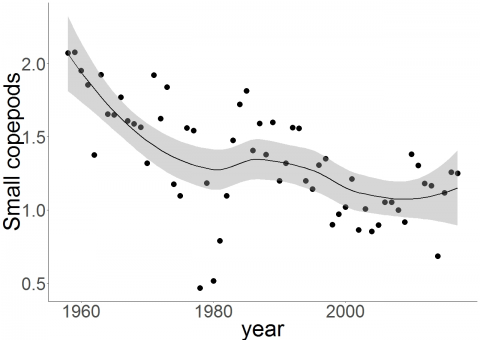

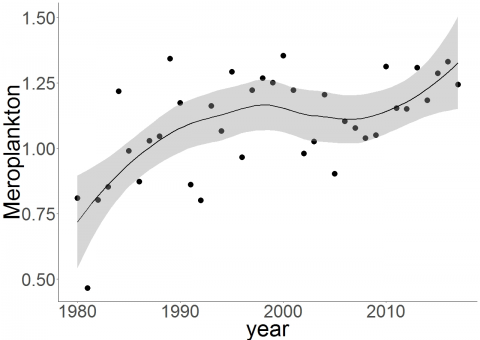
Figure 2: Example plots showing trends in log10(x+1) annual abundances of (a) Diatoms: CPR –North East, (b) Dinoflagellates: MSS- Loch Ewe, (c) Small copepods: CPR-Long Forties, (d) Large copepods: CPR-Long Forties, (e) Meroplankton: CPR-Fladen & Moray. The Y axis shows cells L-1 (Diatoms and Dinoflagellates) and individuals m-3 (Small and Large copepods, Meroplankton).
The current assessment of temperature in Scottish waters shows that SST is increasing in all Scottish marine and offshore marine regions with the exception of the Hatton OMR. Some plankton life forms in this assessment show a significant correlation with SST (e.g. meroplankton, diatoms in some OMRs, see Tables 1 and 2 highlighted in purple) while no correlation was observed between other lifeforms and temperature in all the regions assessed. This suggests that influences other than temperature are also driving observed changes.
The Atlas in 2011 (Baxter et al., 2011) did not present a formal assessment of the pelagic habitat community. New methodologies developed since then as part of the EU Marine Strategy Framework Directive implementation and OSPAR Commission assessment processes have improved confidence in assessing changes in the plankton community (McQuatters-Gollop et al., 2019; Bedford et al., 2020). For the first time, all of the plankton data in Scotland have been used to perform an assessment. Some time series were not of sufficient duration to assess trends robustly. These time series will grow in importance as their duration increases into the future. Lack of data from west and northern SMRs and OMRS restricts the ability to properly assess the plankton community in all regions in Scottish waters.
Life forms from all available datasets were analysed and the trend results are presented in Tables d, e and f. Only significant trends are discussed here.
| SMR | Forth | North East | Orkney Islands | |||||||
| Time series/Site | SEPA: Forth (2010-2017*) | SCObs: Stonehaven (1999-2017) | CPR (1980-2017) | SCObs: Scapa (2001-2017*) | CPR (2001-2017*) | |||||
| Trend statistics | z score | p | z score | p | z score | p | z score | p | z score | p |
| Diatoms | 0.3712 | 0.7105 | 0.51335 | 0.6077 | 3.7275 | 0.0002 | 3.4847 | 0.0005 | 1.3856 | 0.1659 |
| Dinoflagellates | 0.61859 | 0.5362 | 1.54 | 0.1235 | -1.8441 | 0.0652 | 1.3636 | 0.1727 | -0.1979 | 0.8431 |
| Large phytoplankton | nd | nd | 1.0569 | 0.2906 | nd | nd | 3.4847 | 0.0005 | nd | nd |
| Small phytoplankton | nd | nd | 0.5133 | 0.6077 | nd | nd | 1.2878 | 0.8926 | nd | nd |
| Pelagic diatoms | 0.3711 | 0.7015 | 0.90501 | 0.9278 | 3.9106 | 0.0001 | 2.8787 | 0.0040 | 0.9897 | 0.3223 |
| Tychopelagic diatoms | -1.113 | 0.2655 | 0.45295 | 0.6506 | -0.4319 | 0.6657 | 2.5757 | 0.01 | 0.0000 | 1.0000 |
| Small copepods | nd | nd | -1.6093 | 0.1075 | 0.3772 | 0.7061 | nd | nd | -1.7815 | 0.0748 |
| Large copepods | nd | nd | -0.8396 | 0.4011 | 2.8915 | 0.0038 | nd | nd | -1.0887 | 0.2763 |
| Holoplankton | nd | nd | -1.6093 | 0.1075 | 1.0058 | 0.3145 | nd | nd | -1.9795 | 0.0478 |
| Meroplankton | nd | nd | 0.2099 | 0.8337 | 0.9052 | 0.3654 | nd | nd | 0.0000 | 1.0000 |
| Fish larvae | nd | nd | -0.6997 | 0.4841 | -0.1257 | 0.9000 | nd | nd | -0.7918 | 0.4285 |
| Crustaceans | nd | nd | -1.8192 | 0.0689 | 0.2263 | 0.8210 | nd | nd | -3.0682 | 0.0022 |
| Gelatinous | nd | nd | 1.1195 | 0.2629 | nd | nd | nd | nd | nd | nd |
| * a number of missing data points | *excluding 2003, 2010 | *excluding 2003, 2010 | ||||||||
| SMR | Shetland Islands | West Highlands | Clyde | |||||||
| Time series/Site | SCObs: Scalloway (2008-2017) | CPR (1980-2017) | SCObs: Loch Ewe (2003-2017) | SAMS: Loch Creran (1970-2015*) | SEPA: Clyde (2010-2017)* | |||||
| Trend statistics | z score | p | z score | p | z score | p | z score | p | z score | p |
| Diatoms | 0.3152 | 0.7526 | 3.0927 | 0.0020 | -0.2969 | 0.7665 | -0.32 | 0.02 | 1.2372 | 0.9015 |
| Dinoflagellates | 0.8554 | 0.3923 | -1.5338 | 0.1251 | 3.0682 | 0.0022 | -0.02 | 0.88 | 0.61859 | 0.5363 |
| Large phytoplankton | 1.0355 | 0.3004 | nd | nd | 0.5938 | 0.5526 | nd | nd | nd | nd |
| Small phytoplankton | 0.4953 | 0.6204 | nd | nd | 0.5938 | 0.5526 | nd | nd | nd | nd |
| Pelagic diatoms | 0.5853 | 0.5584 | 2.7407 | 0.0061 | 1.2867 | 0.1982 | nd | nd | 0.1237 | 0.9015 |
| Tychopelagic diatoms | 1.2156 | 0.2241 | 0.0000 | 1.0000 | -0.3959 | 0.6922 | nd | nd | 1.8558 | 0.06349 |
| Small copepods | nd | nd | 0.2514 | 0.8015 | -3.1672 | 0.0015 | nd | nd | nd | nd |
| Large copepods | nd | nd | -2.0618 | 0.0392 | -3.7610 | 0.0002 | nd | nd | nd | nd |
| Holoplankton | nd | nd | 1.3326 | 0.1827 | -3.5631 | 0.0004 | nd | nd | nd | nd |
| Meroplankton | nd | nd | 3.0927 | 0.0020 | -2.9690 | 0.0029 | nd | nd | nd | nd |
| Fish larvae | nd | nd | -1.0816 | 0.2794 | -2.7713 | 0.0056 | nd | nd | nd | nd |
| Crustaceans | nd | nd | -0.3520 | 0.7248 | -3.4641 | 0.0005 | nd | nd | nd | nd |
| Gelatinous | nd | nd | nd | nd | -1.9795 | 0.0478 | nd | nd | nd | nd |
| *excluding 2005 | *excluding 1982 - 1999 | *a number of missing data points | ||||||||
| OMR | Long Forties | Fladen & Moray Firth | North Scotland Shelf | |||
| Time series/Site | CPR (1958-2017) | CPR (1980-2017) | CPR (1990-2017*) | |||
| Trend statistics | z score | p | z score | p | z score | p |
| Diatoms | -0.7590 | 0.4479 | 3.9979 | 0.0000 | 2.1720 | 0.0299 |
| Dinoflagellates | -3.8842 | 0.0001 | -0.1760 | 0.8603 | -2.1720 | 0.0299 |
| Large phytoplankton | nd | nd | nd | nd | nd | nd |
| Small phytoplankton | nd | nd | nd | nd | nd | nd |
| Pelagic diatoms | -0.5168 | 0.6052 | 4.0482 | 0.0001 | 2.2654 | 0.0235 |
| Tychopelagic diatoms | -0.2870 | 0.7741 | 1.5233 | 0.1277 | 1.0535 | 0.2921 |
| Small copepods | -5.3511 | 0.0000 | -0.7040 | 0.4814 | -1.3779 | 0.1682 |
| Large copepods | -2.5575 | 0.0105 | -2.1121 | 0.0347 | 0.0234 | 0.9814 |
| Holoplankton | -4.8536 | 0.0000 | -0.1509 | 0.8801 | 0.2102 | 0.8335 |
| Meroplankton | 4.5857 | 0.0000 | 3.3190 | 0.0009 | 3.2931 | 0.0010 |
| Fish larvae | 3.8969 | 0.0001 | 0.9555 | 0.3393 | 1.1444 | 0.2525 |
| Crustaceans | -5.8613 | 0.0000 | -0.9555 | 0.3393 | -0.3503 | 0.7261 |
| Gelatinous | nd | nd | nd | nd | nd | nd |
| * excluding 1991, 1996, 1999 | ||||||
A significant increasing trend in diatoms was observed in SMRs in the north and east of Scotland i.e. North East (CPR), Orkney (SCObs, CPR), Shetland (CPR), Fladen and Moray (CPR) and North Scotland Shelf (CPR). This is coincident with an increase in phytoplankton biomass as determined by the Plankton Colour Index (PCI), determined by the CPR. This increase in diatoms, also led in some instances, to increases in associated life forms such as pelagic diatoms and large phytoplankton. In general, abundances of tychopelagic diatoms were low in all datasets with a high abundance of zero values. A correlation between SST and diatoms abundances was observed in Fladen and Moray (CPR, p = 0.0001), North East (CPR, p= 0.022), North Scotland Shelf (CPR, p=0.030), Long Forties (CPR, p= 0.014) and Shetland (CPR, p = 0.017).
A significant increasing diatom trend was recorded at the coastal Orkney site (SCObs, Scapa), but not in the CPR data from that region, while conversely no significant trend in diatom abundances was recorded at the coastal Shetland site (SCObs, Scalloway) while an increasing trend was observed offshore (Shetland, CPR). Diatom abundances from coastal sites in the North East (SCOBs, Stonehaven) and Forth (SEPA, Firth of Forth) show no significant trend. Fixed point coastal data on the west coast from the Clyde (SEPA) and Loch Ewe (West Highlands) show no clear trend in diatom abundance and the Lorn Pelagic Observatory (Argyll) shows a decline since the 1970s, albeit with a gap of almost two decades in the middle. No correlation between diatom abundances and SST was observed at the coastal sites with the exception of the Lorn Pelagic Observatory where a significant inverse relationship has been recorded (Whyte et al., 2017).
Investigation of CPR diatom datasets with significant increasing trends suggest an increase in diatom genera observed during the spring bloom period such as Skeletonema (Aphia ID: 149073), Chaetoceros (Aphia ID: 148985) and Thalassiosira (Aphia ID: 148912). In contrast, the Lorn Pelagic Observatory shows a decrease in diatom abundance, especially Skeletonema since the 1970s (Whyte et al., 2017).
Dinoflagellates in Fladen and Moray (CPR), North East (CPR), North Scotland Shelf (CPR) show a significant decreasing trend, while the SCObs monitoring site at Loch Ewe (West Highlands) show a significant increasing trend. Data from other SMRs and OMRs did not show any significant trends. No correlation between dinoflagellate abundances and SST was observed over the duration of the datasets used. It should be noted that the dinoflagellate cell count in CPR datasets is influenced by larger thecate species such as Tripos (Aphia ID: 494057), whereas smaller, more fragile species such as athecate dinoflagellates are recorded more frequently in the coastal sites. Whether this is an artefact of the difference between the community composition between coastal and offshore populations or the difference in sampling and preservation methodologies requires more investigation.
Zooplankton data were available from 7 out of 21 SMRs and OMRs, with the North East represented by both SCObs and CPR data (Tables b and c). The majority of datasets cover the east and north of Scotland, however most of the offshore regions lacked zooplankton data. Similarly, coastal regions of the mainland are represented only by two SCObs sites Loch Ewe (west) and Stonehaven (east). Due to the short duration of SEPA zooplankton monitoring, these data were not included in the current assessment.
At coastal SMRs, all zooplankton lifeforms show a significant declining trend at Loch Ewe SCObs site (West Highlands) whereas at Stonehaven SCObs site (North East) no significant trend was observed. At Loch Ewe a decline in total zooplankton densities has been recorded since 2010 and across all taxa (Figure e).
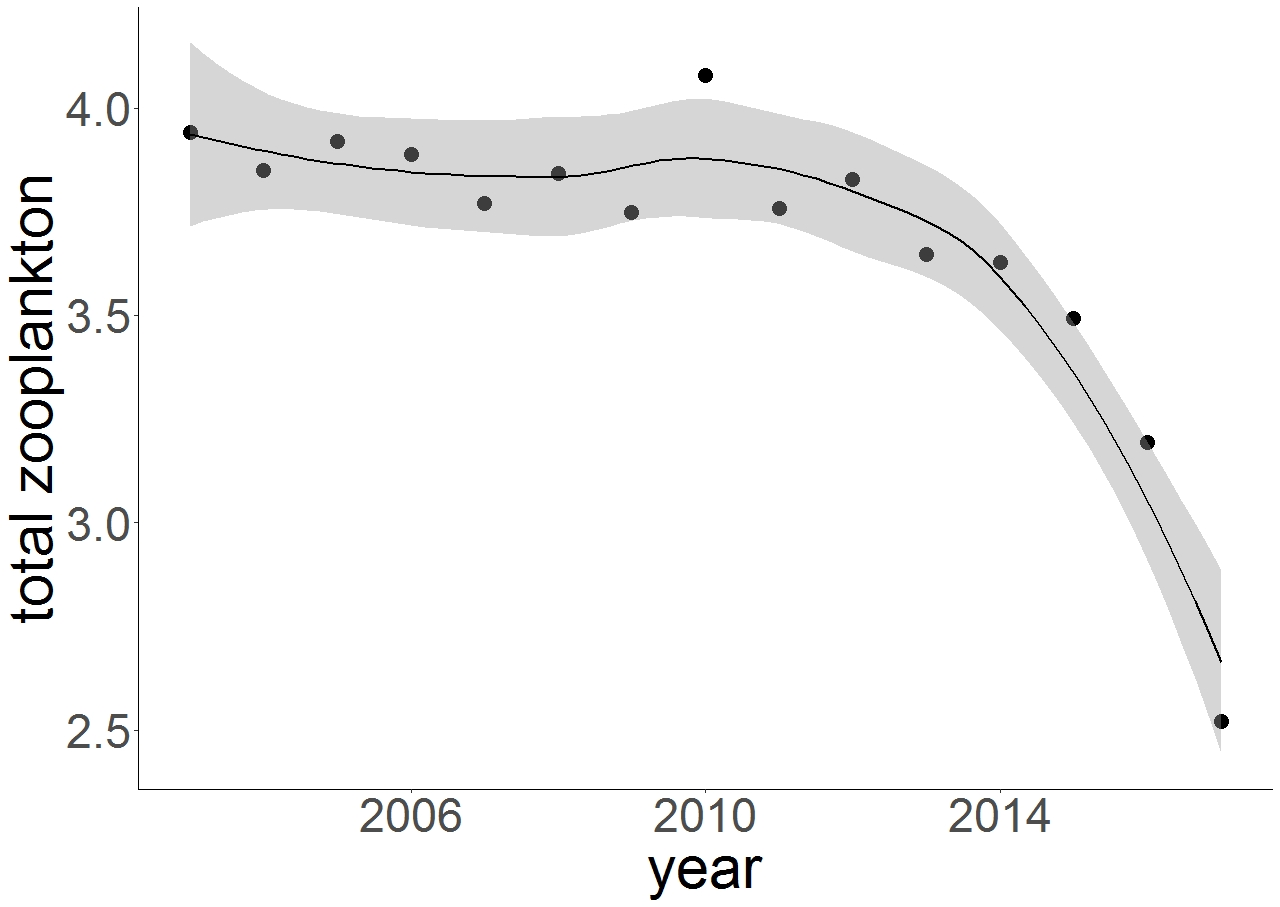
Figure e: Plot showing trend in log10(x+1) annual abundances of total zooplankton at Loch Ewe (individuals m-3).
Large copepods show significant declining trends in Long Forties (CPR), Fladen and Moray Firth (CPR) and Shetland (CPR) whereas in the North East (CPR) the trend was positive. The difference in detecting a trend from CPR data in the North East SMR but not from SCObs could be attributed to the duration of the CPR dataset which starts in 1980, while SCObs starts in 1999. The most abundant taxon of large copepods, from a total of 51 taxa, are Calanus finmarchicus (Aphia ID: 104464) and C. helgolandicus (Aphia ID: 104466). The detected trend for each species (adult C. finmarchicus and C. helgolandicus) and the copepodites CI-IV varied between Marine Regions and are presented in Table g.
|
|
|
SMR/OMR
|
|||||
|
Lifeform
|
Taxon
|
North East
|
Long Forties
|
Fladen & Moray
|
Shetland
|
North Scotland Shelf
|
Orkney
|
|
Large copepods
|
Calanus spp. CI-IV
|
⭧
|
⭨
|
↔
|
↔
|
|
|
|
Calanus finmarchicus
|
↔
|
⭨
|
⭨
|
⭨
|
|
|
|
|
Calanus helgolandicus
|
⭧
|
⭧
|
⭧
|
↔
|
|
|
|
|
Small copepods
|
Paracalanus spp. and Pseudocalanus spp. CI-CVI
|
|
⭨
|
|
|
|
|
|
Oithona spp.
|
|
⭨
|
|
|
|
|
|
|
Pseudocalanus spp. adults
|
|
⭨
|
|
|
|
|
|
|
Centropages typicus
|
|
⭧
|
|
|
|
|
|
|
Meroplankton
|
Echinoderm larvae
|
|
⭧
|
⭧
|
⭧
|
⭧
|
|
|
Bivalve larvae
|
|
⭨
|
⭨
|
⭨
|
↔
|
|
|
|
Bryozoa larvae
|
|
⭧
|
⭧
|
↔
|
⭧
|
|
|
|
Cirripedia larvae
|
|
⭧
|
↔
|
↔
|
⭧
|
|
|
|
Decapoda larvae
|
|
↔
|
⭧
|
⭧
|
↔
|
|
|
|
Crustacea
|
Copepoda
|
|
⭨
|
|
|
|
⭨
|
|
Cladocera
|
|
↔
|
|
|
|
⭨
|
|
|
Cirripedia larvae
|
|
⭧
|
|
|
|
↔
|
|
|
Euphausiids
|
|
⭨
|
|
|
|
↔
|
|
|
Holoplankton
|
Appendicularia
|
|
⭧
|
|
|
|
↔
|
Small copepods, more abundant than large copepods, show significant decreasing trend only at Long Forties (CPR). Meroplankton show significant increase in Long Forties (CPR), Fladen and Moray Firth (CPR), Shetland (CPR) and North Scotland Shelf (CPR). It should be noted that CPR meroplankton does not include gelatinous zooplankton. CPR samples had 13 taxa in this life form whereas SCObs had 48 for Stonehaven and 43 for Loch Ewe. The most abundant taxa included the larvae of echinoderms (Aphia ID: 1806), bivalves (Aphia ID: 105), bryozoa (Aphia ID: 146142), cirripedes (Aphia ID: 1082) and decapods (Aphia ID: 1130). Although there is a positive significant trend for total meroplankton in some areas, bivalve larvae had a consistent negative trend when significant (Table g).
Crustacea and holoplankton show decreasing trends at Long Forties (CPR) and Orkney (CPR). Crustacean zooplankton includes all the copepods, which are the biggest contributor numerically in the group, as well as other taxa for example cladocera (Aphia ID: 1076), amphipods (Aphia ID: 1135), cirripedia larvae, euphausiids (Aphia ID: 1128) and decapod larvae. The negative trend at both regions is driven mainly by copepods with trends in the remaining taxa showing differences between regions.
For holoplankton the main contributor is crustacean zooplankton the abundance of which drives the negative trends. Non crustacean taxa within the holoplanktonic life form, which had high densities, were Tomopteris (Aphia ID: 129715), Chaetognatha (Aphia ID: 2081) and Appendicularia (Aphia ID: 103357). Only Appendicularia at Long Forties had a significant increasing trend (Table g). The only significant increasing trend in fish larvae was observed in Long Forties (CPR).
Sea surface temperature (SST) show an increasing significant trend in all regions and a detailed description can be found in the temperature assessment. When examining potential correlations between lifeforms and SST there was a significant positive correlation with only two life forms: meroplankton at Long Forties (CPR, p = 0.0437), Fladen and Moray Firth (CPR, p = 0.0266), Shetland (CPR, p = 0.0049) and North Scotland Shelf (CPR, p = 0.0193); and fish larvae at Fladen and Moray (CPR, p = 0.0272). However, from all the meroplanktonic taxa, only echinoderm larvae had a positive correlation with SST (with the exception of Long Forties) as well as decapod larvae in Fladen and Moray Firth Offshore, Shetland and bryozoa at Long Forties. At SCObs monitoring sites none of the zooplankton life forms had a significant correlation with SST.
Conclusion
This assessment reveals that the plankton community in Scottish waters is changing. Results reveal significant changes in the abundance of a number of plankton life forms over the last three decades. Some of the changes observed include increasing trends in diatoms and meroplankton and declining trends in large and small copepods, crustacean and holoplankton lifeforms. These are consistent with trends reported in the greater North Sea and North Atlantic (Bedford et al., 2020).
The effects of these changes are not known but this observed reorganisation of the plankton community could impact the marine food web as food supply to higher levels of the food web is reduced. For example the decline of small copepods in the OMR Long Forties may result in a lack of food for fish.
There has been significant increase in SST in the SMRs and OMRs in which the pelagic habitat was assessed. A correlation was observed between SST and the abundance of some, but not all, life forms in some regions which suggests that SST is not the only driver influencing change in the plankton community in Scottish waters.
This assessment is in agreement with the UK wide assessment detailed in Bedford et al. (2020).
This assessment has revealed significant changes in multiple plankton life forms in Scottish waters. These include increasing trends in diatom and meroplankton abundance and declining trends in large and small copepods, crustacean and holoplankton lifeforms, and are consistent with trends reported in the greater North Sea and North Atlantic (Bedford et al., 2020). The impacts of these changes are unknown. However these changes have the potential to influence energy flow through the marine food web with a knock on impact on marine ecosystem services. This requires further investigation to provide improved advice to the fishery and aquaculture industries into the future.
Trends for individual taxa within a life form grouping did not all follow the same pattern. For example within the meroplankton life form which had an overall positive trend, bivalve larvae had a negative trend whereas echinoderm larvae had a positive trend. Higher SST (positive correlation with echinoderm larvae) could benefit reproduction and survival of some taxa but other mechanisms could be involved in the decline of commercially important taxa (bivalve larvae) and the balance between benthic and pelagic habitats.
In some instances differences were observed in lifeform trends between more coastal and offshore areas e.g. diatoms in Orkney and Shetland fixed point and CPR datasets. The coastal areas are most prone to certain anthropogenic pressures such as eutrophication and pollution and so a full understanding of pressures and plankton dynamics is required if anthropogenic driven changes in the coastal habitats are to be identified.
Knowledge gaps
The impacts of these observed changes in the plankton community on higher trophic levels of the food web is not known.
Lack of monitoring of micro zooplankton, nano/picoplankton, marine bacteria, viruses and fungi means that these components of the plankton community cannot be assessed. Coastal zooplankton data are sparse and there is a lack of plankton data from the west coast, far west and northern regions.
Cessation of monitoring will increase the number of regions where there is a lack of plankton community data.
Pressure datasets from other variables e.g. carbonate chemistry, nutrient loading, fishing, seabed disturbance are required.
This assessment has shown that the plankton community in Scottish waters is changing. Further work is required to identify the impact of the observed changes on higher trophic levels of the marine food web, particularly species of commercial importance.
Lack of routine monitoring of micro zooplankton, nano/picoplankton marine bacteria, viruses and fungi means that these components of the plankton community cannot be assessed. This knowledge gap has been flagged at the OSPAR Commission level.
Data on the coastal zooplankton community are particularly sparse. There is a lack of plankton community data from the west coast, far west and northern areas, meaning that it is not possible to assess the plankton community in these regions.
The ability to assess the plankton community depends on maintenance of long term monitoring sites. Collection of plankton samples at the Forth and Clyde has stopped while other sites are at risk. Cessation of monitoring activities will generate gaps in knowledge about the behaviour of the plankton community in some regions.
Pressure datasets from other variables e.g. carbonate chemistry, nutrient loading, fishing, seabed disturbance across all regions are required for these to be included in this assessment.
Status and trend assessment
|
Region assessed
|
Status with confidence
|
Trend with confidence
|
|---|---|---|
|
All Scotland
|
 |
|
|
SMRs
|
||
|
Argyll
|
|
|
|
Clyde
|
 |
|
|
Forth and Tay
|
|
|
|
North East
|
|
|
|
Orkney Islands
|
|
|
|
Shetland Isles
|
|
|
| West Highlands |
|
|
|
Western Islands
|
|
|
|
OMRs
|
||
|
Fladen and Moray
|
|
|
|
Long Forties
|
|
|
|
North Scotland Shelf
|
|
|
This Legend block contains the key for the status and trend assessment, the confidence assessment and the assessment regions (SMRs and OMRs or other regions used). More information on the various regions used in SMA2020 is available on the Assessment processes and methods page.
Status and trend assessment
|
Status assessment
(for Clean and safe, Healthy and biologically diverse assessments)
|
Trend assessment
(for Clean and safe, Healthy and biologically diverse and Productive assessments)
|
||
|---|---|---|---|
| |
Many concerns |
No / little change |
|
| |
Some concerns |
Increasing |
|
 |
Few or no concerns |
Decreasing |
|
 |
Few or no concerns, but some local concerns |
No trend discernible |
|
 |
Few or no concerns, but many local concerns |
All trends | |
 |
Some concerns, but many local concerns |
||
 |
Lack of evidence / robust assessment criteria |
||
| Lack of regional evidence / robust assessment criteria, but no or few concerns for some local areas | |||
 |
Lack of regional evidence / robust assessment criteria, but some concerns for some local areas | ||
| Lack of regional evidence / robust assessment criteria, but many concerns for some local areas | |||
Confidence assessment
|
Symbol |
Confidence rating |
|---|---|
|
Low |
|
|
Medium |
|
|
High |

Assessment regions
 and the Scottish Offshore Marine Regions (OMRs, O1 – O10)")
Key: S1, Forth and Tay; S2, North East; S3, Moray Firth; S4 Orkney Islands, S5, Shetland Isles; S6, North Coast; S7, West Highlands; S8, Outer Hebrides; S9, Argyll; S10, Clyde; S11, Solway; O1, Long Forties, O2, Fladen and Moray Firth Offshore; O3, East Shetland Shelf; O4, North and West Shetland Shelf; O5, Faroe-Shetland Channel; O6, North Scotland Shelf; O7, Hebrides Shelf; O8, Bailey; O9, Rockall; O10, Hatton.
 Regions. These have been used as the assessment areas for hazardous substances.")
, Regions.")