Employment - by Travel to Work Areas (TTWA)
What is it:
There are two data layers on MS Maps NMPi:
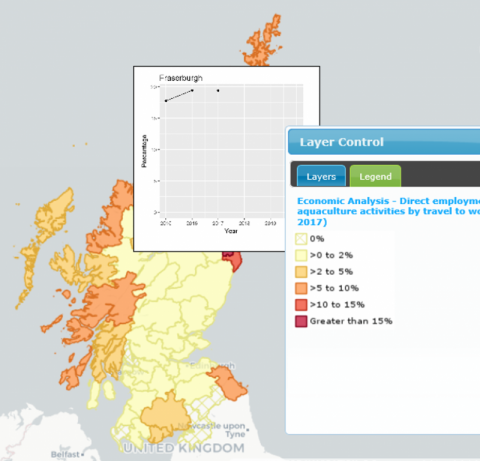
- Economic Analysis - Direct employment in fishing, fish processing and aquaculture activities by travel to work areas (% of total employment, 2012).
- Economic Analysis - Direct employment in fishing, fish processing and aquaculture activities by travel to work areas (% of total employment, 2017) – this layer holds data for 2015, 2016 and 2017. By hovering over a particular area a graph should appear in a pop-up (as in image to the right). Alternatively click on a TTWA and the graph is in the list of attributes.
There are places where non-coastal areas have some employment e.g. fish processing facilities.
Updated economic information (as found in Scotland’s Marine Atlas) can be accessed in ‘Scotland's marine economic statistics’ – see link in ‘Data Sources’ tab at the bottom of the page.
Links to Scotland's Marine Atlas:
Data originators:
This information page is part of the theme:

Economic Analysis - Direct employment in fishing, fish processing and aquaculture activities by travel to work areas (% of total employment, 2017)

