

Background
Eutrophication in the marine environment is the excessive growth of phytoplankton in response to enrichment by nutrients (nitrogen (N) and phosphorus (P)) resulting in an undesirable disturbance in the marine ecosystem. In some instances this can result in the formation of very high cell density algal blooms, which can impact the marine ecosystem by influencing the diversity and abundance of flora and fauna in the water column, increasing water turbidity, depleting oxygen and altering the behaviour of large fauna.
Chlorophyll-a can be used as an indirect means of measuring algal blooms and can be used as an indicator of anthropogenic nutrient enrichment. However this relationship is complicated by other influencing variables such as turbidity, phytoplankton community composition, temperature, grazing and transport processes.
Climate change and ocean acidification can also influence the development of phytoplankton communities via a variety of different mechanisms, e.g. changes to stratification, mixing and ocean currents with effects on availability of nutrients and other minerals, the time of year in which phytoplankton can start growing, the duration of the growing season and interactions with grazers. In general, chlorophyll-a concentrations tend to be greater in coastal areas where levels of anthropogenic/terrestrial nutrient enrichment are also greater.
Nitrogen and phosphorus can enter the sea from a number of natural and anthropogenic sources: direct discharges (e.g. sewage, aquaculture etc.), inputs from rivers, land runoff and atmospheric deposition.
This indicator assesses the levels and trends of chlorophyll-a in each of the eleven Scottish Marine Regions (SMRs) as an indicator of direct eutrophication effects.
The assessment of eutrophication is split into indicators of nutrient enrichment, direct eutrophication effects and indirect eutrophication effects as per the OSPAR and Marine Strategy Framework Directive (MSFD) eutrophication assessment methodology. The components of the OSPAR and MSFD eutrophication assessment methodology that are used are shown in Figure a.
Eutrophication is a problem if there is evidence of nutrient enrichment (Stage 1; inputs & winter nutrients), direct effects of nutrient enrichment (Stage 2; elevated chlorophyll concentration, increased blooms) and indirect effects of nutrient enrichment (Stage 3; oxygen deficiency, biomass changes) (Figure a). This indicator assesses concentrations of chlorophyll-a in marine waters as an indicator of phytoplankton biomass, a direct eutrophication effect.
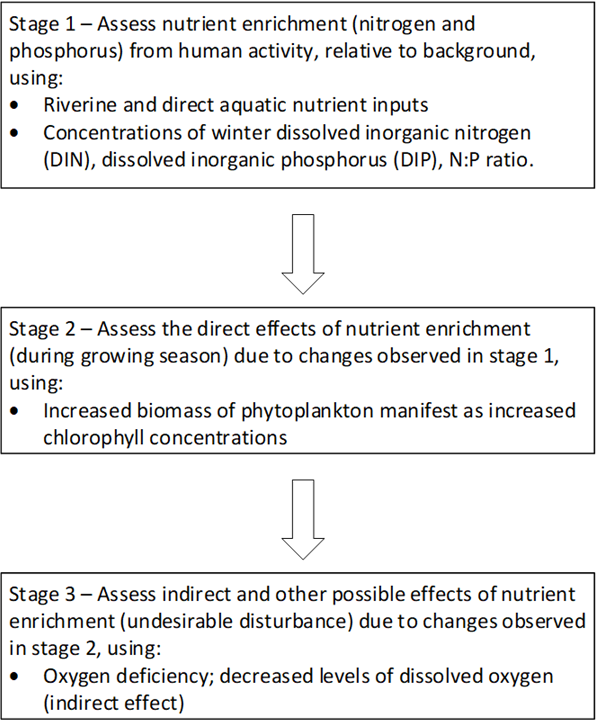 |
| Figure a: The three stages of eutrophication assessment. The criteria Nitrogen/ Phosphorus ratios are not applied in UK waters but used as additional evidence. |
Weekly chlorophyll monitoring is performed by Marine Scotland Science (MSS) at two monitoring locations: Stonehaven, in the North East SMR, and Loch Ewe, in the West Highlands SMR. The Scottish Environment Protection Agency (SEPA) maintains regular surveys in the Firth of Clyde and Firth of Forth. Other ad-hoc data collection may be ongoing at universities and institutes with a marine focus, though these are not centrally recorded.
Chlorophyll-a concentrations are determined using extractive methods and excitation by a fluorometer. For the purposes of clarity within this assessment the term chlorophyll-a has been used, but due to the nature of the fluorometric technique this will include interfering chlorophylls as described in paragraph 3. Some of the chlorophyll data used in this assessment is from field based analogues using multi-parameter sondes. Internal Analytical Quality Control (AQC) for monitoring laboratories involves running a blank sample with each batch of samples, then a solid standard supplied by the fluorometer manufacturer, followed by an instrument performance standard (IPS). SEPA and MSS participate in QUASIMEME (QUASIMEME, 2019) performance studies for the analysis of chlorophyll-a. SEPA and MSS are accredited to ISO17025 for the analysis of chlorophyll-a.
Datasets used for this assessment include those available between January 1990 and December 2018 on the International Council for the Exploration of the Seas (ICES) ICES Oceanographic data portal for the coastal Scottish Marine Regions (SMRs), as well as additional datasets from SEPA and MSS that are not yet uploaded to ICES.
Historically chlorophyll-a data was corrected for interferences from magnesium free chlorophyll derivatives (phaeophytins and phaeophorbides, collectively known as phaeopigments). However, this method is no longer recommended by the OSPAR Joint Assessment and Monitoring Programme (JAMP). Datasets contain both pheophytin corrected and uncorrected chlorophyll-a concentrations, which may result in overestimation of chlorophyll- a.
Data were assembled from each source and mapped onto a GIS layer of coastal SMRs. Records were allocated to each SMR according to their coordinates within the ICES database. Data in areas from transitional water bodies were removed from the analysis. Processes governing phytoplankton growth in estuaries are different to coastal water bodies. Furthermore, trends could be missed where the sampling effort is higher in estuaries relative to coastal water bodies.
Status assessment was against the OSPAR chlorophyll-a concentration criteria of 10 µg L-1 for offshore areas and 15 µg L-1 for coastal areas.
Trend assessment is available for some areas with sufficient data (datasets with 10 or more discrete records of 90th percentile chlorophyll-a concentration, and no more than 3 successive years without data). A Mann-Kendall model on annual 90th percentile chlorophyll-a concentrations was used to determine if a trend was present. If a trend was detected and was significant at alpha of 0.05, a Theil-Sen estimated slope and intercept was used to fit a linear trend line to the dataset. Derivation of the 90th percentile is recommended when handling bulk data aggregated from a number of sources across space and time. The 90th percentile method encompasses the spread of data, while omitting anomalously high values. The 90th percentile concentration was derived for the growing season (March to October).
Trend assessment depends on expert judgement to determine if confidence in trends are high or not. Factors that could reduce confidence include datasets with high variability in sampling effort between years, and time series with missing values for several adjacent years. Trans-boundary effects are not taken into account. Analysis was carried out in R using the ‘Kendall’ and ‘mblm’ packages.
Due to insufficient sampling in various areas, trends could only be presented for some of the SMRs. This is noted in figure legends.
Results
Chlorophyll-a concentrations measured in samples from the 11 coastal Scottish Marine Regions (SMRs), collected during the phytoplankton growing season (March- September) between 1990 and 2018, were compared against OSPAR assessment criteria. Trend analysis was carried out to determine if concentrations were increasing or decreasing.
The 90th percentile chlorophyll-a concentrations in the Clyde and Forth and Tay exceeded the OSPAR criteria of 15 µg L-1 for coastal regions or 10 µg L-1 for offshore regions, in some years (Figure 1). Median chlorophyll-a concentrations were also the highest in these regions. There was a statistically significant increasing trend of 0.21 µg L-1 y-1 in the Forth and Tay, but no statistically significant trend in the Clyde (Figures 1 and 2).
No other SMR had a 90th percentile chlorophyll concentration above OSPAR criteria. No trend could be detected for North East, Orkney Islands, Shetland Isles or West Highlands. Data were insufficient to attempt to detect a trend for Argyll, Moray Firth, North Coast, Outer Hebrides and Solway (Figure 1 and 2). There will also be low confidence that the 90th percentile chlorophyll-a concentration in these data poor regions are below the assessment criteria.
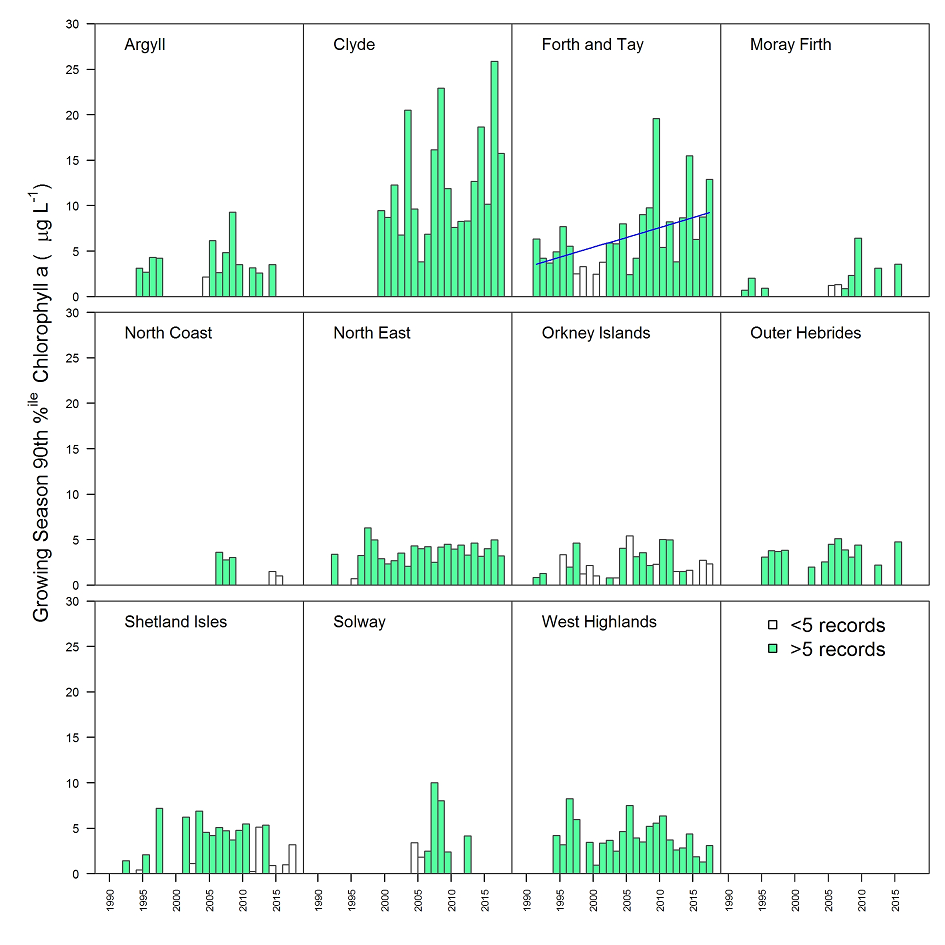
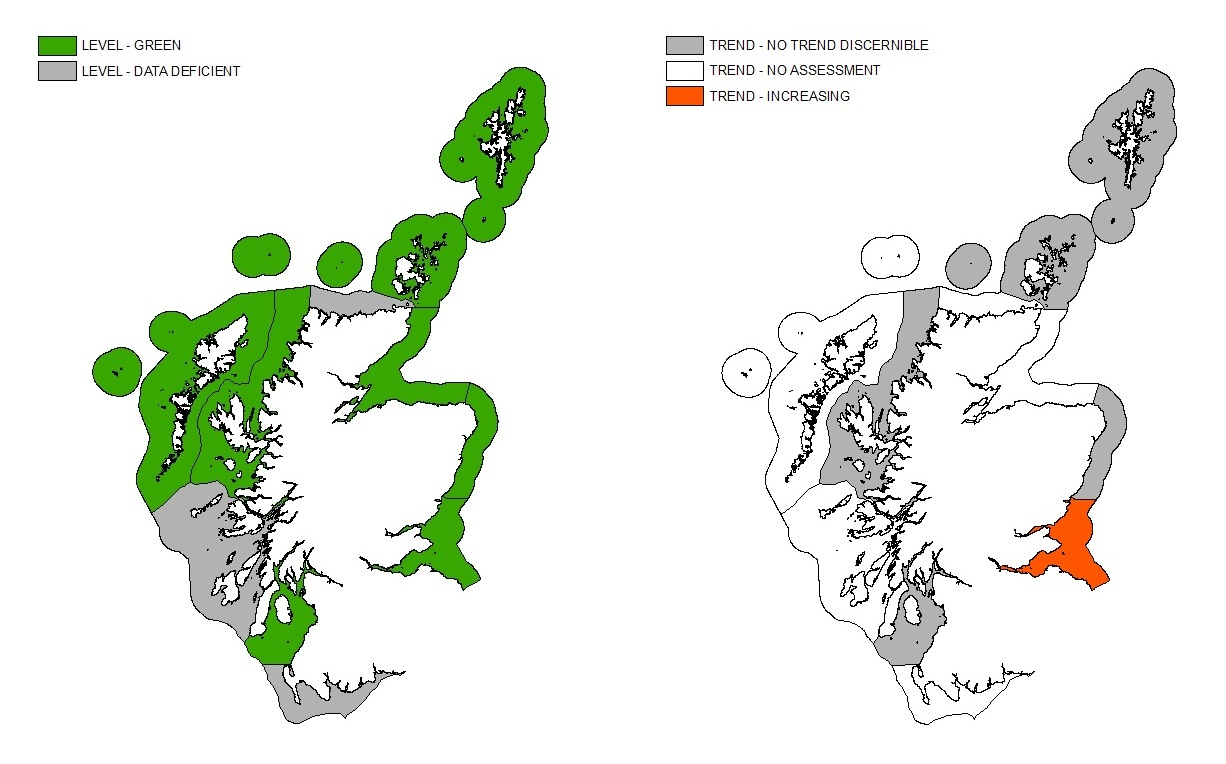
Figure 2: Location of SMRs with chlorophyll-a and trend assessments overlaid.
SMRs coloured green have sufficient data for a trend assessment. The map on the right shows if trends were observed, the red colour indicates an increasing trend, while SMRs coloured grey show no trend.
The SMRs with the highest chlorophyll-a concentrations, the Clyde and Forth and Tay SMRs, also had the highest inputs of nutrients (see nutrient input assessment), and, in the case of the Forth and Tay, some of the highest observed nutrient concentrations (see winter nutrient assessment). Although available nutrients are not the only factor that leads to elevated chlorophyll-a concentrations, they are less limiting in these SMRs than other regions around Scotland.
Scotland’s Marine Atlas (Baxter et al., 2011) presented only a snapshot data set covering June to August 2008, requiring an alternative way to identify trends. Where data are sufficient and Mann Kendall tests indicate a statistically significant trend was present, a Theil-Sen slope & intercept has been modelled, and a trend line (blue solid) (Figure 1) has been fitted to data.
Two regions had 90th percentile chlorophyll-a concentrations above OSPAR criteria: Clyde (breaches in 2004, 2008, 2009, 2015, 2017, 2018) and Forth and Tay (breaches in 2010, 2015). The area with the highest median March-September concentration was Clyde, followed by Forth and Tay and Shetland Isles (Table a).
Confidences that the relevant criteria for each area has not been exceeded are summarised in Table b.
|
SMR
|
Median March-September Concentration (µg L-1)
|
|---|---|
|
Clyde
|
2.84
|
|
Forth & Tay
|
2.76
|
|
Shetland Islands
|
2.24
|
|
Orkney Islands
|
1.90
|
|
West Highlands
|
1.70
|
|
North East
|
1.63
|
|
Solway
|
1.52
|
|
Outer Hebrides
|
1.50
|
|
Argyll
|
1.33
|
|
North Coast
|
1.07
|
|
Moray Firth
|
0.80
|
|
SMR
|
Number of sites
|
Confidence Level
|
|---|---|---|
|
North East
|
24
|
92.00%
|
|
Orkney Islands
|
23
|
91.10%
|
|
West Highlands
|
23
|
91.10%
|
|
Shetland Isles
|
20
|
87.80%
|
|
Argyll
|
13
|
74.60%
|
|
Outer Hebrides
|
13
|
74.60%
|
|
Moray Firth
|
10
|
65.10%
|
|
Solway
|
7
|
52.20%
|
|
Forth and Tay
|
26
|
48.90%
|
|
North Coast
|
5
|
41.00%
|
|
Clyde
|
19
|
0.20%
|
Clyde
The Clyde, from 1999 to 2011, had no statistically significant trend (Mann Kendall tau = 0.09, p = 0.73; based on only 11 years of data, as 1990-1999 had no data). Extending the dataset to 2018 also resulted in no detection of a statistically significant trend (Mann-Kendall tau = 0.26, p = 0.12). The Clyde is mostly below the coastal OSPAR criteria, however there is only a 0.2% confidence that 90% of observations would be below this criteria. Weak tidal currents and large volumes of fresh water cause near permanent stratification in the Firth of Clyde, which provides the conditions for algal growth. Nutrient input from the Glasgow metropolitan area, as well as agricultural and forestry land, stimulates algal blooms to a greater degree than water bodies that are subject to more frequent mixing.
Forth and Tay
The Forth and Tay from 1992 to 2011 did not have a statistically significant trend (Mann-Kendall tau = 0.22, p = 0.18). Extending this regression to 2019 indicated a statistically significant trend did exist (Mann-Kendall tau = 0.37, p = 0.008). 90th percentile chlorophyll-a concentration in the Forth & Tay increased by 0.21µg L-1 y-1. The trend detected in the Forth & Tay data is based on relatively continuously sampled data, albeit with greater sampling effort after 2000. Only 3 years had no data (1990, 1991, 2000). For years with data, the 90th percentile was based on 1 to 368 records, with a median of 22. The increasing trend of chlorophyll-a incorporating data post 2011 is calculated from more intensively sampled data than this earlier period (1990-2011: median 14 samples per year; 2012-2019: median 23 samples per year).
All other regions had no 90th percentile concentrations above OSPAR criteria for 1990-2011 or 1990-2018, and no statistically significant trends. Five SMRs had data for less than half the years between 1990 and 2018 (Argyll, Moray Firth, North Coast, Outer Hebrides, Solway) with correspondingly lower confidence that the criteria would be met 90% of the time.
Conclusion
Chlorophyll-a concentrations in SMRs are, in general, meeting the OSPAR criteria. However, there is an increasing trend in concentration in the Forth and Tay, including two years with concentrations above the OSPAR coastal criteria. The Clyde has had six years with concentrations above the OSPAR coastal criteria, but there is no discernible trend.
Marine planning should pay special attention to areas where there is a statistically significant trend identified, or where criteria breaches have occurred. While most regions have no concentrations greater than the criteria at the annual 90th percentile level of aggregation, there are occasional exceedances of these criteria in the Clyde and Forth and Tay.
Sampling effort for every area was variable both spatially and temporally, which means confidence in status and trends varies, and that a ‘Scotland wide’ assessment is not presented.
Knowledge gaps
No continuous dataset (from 1990 to 2018) exists for any of the SMR regions in this assessment and the sampling effort is uneven across available data, both spatially and temporally. Datasets contain both chlorophyll-a concentrations corrected for and uncorrected for pheophytin-a, as agreed reporting of chlorophyll-a data has changed (OSPAR, 2012).
Where extensive sampling cannot be justified on a risk basis (such as offshore areas), effort should be made to integrate other sampling options, such as satellite and proxy measures of chlorophyll-a.
Sampling for chlorophyll-a in offshore regions is limited although MSS plan to increase summer monitoring. Effort is needed to incorporate data from remote sensing devices such as satellites e.g. MERIS Ocean Colour (Xiao et al., 2018) and Continuous Plankton Recorder phytoplankton colour index (Raitsos et al., 2012). Recent work by the JMP EUOSAT project (JMP EUNOSAT, 2019) considered such tools and the work of the project is now being considered by OSPAR. However to meet eutrophication criteria any pigment data should be interpreted in the context of the nutrient data.
Current guidelines do not recommend a single standard extraction or analysis technique for the determination of chlorophyll-a for eutrophication monitoring (OSPAR, 2012) and therefore assessments will include data from a range of techniques. In addition reporting of chlorophyll-a corrected for pheophytin-a pigments is no longer recommended by OSPAR. However, historical datasets may contain only corrected chlorophyll-a concentrations. Therefore both corrected and uncorrected data have been used in this assessment. Other assessments such as those done for OSPAR and MSFD are likely to have the same issues.
The dataset in general is uneven across space and time and requires a centralised curated layer on MS Maps NMPi as opposed to assembling as comprehensive a dataset as possible from different sources. For remote regions, satellite and continuous plankton recorder phytoplankton colour index data could be integrated into one dataset.
Status and trend assessment
The status and trend assessment is for eutrophication and includes, nutrient inputs, winter nutrient concentrations, chlorophyll concentrations and dissolved oxygen concentrations.
|
Region assessed |
Status with confidence |
Trend with confidence |
Comments |
|---|---|---|---|
|
Argyll |
  |
|
Status and trends have been given a confidence of 2 stars because there is limited dissolved oxygen data available in the region and this has been acknowledged as a knowledge gap in the current assessment of overall Eutrophication status. |
|
Clyde |
 |
|
The status green box with blue circle is due to a localised issue within the inner Clyde estuary where the dissolved oxygen is failing. Status and trends have been given a confidence of 2 stars because there is limited dissolved oxygen data available in the region and this has been acknowledged as a knowledge gap in the current assessment of overall Eutrophication status. |
|
Forth and Tay |
|
|
Status and trends have been given a confidence of 2 stars because there is limited dissolved oxygen data available in the region and this has been acknowledged as a knowledge gap in the current assessment of overall Eutrophication status. There is a localised issue with the trend assessment due to increasing chlorophyll concentrations, but trend not reflected in other eutrophication parameters. |
|
Moray Firth |
|
|
Status and trends have been given a confidence of 2 stars because there is limited dissolved oxygen data available in the region and this has been acknowledged as a knowledge gap in the current assessment of overall Eutrophication status. |
|
North Coast |
|
|
Status and trends have been given a confidence of 2 stars because there is limited dissolved oxygen data available in the region and this has been acknowledged as a knowledge gap in the current assessment of overall Eutrophication status. |
|
North East |
|
|
The status green box with blue circle is due to a localised issue within the Ythan Estuary which is categorised as being eutrophic. The rest of the SMR is not impacted and not considered to be Eutrophic. Status and trends have been given a confidence of 2 stars because there is limited dissolved oxygen data available in the region and this has been acknowledged as a knowledge gap in the current assessment of overall Eutrophication status. |
|
Orkney Islands |
|
|
Status and trends have been given a confidence of 2 stars because there is limited dissolved oxygen data available in the region and this has been acknowledged as a knowledge gap in the current assessment of overall Eutrophication status. There is a localised issue of increasing nutrient inputs in the region associated with increasing aquaculture. This increasing input is not impacting nutrients across the SMR with no statistically significant trend in winter DIN observed. |
|
Outer Hebrides |
|
|
There is a localised issue of increasing nutrient inputs in the region associated with increasing aquaculture. This increasing input is not impacting nutrients across the SMR with no statistically significant trend in winter DIN observed. Status and trends have been given a confidence of 2 stars because there is limited dissolved oxygen data available in the region and this has been acknowledged as a knowledge gap in the current assessment of overall Eutrophication status. |
|
Shetland Isles |
|
|
Status and trends have been given a confidence of 2 stars because there is limited dissolved oxygen data available in the region and this has been acknowledged as a knowledge gap in the current assessment of overall Eutrophication status. |
|
Solway |
|
|
Status and trends have been given a confidence of 2 stars because there is limited dissolved oxygen data available in the region and this has been acknowledged as a knowledge gap in the current assessment of overall Eutrophication status. |
|
Western Islands |
|
|
Status and trends have been given a confidence of 2 stars because there is limited dissolved oxygen data available in the region and this has been acknowledged as a knowledge gap in the current assessment of overall Eutrophication status. |
This Legend block contains the key for the status and trend assessment, the confidence assessment and the assessment regions (SMRs and OMRs or other regions used). More information on the various regions used in SMA2020 is available on the Assessment processes and methods page.
Status and trend assessment
|
Status assessment
(for Clean and safe, Healthy and biologically diverse assessments)
|
Trend assessment
(for Clean and safe, Healthy and biologically diverse and Productive assessments)
|
||
|---|---|---|---|
 |
Many concerns |
No / little change |
|
 |
Some concerns |
Increasing |
|
 |
Few or no concerns |
Decreasing |
|
 |
Few or no concerns, but some local concerns |
No trend discernible |
|
 |
Few or no concerns, but many local concerns |
All trends | |
 |
Some concerns, but many local concerns |
||
 |
Lack of evidence / robust assessment criteria |
||
| Lack of regional evidence / robust assessment criteria, but no or few concerns for some local areas | |||
 |
Lack of regional evidence / robust assessment criteria, but some concerns for some local areas | ||
| Lack of regional evidence / robust assessment criteria, but many concerns for some local areas | |||
Confidence assessment
|
Symbol |
Confidence rating |
|---|---|
|
Low |
|
|
Medium |
|
|
High |

Assessment regions
 and the Scottish Offshore Marine Regions (OMRs, O1 – O10)")
Key: S1, Forth and Tay; S2, North East; S3, Moray Firth; S4 Orkney Islands, S5, Shetland Isles; S6, North Coast; S7, West Highlands; S8, Outer Hebrides; S9, Argyll; S10, Clyde; S11, Solway; O1, Long Forties, O2, Fladen and Moray Firth Offshore; O3, East Shetland Shelf; O4, North and West Shetland Shelf; O5, Faroe-Shetland Channel; O6, North Scotland Shelf; O7, Hebrides Shelf; O8, Bailey; O9, Rockall; O10, Hatton.
 Regions. These have been used as the assessment areas for hazardous substances.")
, Regions.")