

Background
As well as being of key economic and social importance, commercial fish in Scottish waters are also vital components of the biological ecosystems. Larger commercial fish (e.g. cod, hake, whiting) are themselves key predators, so their presence is critical to the correct functioning of the local food web.
The status of most commercial fish stocks of greatest commercial value to Scotland (pelagic mackerel and herring being the two most valuable species, with demersal (in descending order of economic value) being haddock, monkfish (or anglerfish), cod, hake, whiting and saithe (Figure 1)) is evaluated each year by International Council for the Exploration of the Sea (ICES), which uses fishery (Figure 3) and survey data from appropriate countries to estimate three key metrics:
- Fishing mortality F: this is a measure of the mortality pressure exerted by fishing on the stock. It relates to the proportion of a population removed by fishing each year according to a nonlinear relationship, so an F of 0.3 indicates roughly 30% removals while an F of 1.0 indicates roughly 65% removals.
- Spawning stock biomass SSB or B: this is an estimate of the weight (in tonnes) of sexually-mature fish in the population, and is used as a proxy for both abundance and reproductive potential.
- Recruitment R: this provides an estimate of the number of young fish entering the fishable population each year.
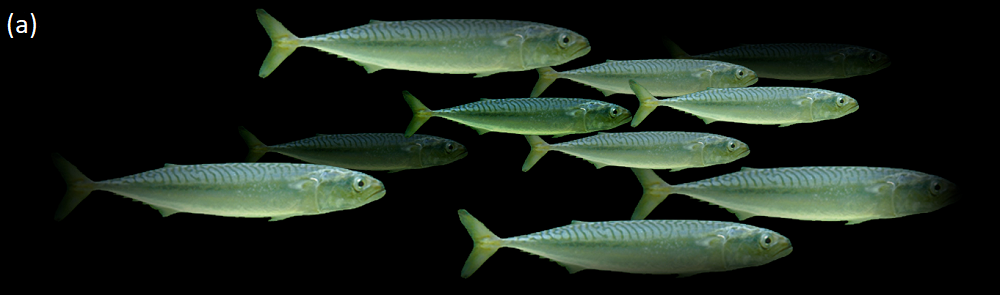
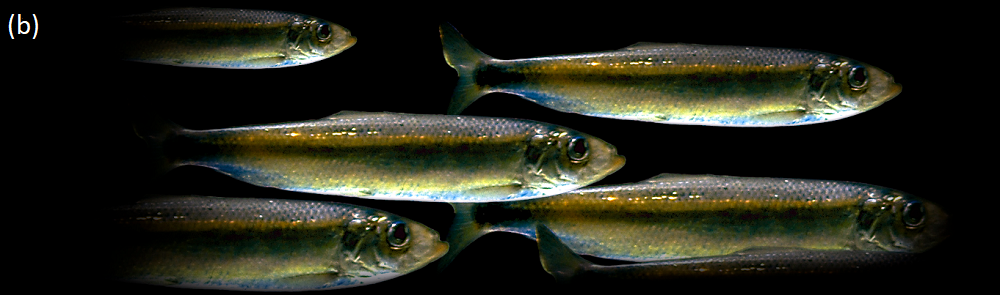
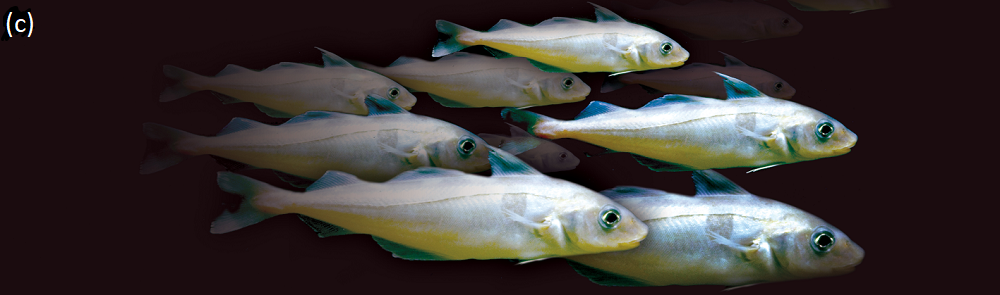
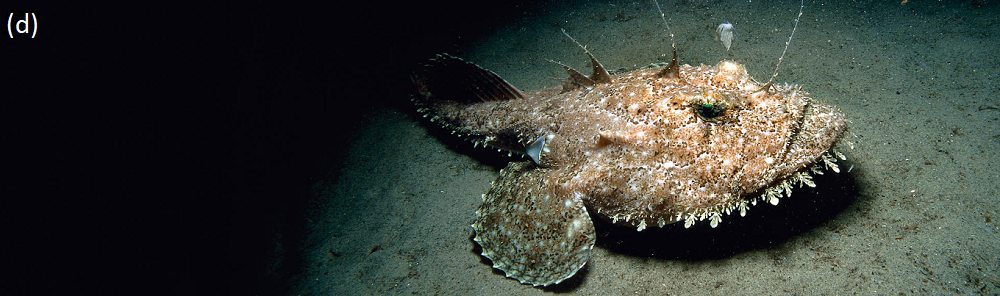


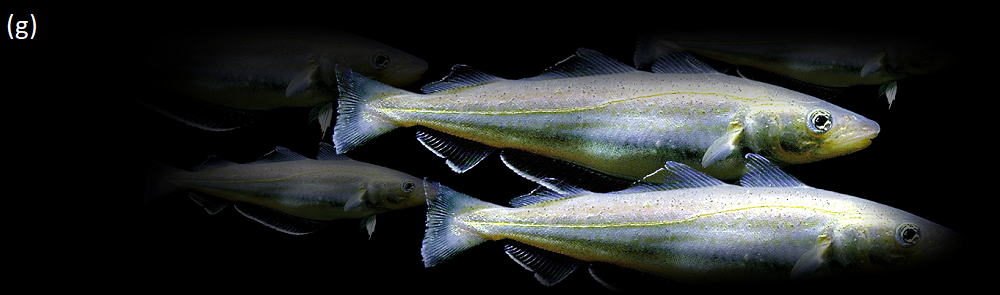
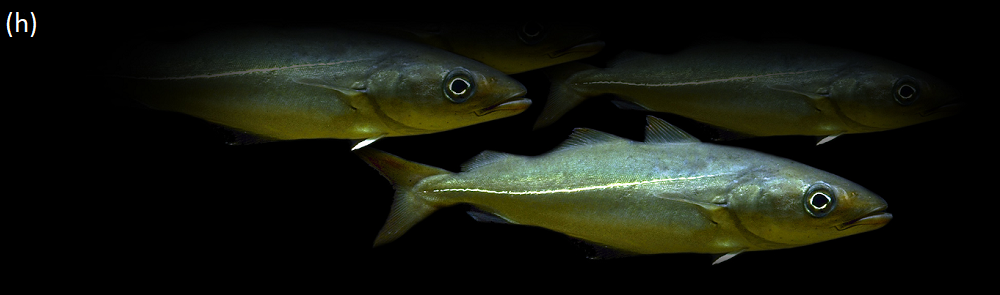
Figure 1: Fish of greatest commercial value to Scotland: (a) Mackerel; (b) Herring; (c) Haddock; (d) Monkfish (or Anglerfish), photo by TBC; (e) Cod; (f) Hake, photo by Drow Male/CC BY-SA; (g) Whiting; and (h) Saithe. All photos © Marine Scotland unless otherwise stated.
Assessments of the state of the stock typically consist of estimating time series of these three measures, and judging whether the fishery is sustainable and the stock healthy by comparing them to pre-defined management reference points. Stock status advice is provided by ICES (2019) on the basis of discrete stocks, which may be biologically distinct or simply part of an existing management area (Figure 2). The stocks are not in general congruent with the defined Scottish Marine Regions (SMR) or Offshore Marine Regions (OMRs), and it is not possible to provide status indicators for SMRs or OMRs specifically.
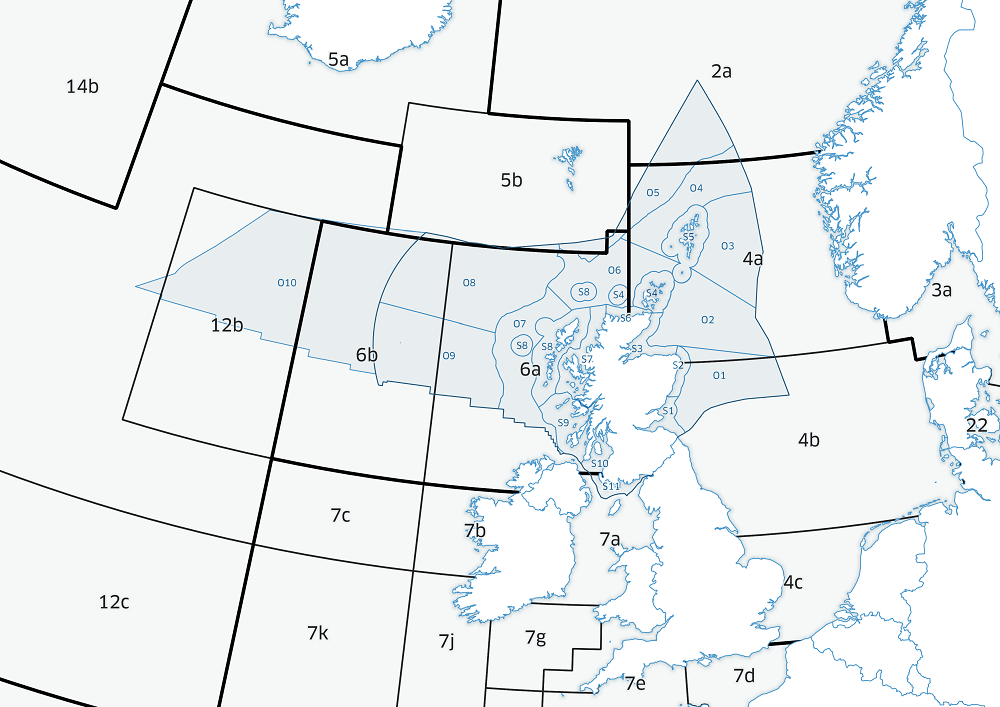
Figure 2: ICES areas around Scotland with Scottish Marine Regions (SMRs) and Offshore Marine Regions (OMRs). Source: Marine Scotland and ICES.
Key: S1, Forth and Tay; S2, North East; S3, Moray Firth; S4 Orkney Islands, S5, Shetland Isles; S6, North Coast; S7, West Highlands; S8, Outer Hebrides; S9, Argyll; S10, Clyde; S11, Solway; O1, Long Forties, O2, Fladen and Moray Firth Offshore; O3, East Shetland Shelf; O4, North and West Shetland Shelf; O5, Faroe-Shetland Channel; O6, North Scotland Shelf; Hebrides Shelf; O8, Bailey; O9, Rockall; O10, Hatton.
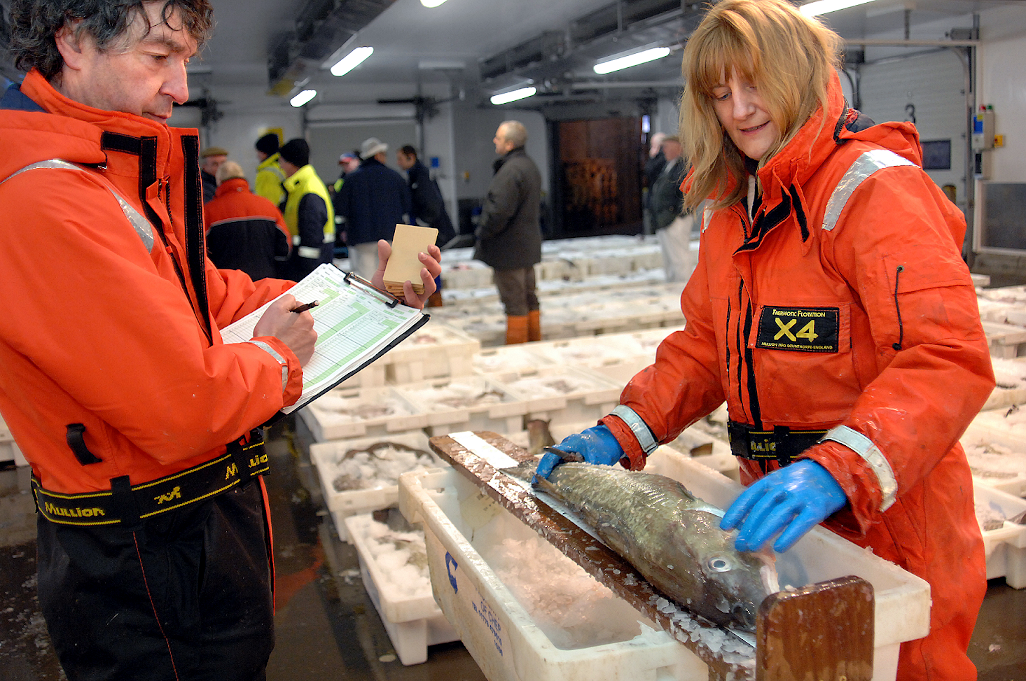
Figure 3: Marine Scotland staff sampling fish at Peterhead fish market. © Marine Scotland.
The length of the fish is measured. One of the otoliths (ear bones) is also taken for subsequent analysis at Marine Scotland Science (MSS) to determine the age of the fish when caught.
The three time series measures typically used in assessments for estimating the state of the stock are:
- F(msy) – the fishing mortality estimated to result in the maximum sustainable yield over a long time period.
- MSY B(trigger) – under the ICES MSY approach, the recommended quota is defined as catches that will result in the stock experiencing fishing mortality of F(msy). f SSB falls below a defined level (MSY B(trigger)), however, the recommended catches are reduced accordingly to prevent overfishing.
- F(lim), F(pa) – under the precautionary approach, F(lim) is a fishing mortality that should not be exceeded. As F is known only approximately, F(pa) is a lower value that ensures that F(lim) is not exceeded.
B(lim), B(pa) – the equivalents of F(lim) and F(pa) for SSB, with B(lim) defined as the SSB that the stock should not go below.
Commercial demersal and pelagic fisheries are of key economic importance in Scottish waters and landings of these species represented over two-thirds of the value of all landings by Scottish vessels in 2018. See the Fishing section.
As well as being of key economic and social importance, commercial fish in Scottish waters are also vital components of the biological ecosystems. Larger commercial fish (e.g. cod, hake, whiting) are themselves key predators, so their presence is critical to the correct functioning of the local food web.
Commercial fish are generally not homogeneously distributed, so a knowledge of their distribution is essential to understand the likely impact of (and on) vessels of any spatial measure that limits fishing activity.
The most valuable species landed by Scottish fishing vessels is mackerel. This is a wide-ranging species that migrates in large schools every year from the Bay of Biscay to northern Norway. It is pelagic, which means that the schools swim in open water rather than being limited to the sea bed. Most mackerel are caught by large pelagic trawlers and seiners.
The second-most commercially important pelagic species is herring, which is caught by Scottish trawlers mostly in the North Sea. Historically, large catches of herring were taken from the West of Scotland, but this population has declined in recent years.
The bulk of the remaining species of commercial fish important to Scotland are demersal, which means they inhabit a more restricted zone on or near the seabed. Fisheries for demersal fish tend to catch more of a mixture of species, when compared with pelagic fisheries.
The principal demersal species for Scottish fisheries (in descending order of economic value) are haddock, monkfish (also known as anglerfish), cod, hake, whiting and saithe. The main method of fishing is demersal trawl, although seiners are also used and creels can be deployed in certain rocky areas. The distribution of these species tends to change through time in response to fishing and environmental factors: for example, cod were once widely distributed through the North Sea and West of Scotland, but are now mostly limited to the northern parts of both areas.
Fish stock assessments are carried out in order to support sustainable fisheries management. Assessments of the state of the stock typically consist of estimating fishing mortality, spawning stock biomass and recruitment, and judging whether the fishery is sustainable and the stock healthy by comparing these metrics to pre-defined reference points. The results can then be used by fishery managers to make decisions on sustainable exploitation rates and the management actions necessary to achieve them. Assessments for these stocks are carried out by the International Council for the Exploration of the Sea (ICES), to which Scotland contributes fishery and survey data, as well as stock assessment and advisory expertise.
Some of the data on stock abundance used in the assessments are collected on board research vessel surveys. Annually, Marine Scotland Science (MSS) undertakes around 12 research-vessel cruises focussed on trawl and acoustic surveys of demersal and pelagic fish, respectively, covering the North Sea and West of Scotland areas. Currently, these are 80%-funded by the Data Collection Framework of the EU. Surveys estimate abundance indices, maturity, sex ratios, and weights, and provide information on stock location and age- and length-structure.
The assessments also make use of data on the total weight and age and length composition of catches, which are obtained through regular sampling of commercial landings at ports, processors and harbours around Scotland, conducted by MSS and also funded by the EU DCF. Samples from the Shetland area are collected and provided by staff from North Atlantic Fisheries College (NAFC) Marine Centre under the Memorandum of Understanding between NAFC and MS. Regular catch sampling by observers on board commercial fishing boats to obtain age and length composition data for the discarded and landed components of the catch also occurs. The observers are employed by MSS and the Scottish Fishermen’s Federation and sampling is partly funded under the EU DCF.
Methods are also in development to collate, analyse and incorporate into advice CCTV (closed circuit television) footage of discarding from commercial vessels. Once fully implemented, this will provide an invaluable additional source of information on fishing practices to augment the data available from on-board observers.
The Scottish Sustainable Fishing Indicator shows the impact of management actions on the sustainability of fish stocks of commercial importance to Scotland. It consists of the proportion of relevant fish stocks for which the estimated fishing mortality rate F is less than the fishing mortality rate F(msy) that is commensurate with maximum sustainable yield (MSY). Estimates are provided by ICES (for international marine stocks) and MS (for some inshore shellfish species), and the indicator is updated in a regular annual schedule.
All relevant fish data (from research-vessel surveys and the commercial fisheries) are used in ICES stock assessments and the provision of ICES advice. Both commercial and survey data are collated following ICES protocols, and are reviewed throughout the process. The resultant stock assessments are peer-reviewed internally by ICES (reports are available on the ICES website), while advice is externally reviewed through the ICES Advice Drafting Group system.
Stock assessments for commercial fish are based on estimates of commercial landings and discards from all countries participating in the fishery, along with research-vessel; survey indices (usually collated by ICES). Indications of spatial distribution are mostly derived from surveys, although catch data linked to VMS can also be used.
The nature of the assessment carried out for each commercial fish stock is dependent on the data and methods available, and the use to which the assessment will be put. Stocks of key commercial interest historically (such as cod, haddock, whiting, saithe, plaice, mackerel and herring) are subject to full age-structured analytical assessment, along with the evaluation of stock and fishery distribution and likely future stock developments. Periods covered vary, but can be as long as 65 years (North Sea plaice).
Other stocks (monkfish, Nephrops) are highly significant commercially but cannot be aged successfully, so are assessed using biomass- or length-based approaches.
Finally, stocks for which advice has only been sought recently (e.g. North Sea lemon sole) are generally not subject to formal age-based assessments due to paucity of age data, and advice for these is based on a range of trend analyses or length-based indicators.
In all cases, advice is provided along with one or more reference points (for biomass and mortality), that indicate to managers whether the state of the stock is good or not.
The data collection schemes and work-up processes (commercial sampling and research vessel surveys) are long standing and follow standard protocols which have been developed over a number of years either at ICES or in-house by MSS.
The assessment methods used are all also used elsewhere for other stocks and appear in peer reviewed publications. On the whole, there is relatively high confidence in the assessments, and most are provided with estimates of uncertainty limits. A full discussion of uncertainties is provided in the relevant stock assessment reports.
Assessments will rely more heavily on expert judgement for data-limited stocks (e.g. lemon sole). Transboundary effects are important to consider when fish move between assessment regions, as both fishing mortality and recruitment can transcend boundaries.
The geographical areas covered are: North Sea (ICES area 4), Skagerrak (3a), eastern English Channel (7d), West of Scotland (6a), Rockall (6b), and the Irish Sea (7a) (see Figure 1). Some stocks will cover two or more of these areas, and in some cases there may be more than one biological stock in a particular management area. Indicators cannot be provided for SMRs or OMRs for these stocks, as data are not collected and analysed on that basis, and all stocks cover more than one SMR / OMR.
The Scottish Sustainable Fishing Indicator shows the impact of management actions on the sustainability of fish stocks of commercial importance to Scotland. It is described in more detail in Background extended Section.
Results
The single Scottish Sustainable Fishing Indicator, which summarises trends in fishing mortality across key stocks and how these compare with the fishing mortality rate consistent with maximum sustainable yield (F(msy)), has shown regular improvement over the period 2016 to 2018, the percentage of stocks being fished at or below F(msy) has increased from 46% (2016), to 50% (2017) and to 54% (2018). This suggests either effective management action overall, or broadly beneficial environmental conditions, or a combination of both. While positive, the indicator is a very high level metric, and it remains the case that further improvements are required for some key stocks. Furthermore, the indicator has thus far been estimated for only three years, and would have greater utility if calculated over a longer time period.
ICES stock summaries are presented in this assessment for the eight most valuable fish species to Scotland (in terms of landings value). The analysis for mackerel, as the most commercially important stock for Scotland, is below. The extended section presents stock summary plots and maps of biomass within ICES area for the other stocks assessed: haddock, monkfish, cod, herring, hake, whiting and saithe. Table 1 shows a summary of Fishing mortality (FMSY) and Stock size (MSY Btrigger) for each of the key commercial stocks considered.
Mackerel (November 2019)
ICES areas 1-8, 9a, 14
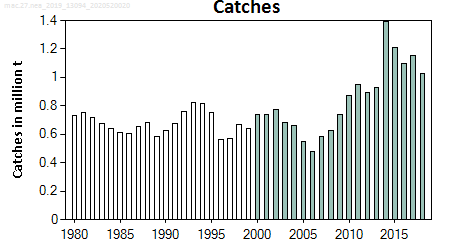
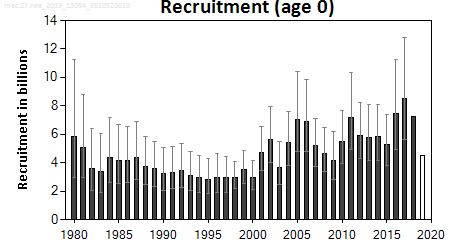
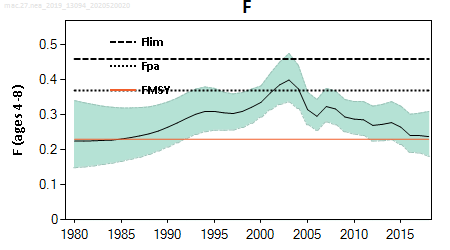
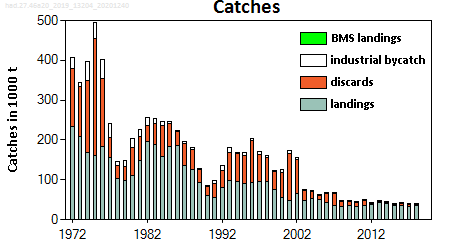
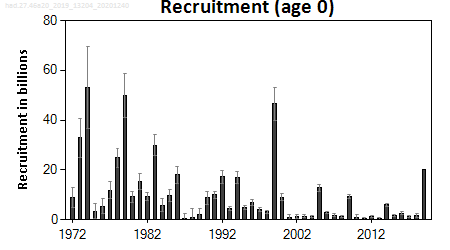
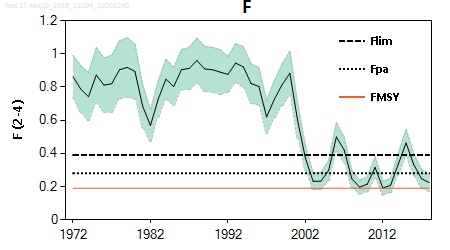
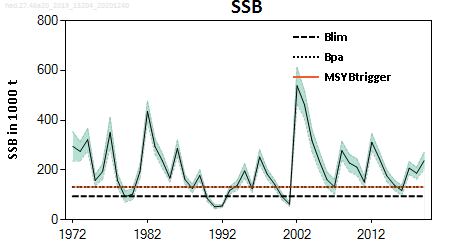
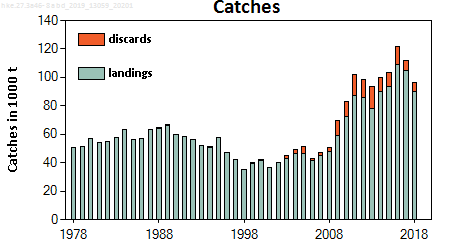
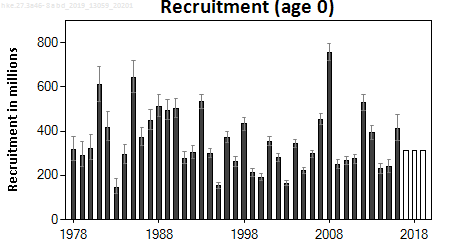
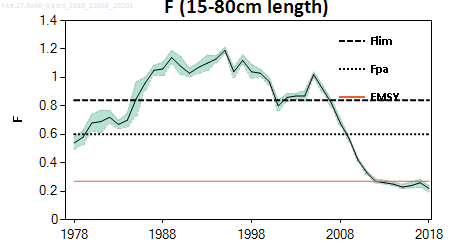
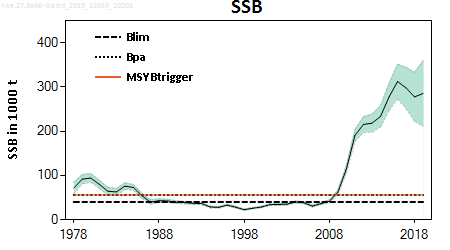
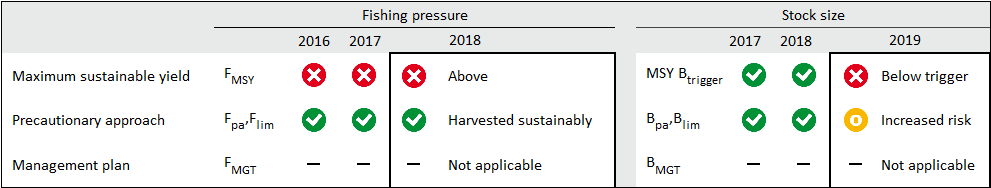
The spawning-stock biomass (SSB) is estimated to have increased since 2007, reaching a maximum in 2014, and has been declining since then. It has, however, remained above MSY Btrigger since 2008. The fishing mortality (F) has declined since 2003, but is estimated to have remained above FMSY. There has been a succession of large year classes since 2001, with year classes since 2011 estimated to be above average.
 |
 |
 |
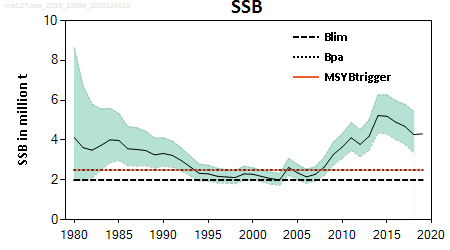 |
| Figure 4: ICES stock summary plots for mackerel in areas 1-8, 9a and 14. Source: ICES. |
Stocks assessed
Table 1: Summary of Fishing mortality (FMSY) and Stock size (MSY Btrigger) for each of the key commercial stocks considered. Source: ICES

Most of these results are taken from the ICES advice issued during summer 2019, except where noted. The full advice is available at the ICES website. For most stocks, a distribution plot based on research-vessel surveys is also included (note that this was not possible for mackerel and monkfish, as surveys for these stocks are not available in the same data format as used for the other stocks).
Haddock
Northern Shelf (ICES areas 4, 3a, 6a)
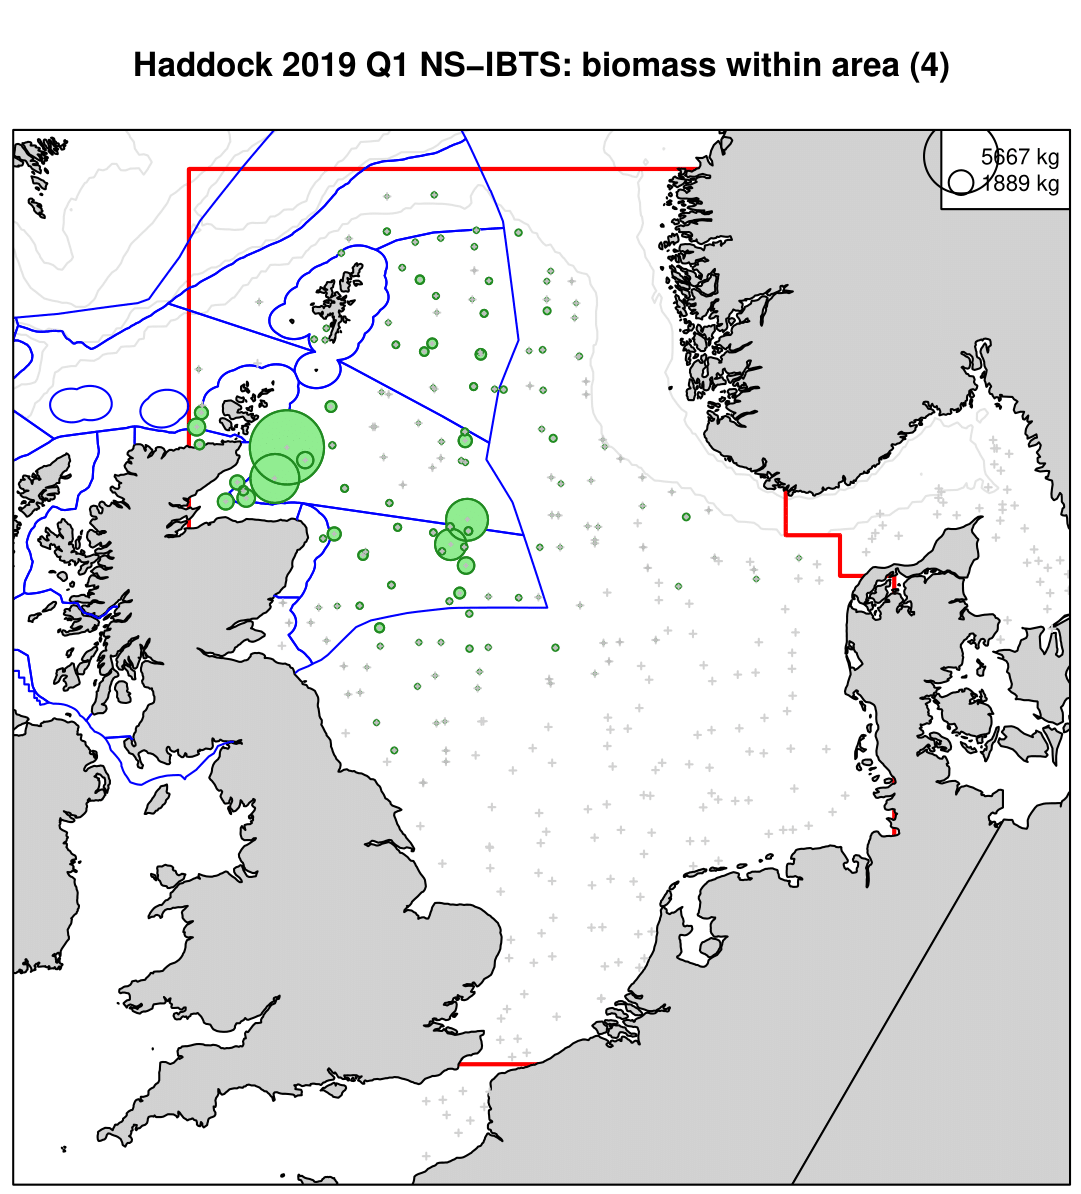
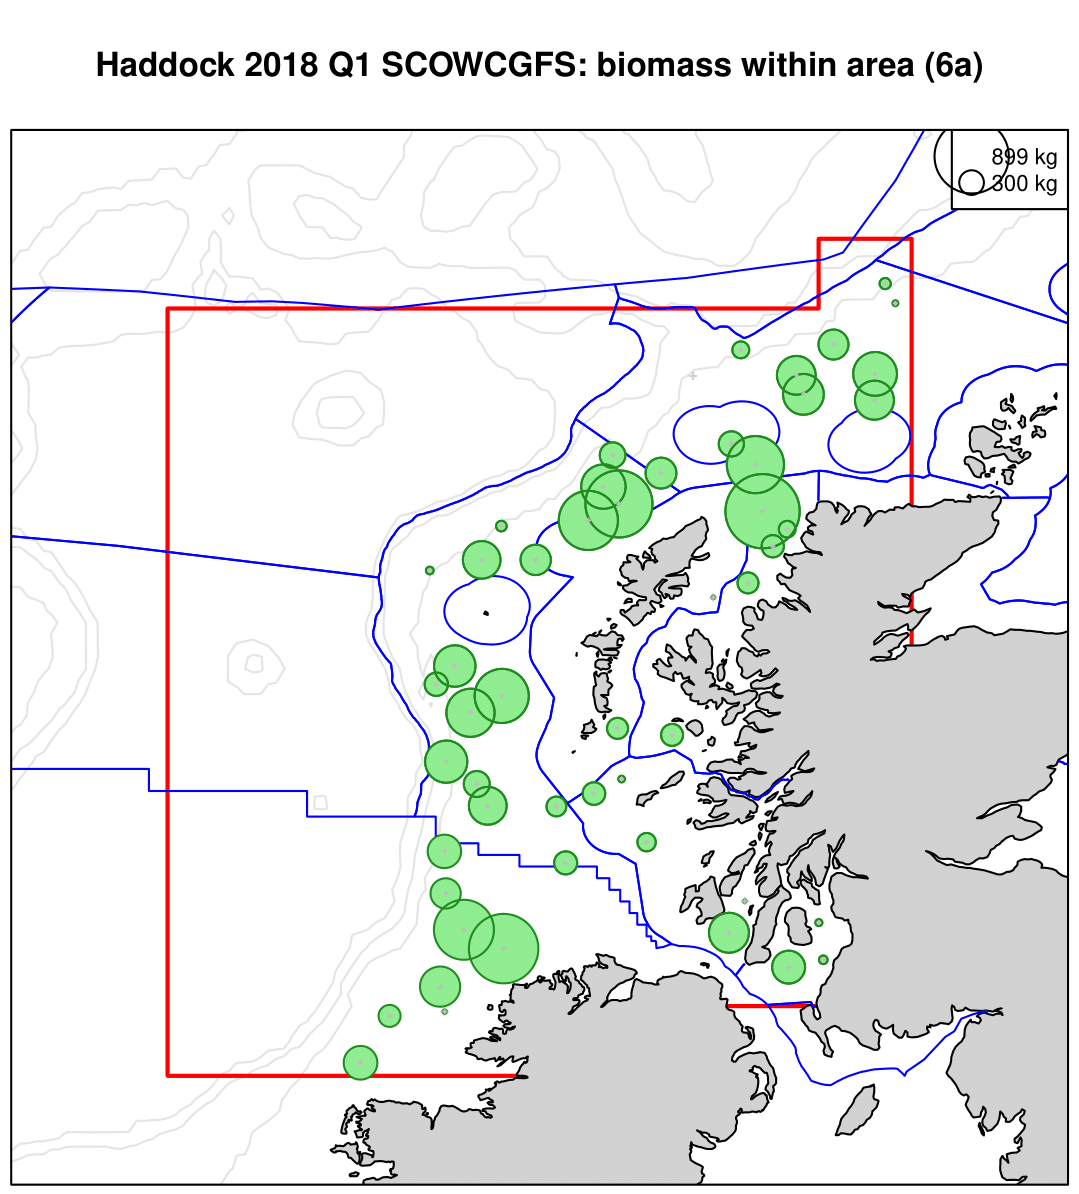
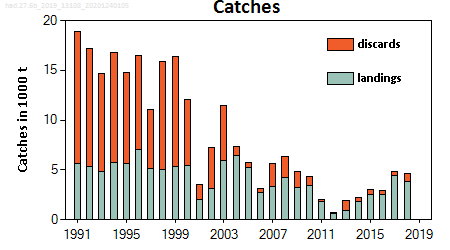
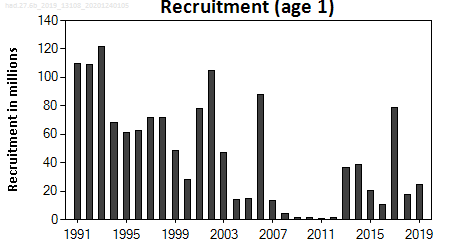
Fishing mortality (F) has declined since the beginning of the 2000s but it has been above FMSY for the entire time-series. Spawning-stock biomass (SSB) has been above MSY Btrigger in most of the years since 2002. Recruitment since 2000 has been low with occasional larger year classes, the size of which is diminishing. The 2019 year-class is estimated to be the largest since 1999.
 |
 |
 |
 |
| Figure a: ICES stock summary plots for haddock in areas 4, 3a and 6a (Northern Shelf). Source: ICES. |
 |
|
Figure b: Haddock 2019 Q1 NS-IBTS: biomass within area 4. Source : ICES. |
 |
|
Figure c: Haddock 2018 Q1 SCOWCGFS: biomass within area 6a. Source: ICES. |
Rockall (ICES area 6b; November 2019)
The spawning–stock biomass (SSB) has increased from the lowest estimated values in 2014 and is currently estimated to be well above MSY Btrigger. Fishing mortality (F) has been declining and is below FMSY in 2018. Recruitment during 2008– 2012 is estimated to have been extremely weak, but has improved since then. Recruitment in 2018 and 2019 is estimated to be below average.
 |
 |
 |
 |
| Figure d: ICES stock summary plots for haddock in area 6b (Rockall). Source: ICES |
 |
| Figure e: Haddock 2018 Q3 SCOROC: biomass within area 6b (Rockall). Source: ICES |
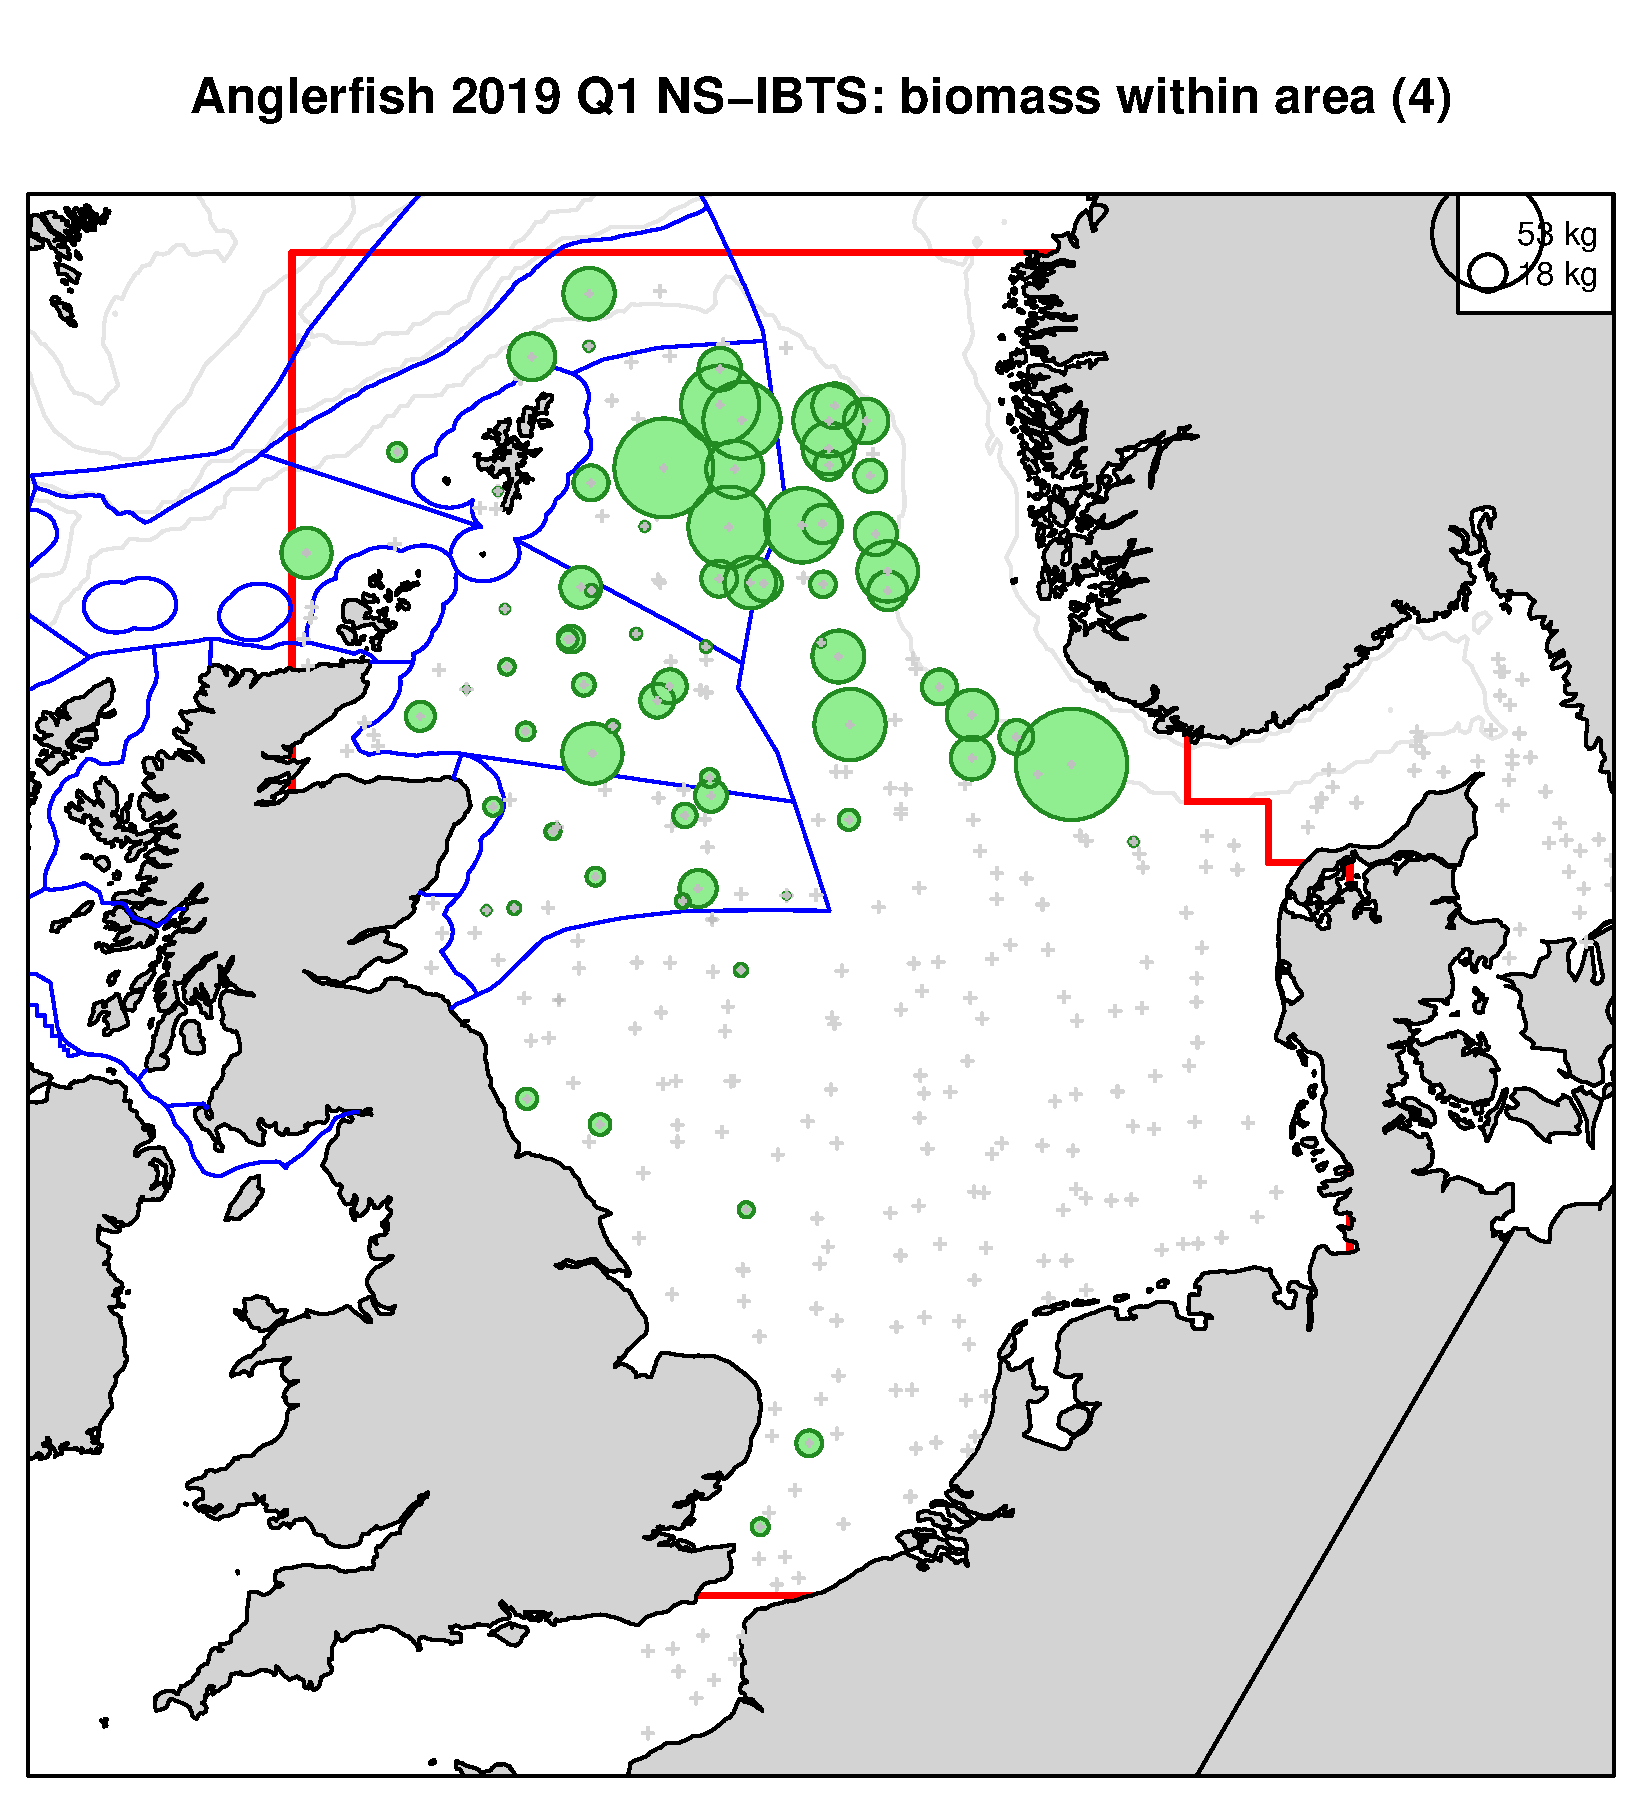
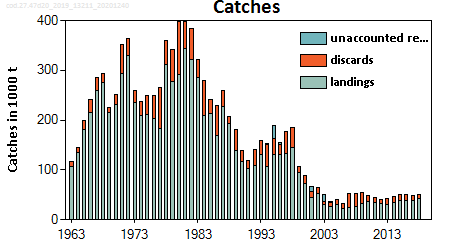
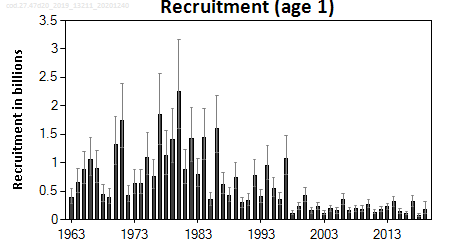
Monkfish
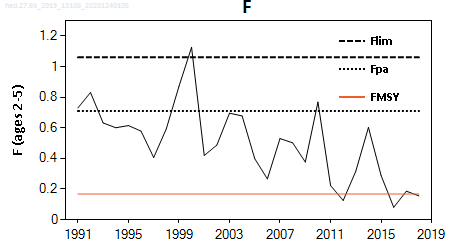
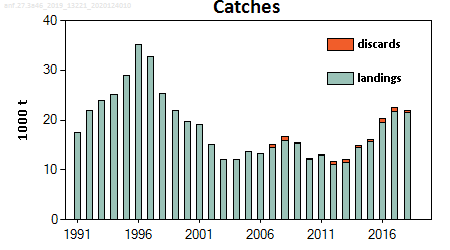
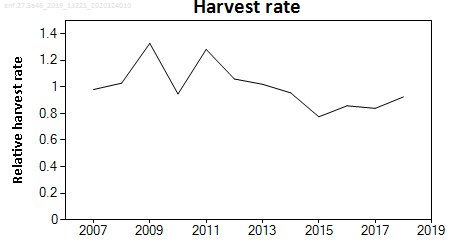
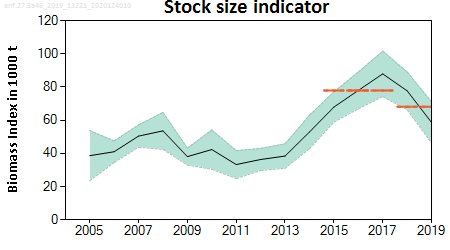
Northern Shelf (ICES areas 4, 6, 3a; October 2019)
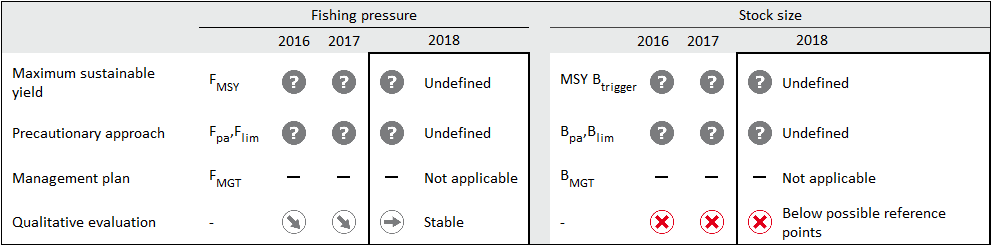
The stock size indicator increased from 2011 to a high value in 2017, and has been decreasing since then. The harvest rate has increased since 2015.
 |
|
 |
 |
|
Figure f: ICES stock summary plots for monkfish in areas 4, 6 and 3a (Northern Shelf). Source: ICES. |
 |
|
Figure g: Monkfish 2019 Q1 NS-IBTS: biomass within area 4. Source: ICES |
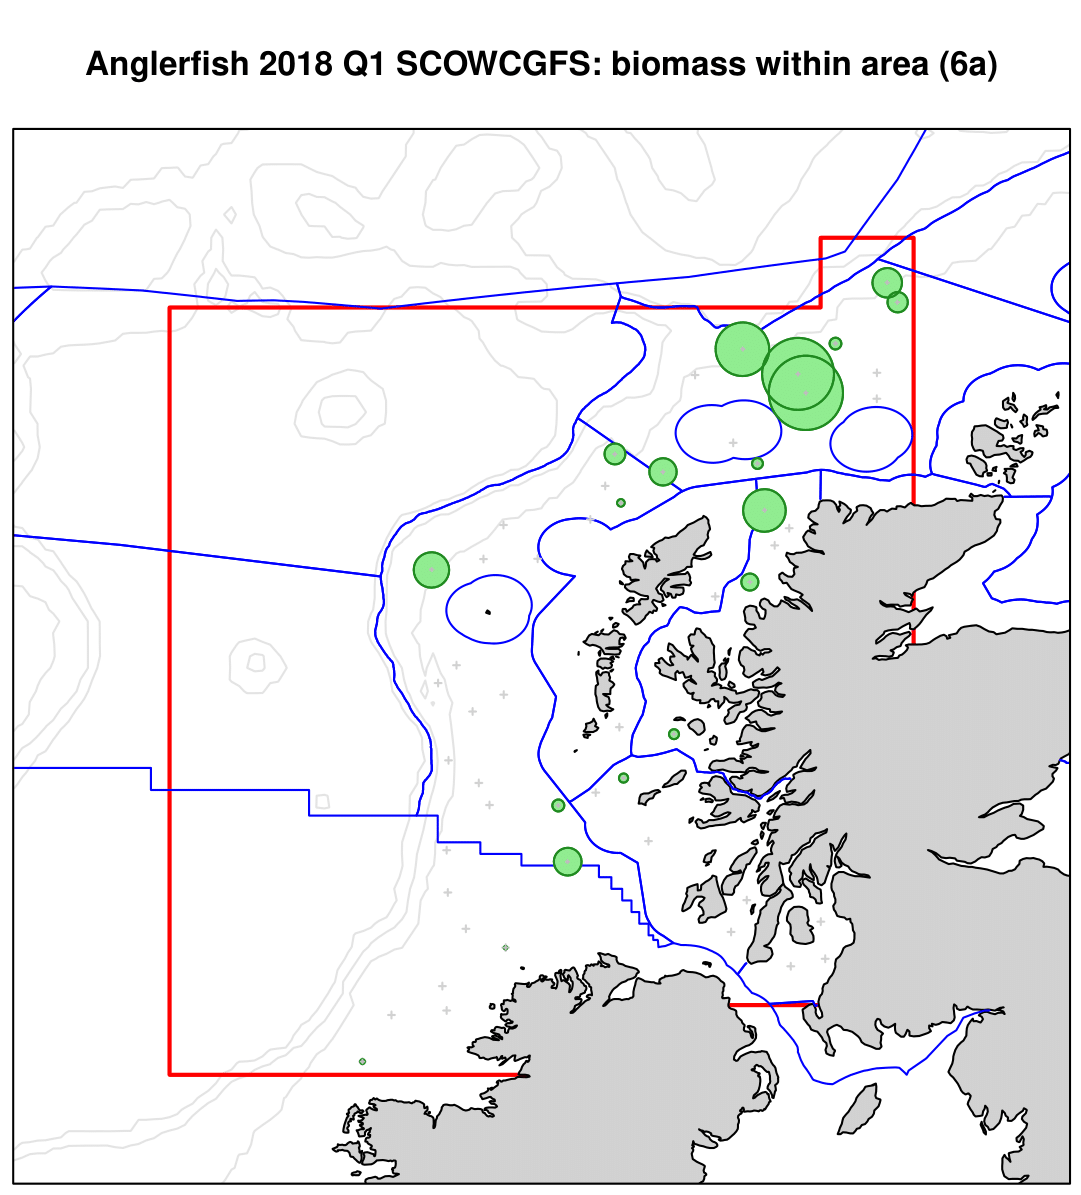 |
| Figure h: Monkfish 2018 Q1 SCOWCGFS: biomass within area 6a. Source: ICES |
Cod
North Sea (ICES areas 4, 7d, 3a)
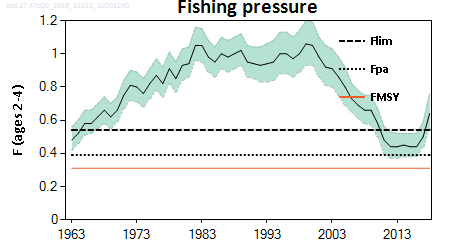
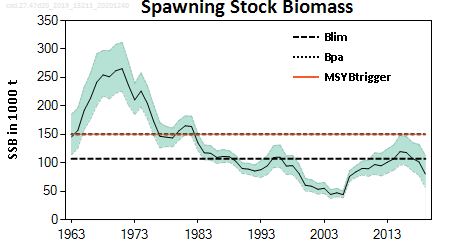
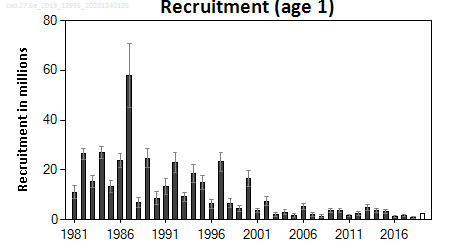
Fishing mortality (F) has increased since 2016, and is above Flim (the ICES suggestion for an upper limit of F) in 2018. Spawning-stock biomass (SSB) has decreased since 2015 and is now below Blim (the ICES suggestion for a lower limit on SSB). Recruitment since 1998 remains poor.
 |
 |
 |
 |
|
Figure i: ICES stock summary plots for cod in areas 4, 7d and 3a (North Sea, eastern Channel and Skagerrak). Source: ICES |
 |
|
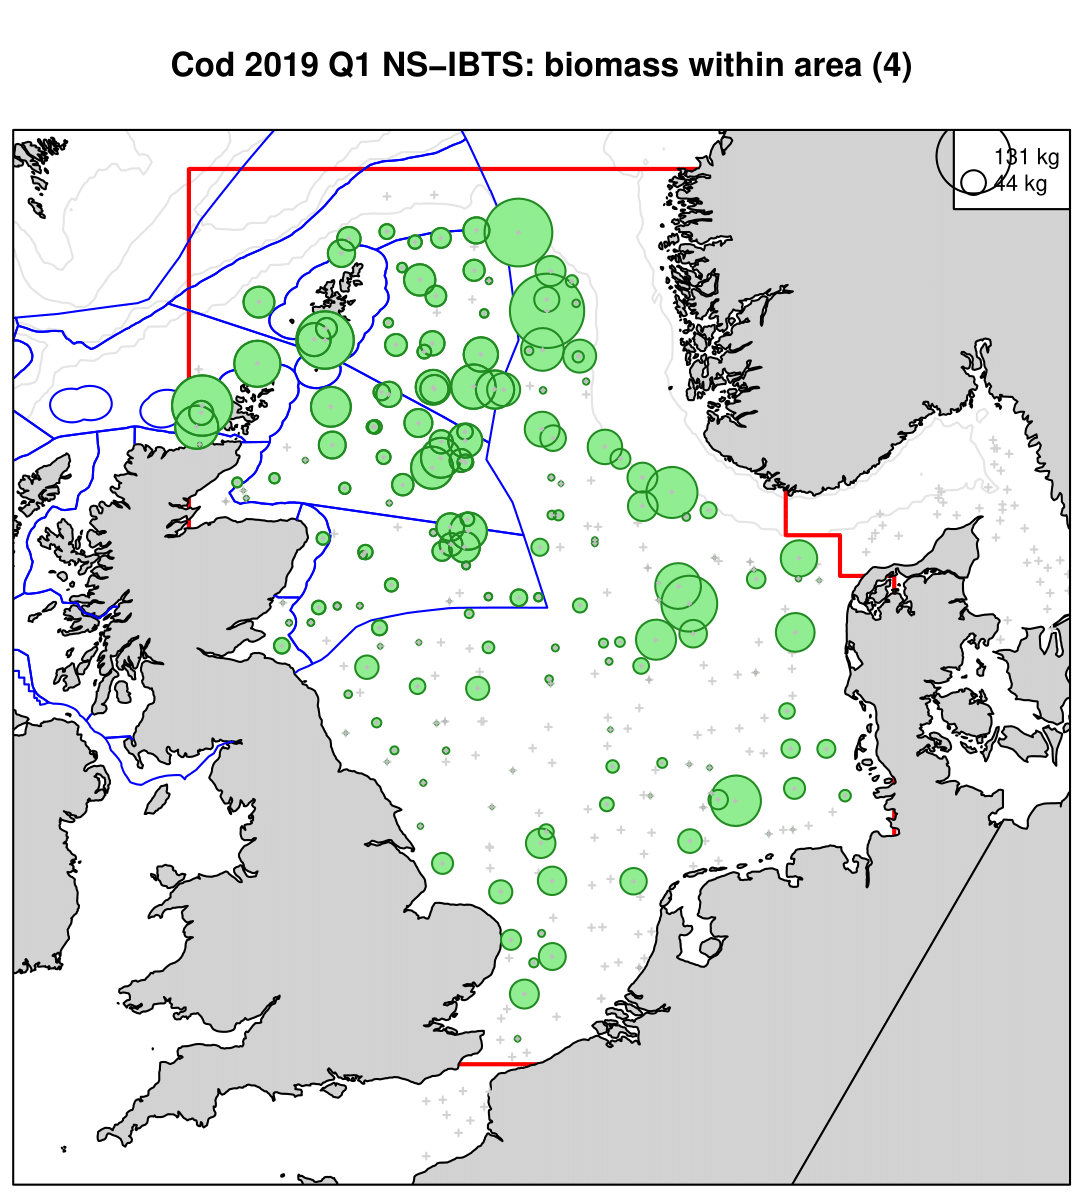
Figure j: Cod 2019 Q1 NS-IBTS: biomass within area 4. Source: ICES. Survey-based distribution map for North Sea cod, using data from the 2019 IBTS Q1 survey. The size of the circles is proportional to the square root of the weight of cod caught at that location. |
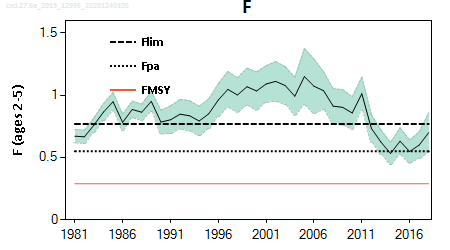
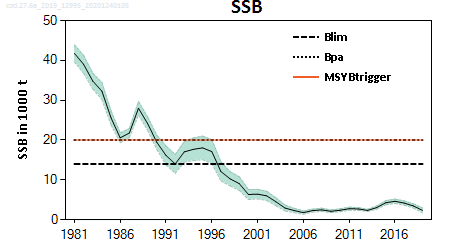
West of Scotland (ICES area 6a)
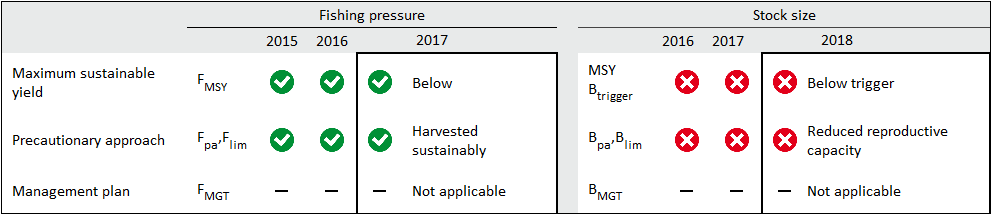
The current spawning–stock biomass (SSB) is extremely low and has been below Blim since 1997. Recruitment has also been very low since 2001, and below the time-series average. Fishing mortality (F) declined between 2005 and 2014 but has remained between F(pa) (the precautionary approach fishing mortality) and F(lim) since 2014.
 |
 |
 |
 |
|
Figure k: ICES stock summary plots for cod in area 6a (West Scotland). Source: ICES |
 |
|
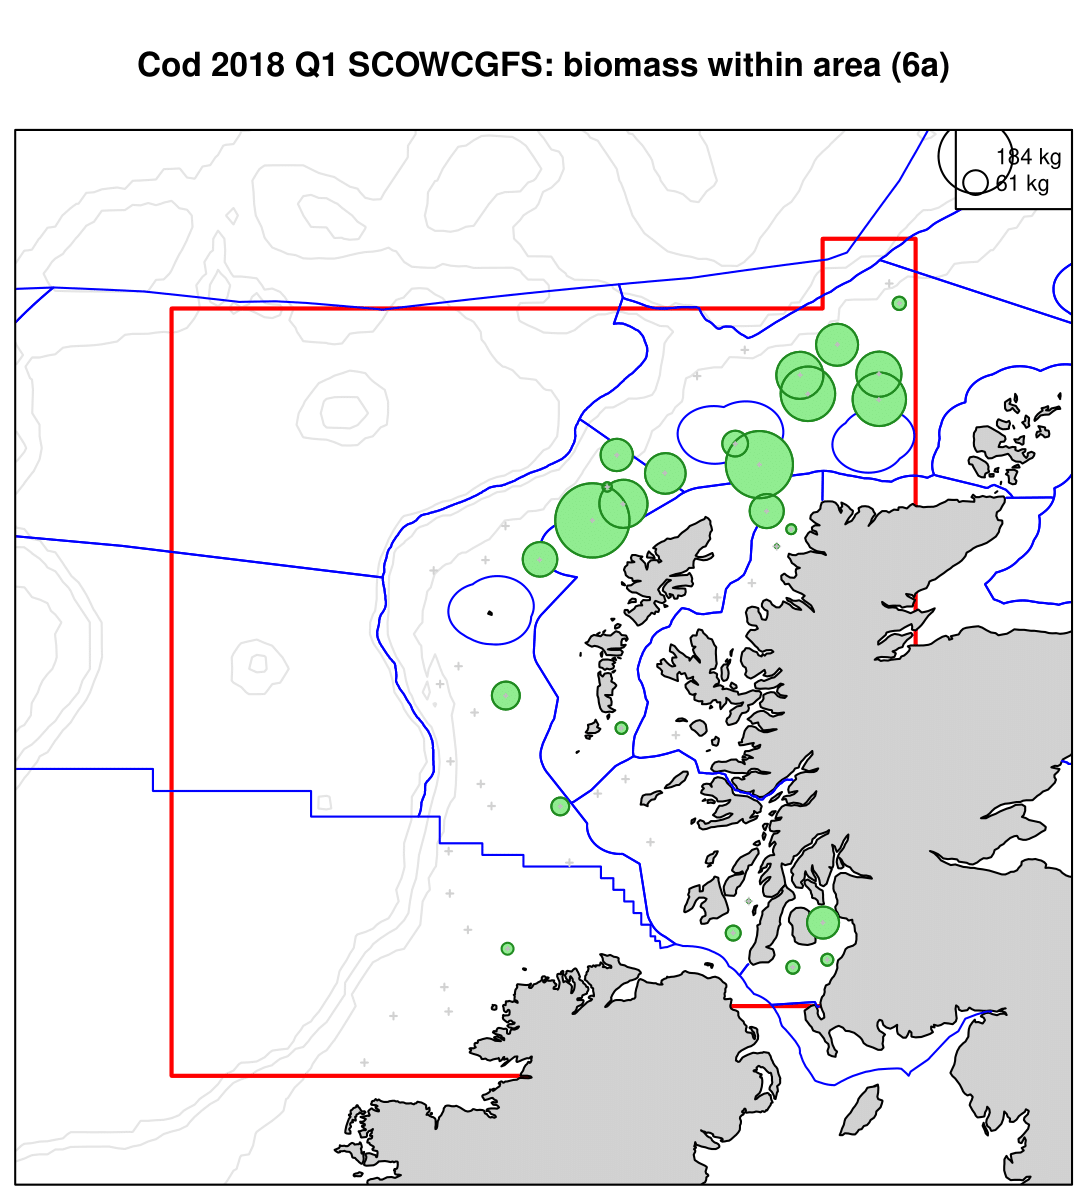
Figure l: Cod 2018 Q1 SCOWCGFS: biomass within area 6a. Source: ICES. Survey-based distribution map for west coast cod, using data from the 2018 SCOWCGFS Q1 survey. The size of the circles is proportional to the square root of the weight of cod caught at that location. |
Herring
North Sea (ICES areas 4, 3a, 7d)
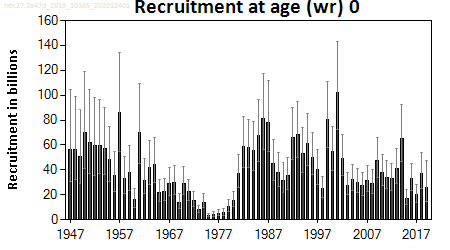
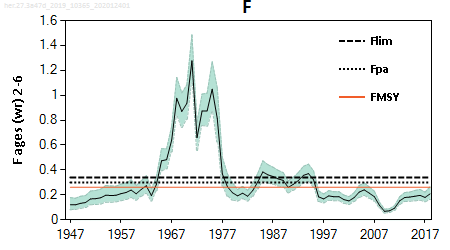
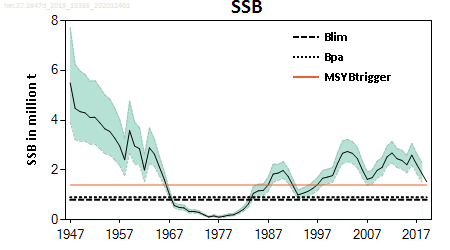
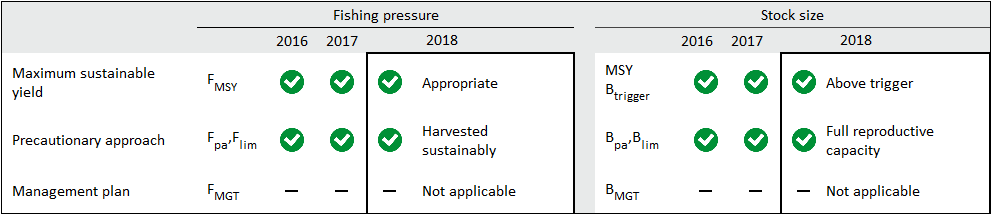
Spawning-stock biomass (SSB) fluctuated between 1.5 and 2.7 million tonnes between 1998 and 2018, and in all years it was above MSY Btrigger. Fishing mortality (F) has been below FMSY since 1996. Recruitment (R) has been relatively low since 2002, with very low recruitment in 2015 and 2017.
 |
 |
 |
 |
|
Figure m: ICES stock summary plots for herring in area 4, 3a, 7d (North Sea, eastern Channel and Skagerrak). Source: ICES |
 |
|
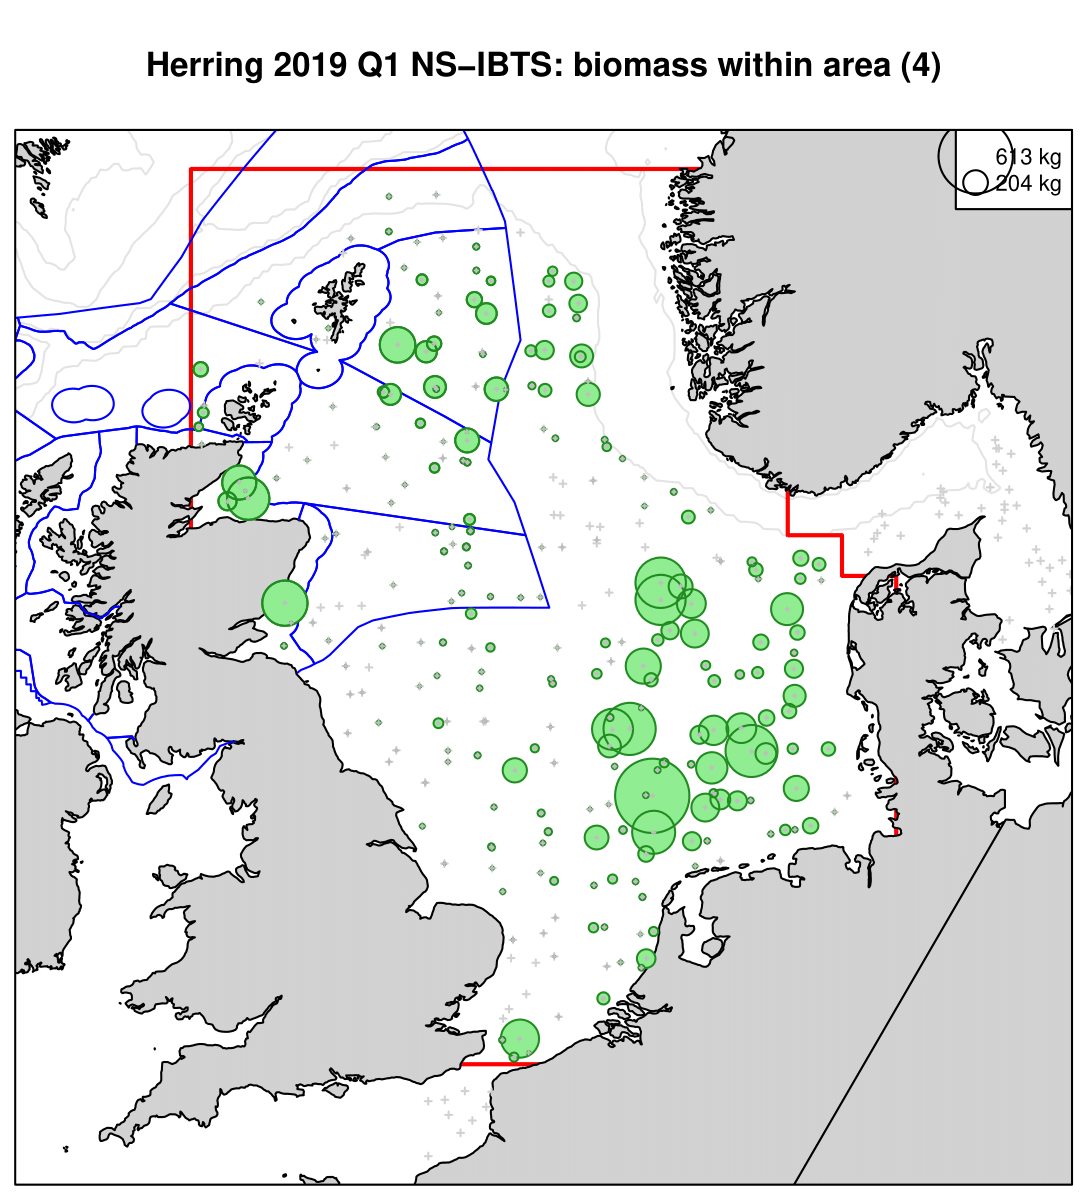
Figure n: Herring 2019 Q1 NS-IBTS: biomass within area 4. Source: ICES. Survey-based distribution map for North Sea herring, using data from the 2019 IBTS Q1 survey. The size of the circles is proportional to the square root of the weight of herring caught at that location. |
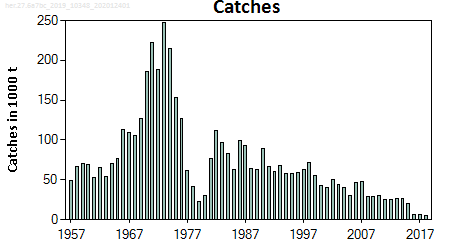
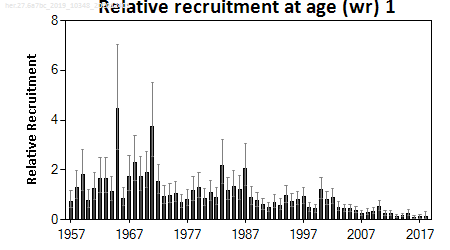
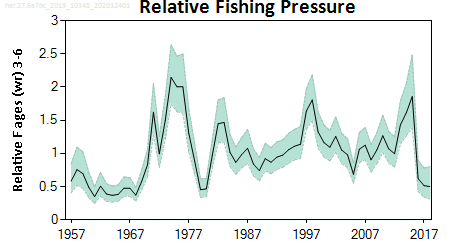
West of Scotland and northern Irish Sea (ICES areas 6a and 7b-c)
Both spawning-stock biomass (SSB) and recruitment (R) have been declining since around 2000 and are at their lowest level in the time series. Fishing mortality (F) has reduced since 2016 when catches have been limited to a monitoring TAC.
 |
 |
 |
 |
|
Figure o: ICES stock summary plots for herring in areas 6a and 7b-c (West of Scotland and northern Irish Sea). Source: ICES |
 |
|
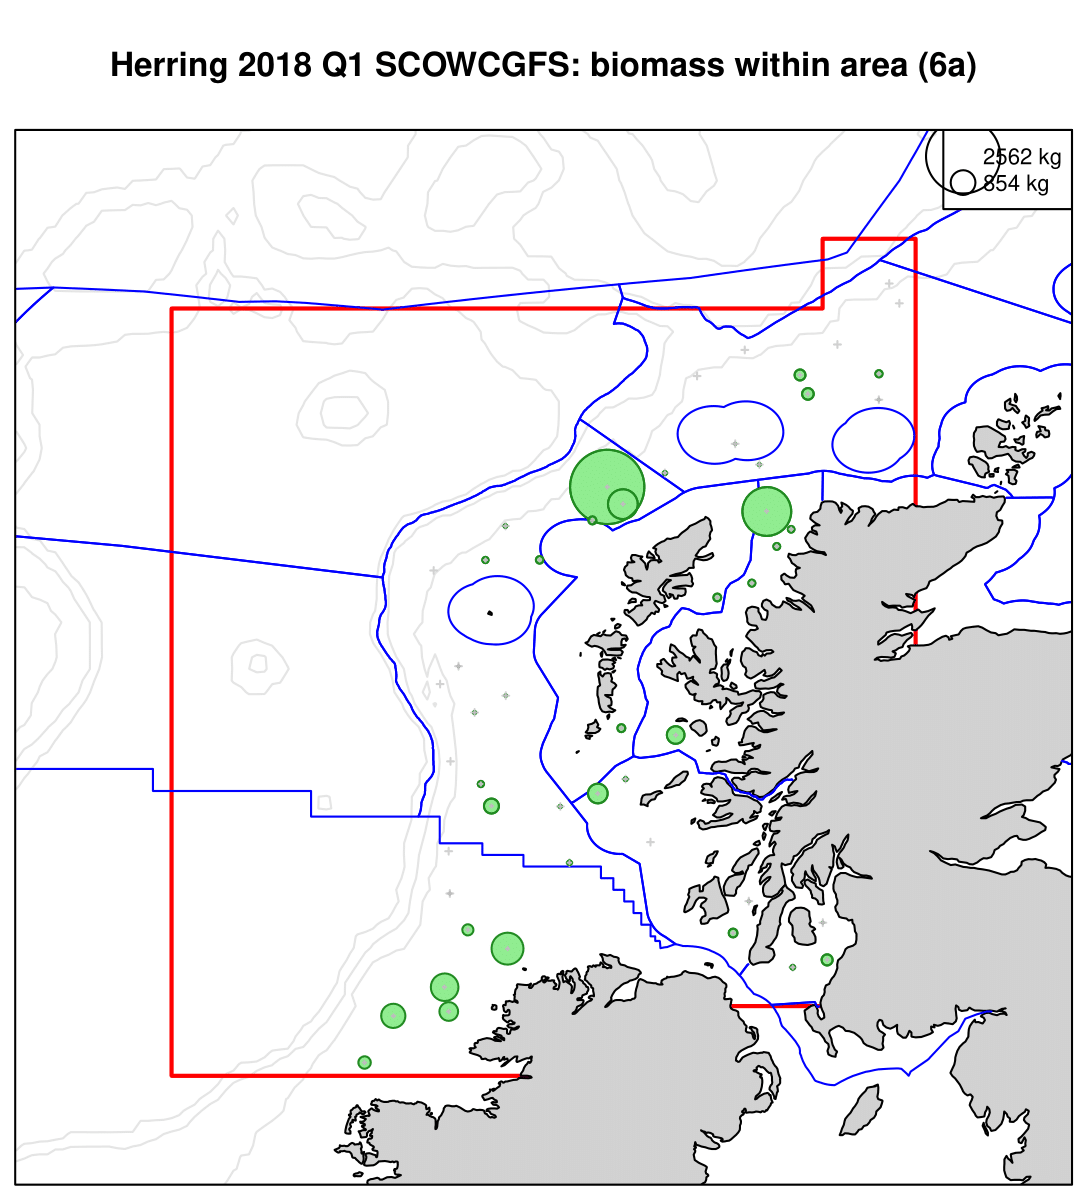
Figure p: Herring 2018 Q1 SCOWCGFS: biomass within area 6a. Source: ICES. Survey-based distribution map for West of Scotland herring, using data from the 2018 SCOWCGFS Q1 survey. The size of the circles is proportional to the square root of the weight of herring caught at that location. |
Hake
Northern stock (ICES areas 4, 6, 7, 3a, 8a–b, and 8d)
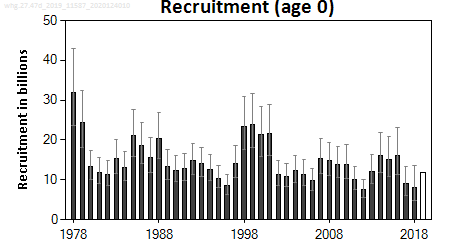
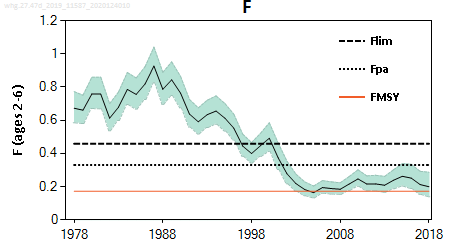
The spawning-stock biomass (SSB) has increased substantially since 2006. In 2016 it reached the maximum in the time series, and since then it has declined slightly. Fishing mortality (F) decreased markedly between 2005 and 2012, and has been stable below FMSY since then. Recruitment is variable without trend. Recent recruitment is uncertain.
 |
 |
 |
 |
|
Figure q: ICES stock summary plots for hake in areas 4, 6, 7, 3a, 8a-b and 8d (Northern hake). Source: ICES |
 |
|
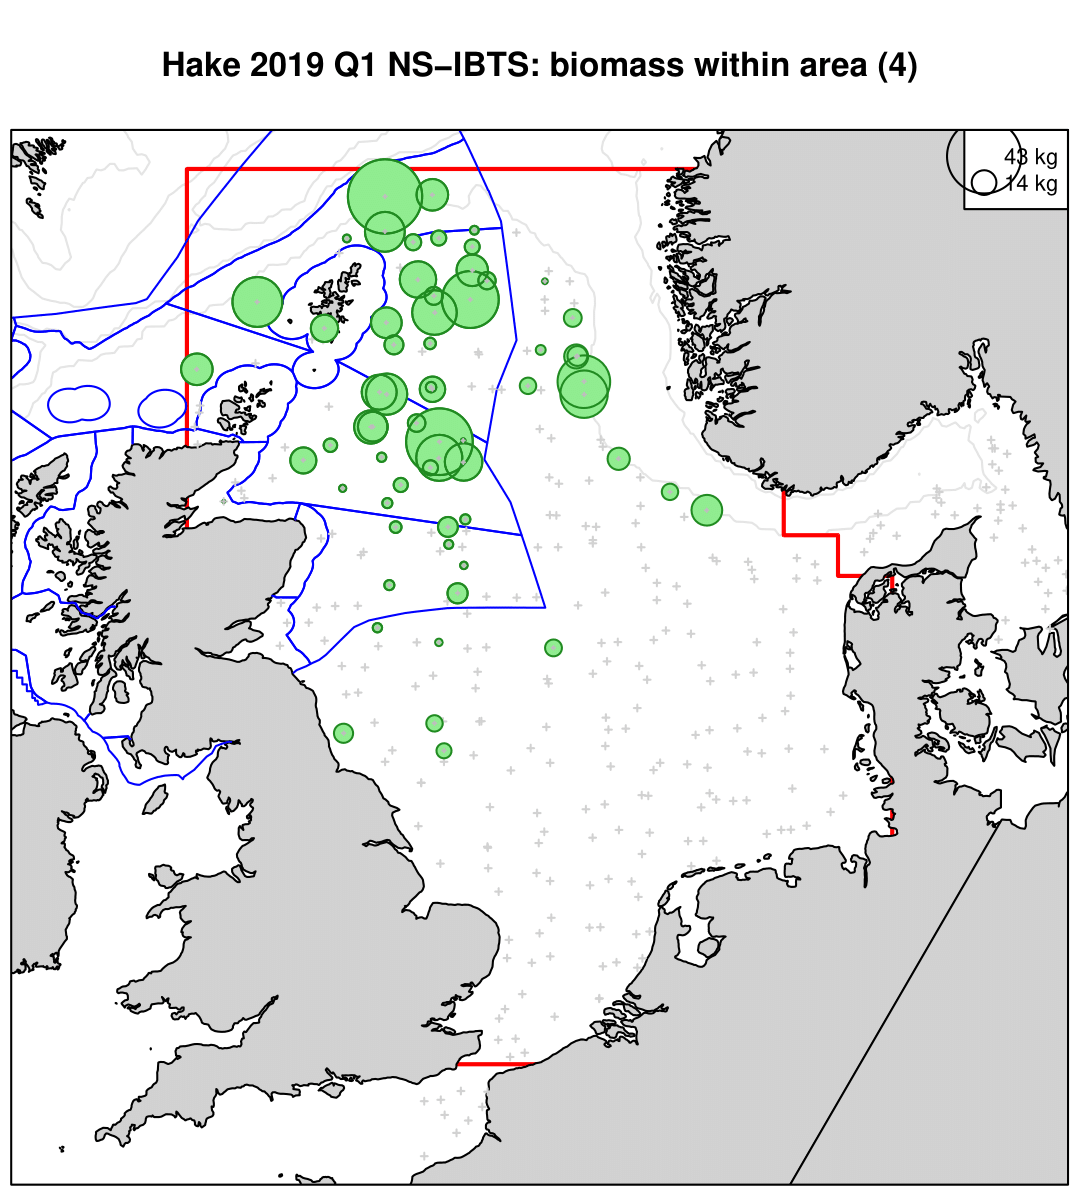
Figure r: Hake 2019 Q1 NS-IBTS: biomass within area 4. Source: ICES. Survey-based distribution map for North Sea hake, using data from the 2019 IBTS Q1 survey. The size of the circles is proportional to the square root of the weight of hake caught at that location. |
 |
|
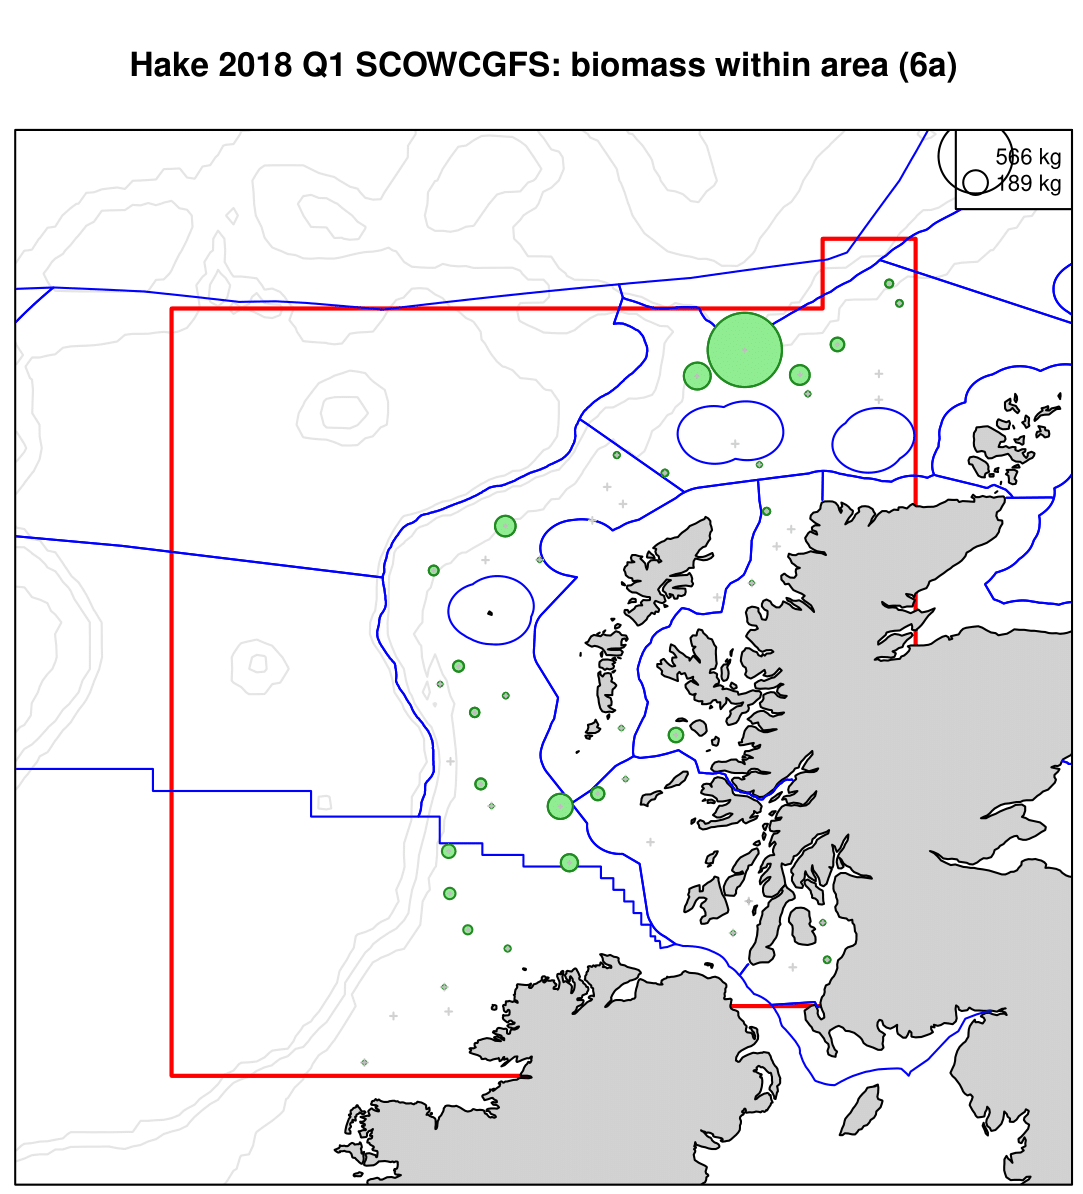
Figure s: Hake 2018 Q1 SCOWCGFS: biomass within area 6a. Source: ICES. Survey-based distribution map for West of Scotland hake, using data from the 2018 SCOWCGFS Q1 survey. The size of the circles is proportional to the square root of the weight of hake caught at that location. |
Whiting
North Sea (ICES areas 4, 7d)
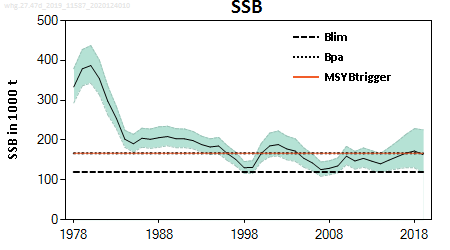
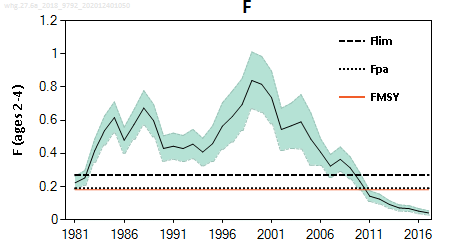
Spawning-stock biomass (SSB) has fluctuated around MSY Btrigger since the mid-1980s and is just below it in 2019. Fishing mortality (F) has been above FMSY throughout the time-series, apart from 2005. Recruitment (R) has been fluctuating without trend, but the last two year classes are below average.
 |
 |
 |
 |
|
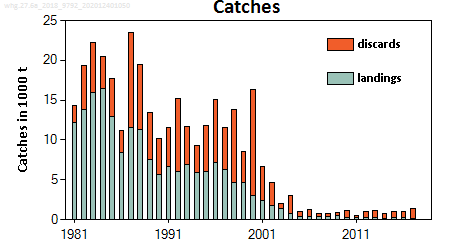
Figure t: ICES stock summary plots for whiting in areas 4 and 7d (North Sea and eastern Channel). Source: ICES |
 |
|
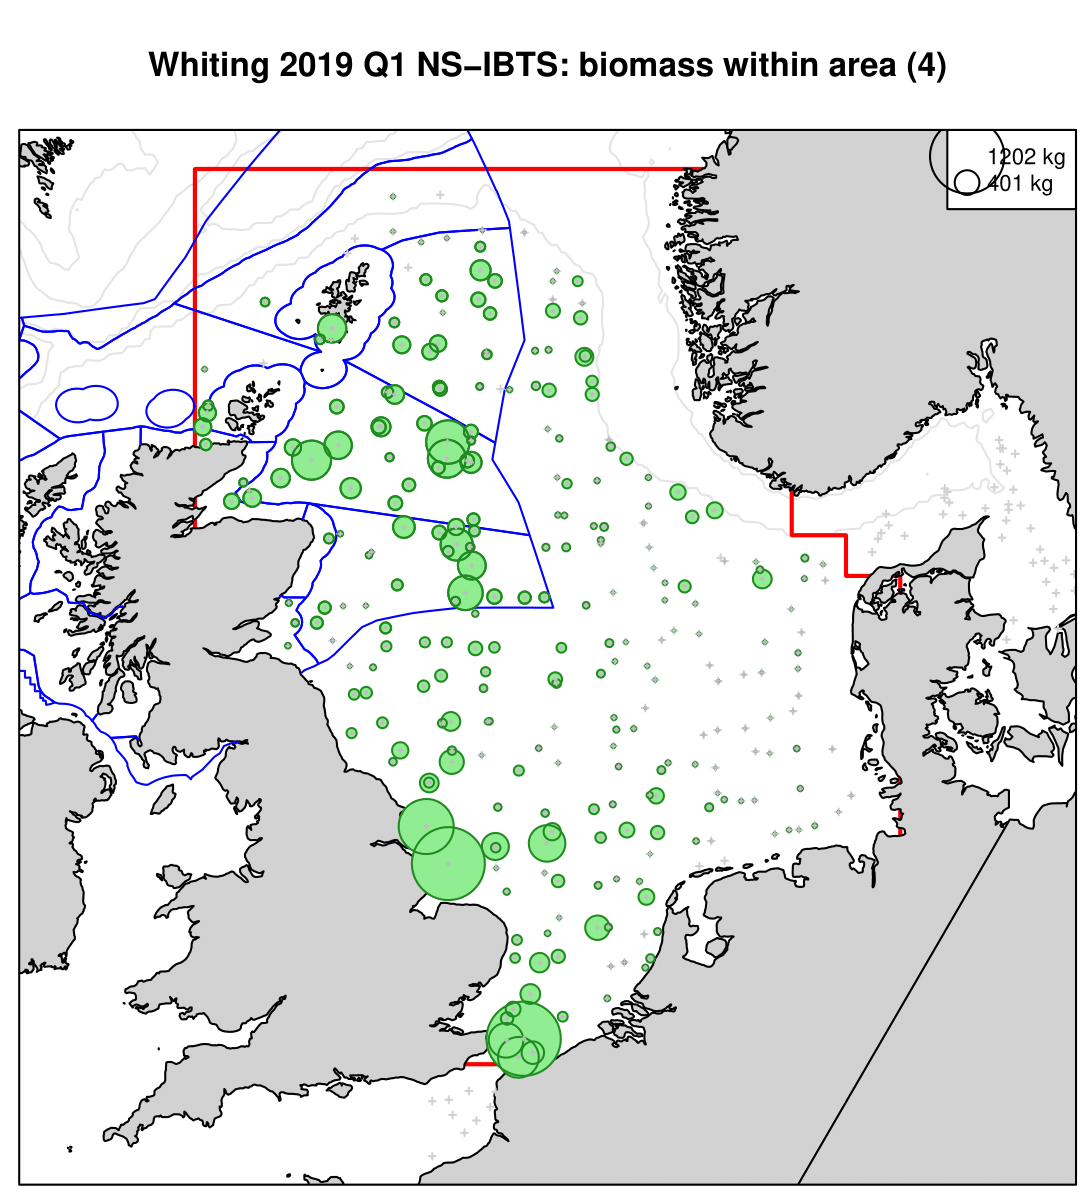
Figure u: Whiting 2019 Q1 NS-IBTS: biomass within area 4. Source: ICES. Survey-based distribution map for North Sea whiting, using data from the 2019 IBTS Q1 survey. The size of the circles is proportional to the square root of the weight of whiting caught at that location. |
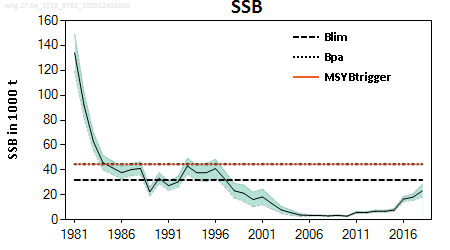
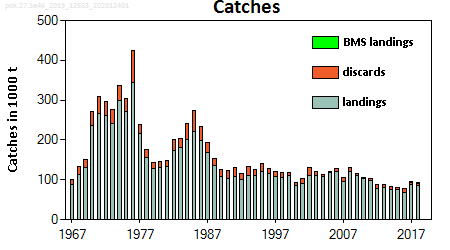
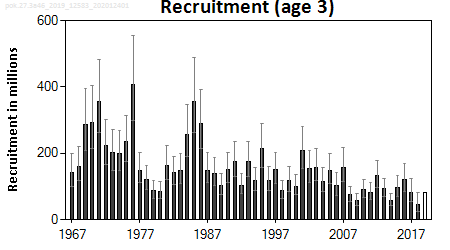
West of Scotland (ICES area 6a; June 2018)
The spawning–stock biomass (SSB) has been increasing since 2010 but remains very low compared to the historical estimates and is below Blim. Fishing mortality (F) has declined continuously since around 2000 and is estimated well below FMSY. Recruitment is estimated to have been very low since 2002, but estimated to have increased in recent years.
 |
 |
 |
 |
|
Figure v: ICES stock summary plots for whiting in area 6a. Source: ICES |
 |
|
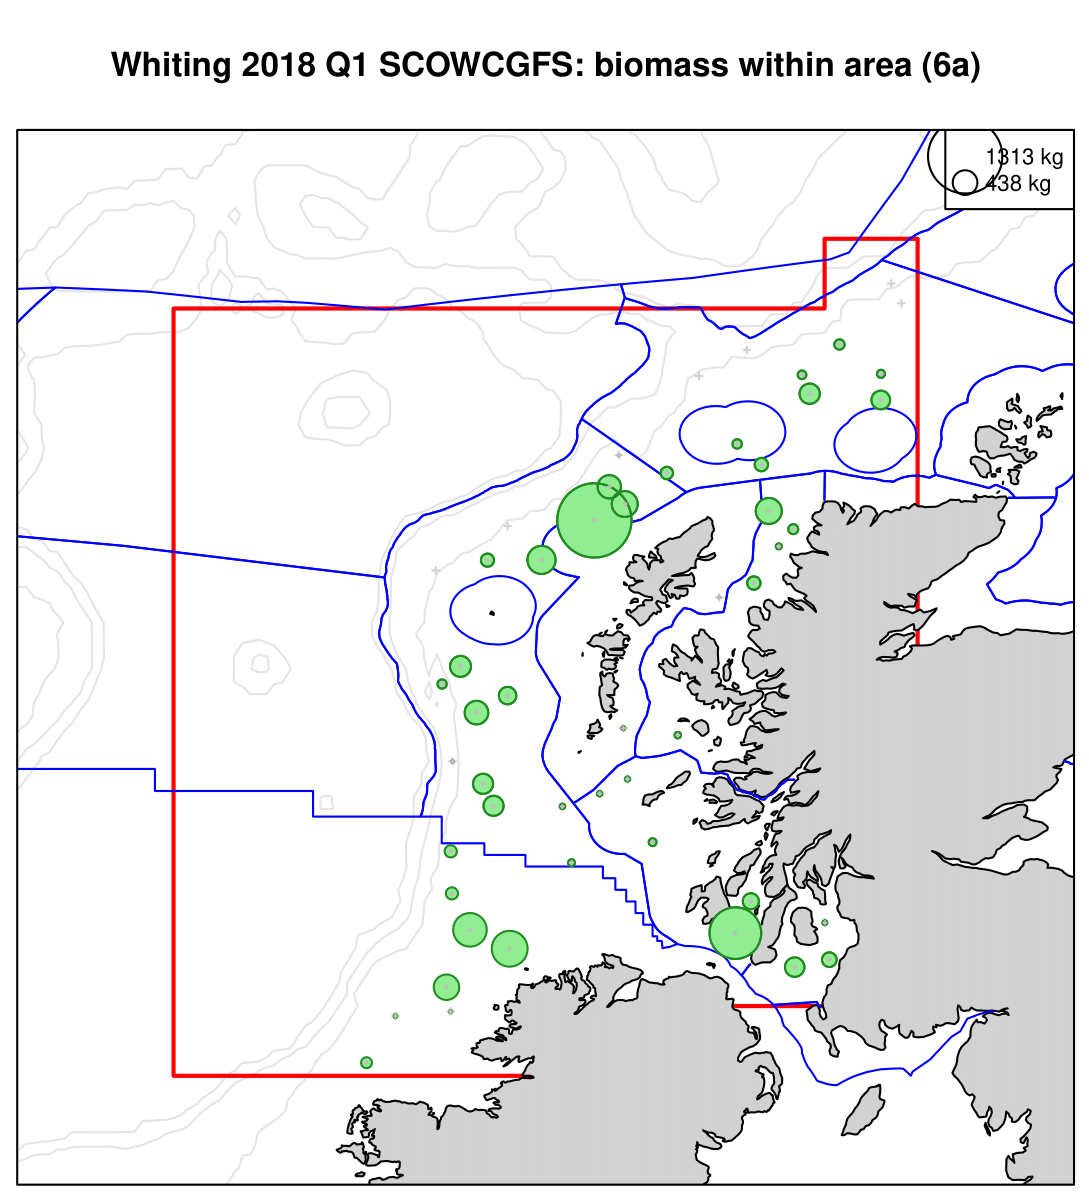
Figure w: Whiting 2018 Q1 SCOWCGFS: biomass within area 6a. Source: ICES. Survey-based distribution map for West of Scotland whiting, using data from the 2018 SCOWCGFS Q1 survey. The size of the circles is proportional to the square root of the weight of whiting caught at that location. |
Saithe
Northern Shelf (ICES areas 4, 6, 3a)
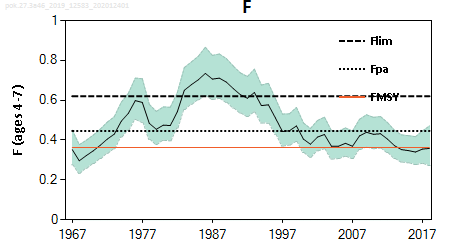
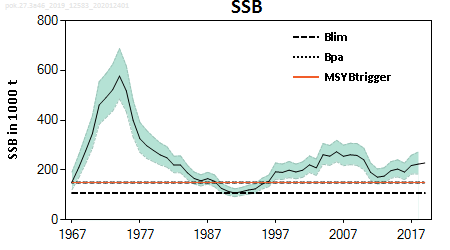
Spawning-stock biomass (SSB) has fluctuated without trend and has been above MSY Btrigger since 1996. Fishing mortality (F) has decreased and stabilized at or below FMSY since 2014. Recruitment (R) has shown an overall decreasing trend over time with lowest levels in the past 10 years.
 |
 |
 |
 |
|
Figure x: ICES stock summary plots for saithe in areas 4, 6 and 3a (North Sea, West of Scotland (inc. Rockall) and Skagerrak). Source: ICES |
 |
|
Figure y: Saithe 2019 Q1 NS-IBTS: biomass within area 4. Source: ICES. Survey-based distribution map for North Sea saithe, using data from the 2019 IBTS Q1 survey. The size of the circles is proportional to the square root of the weight of saithe caught at that location. |
 |
|
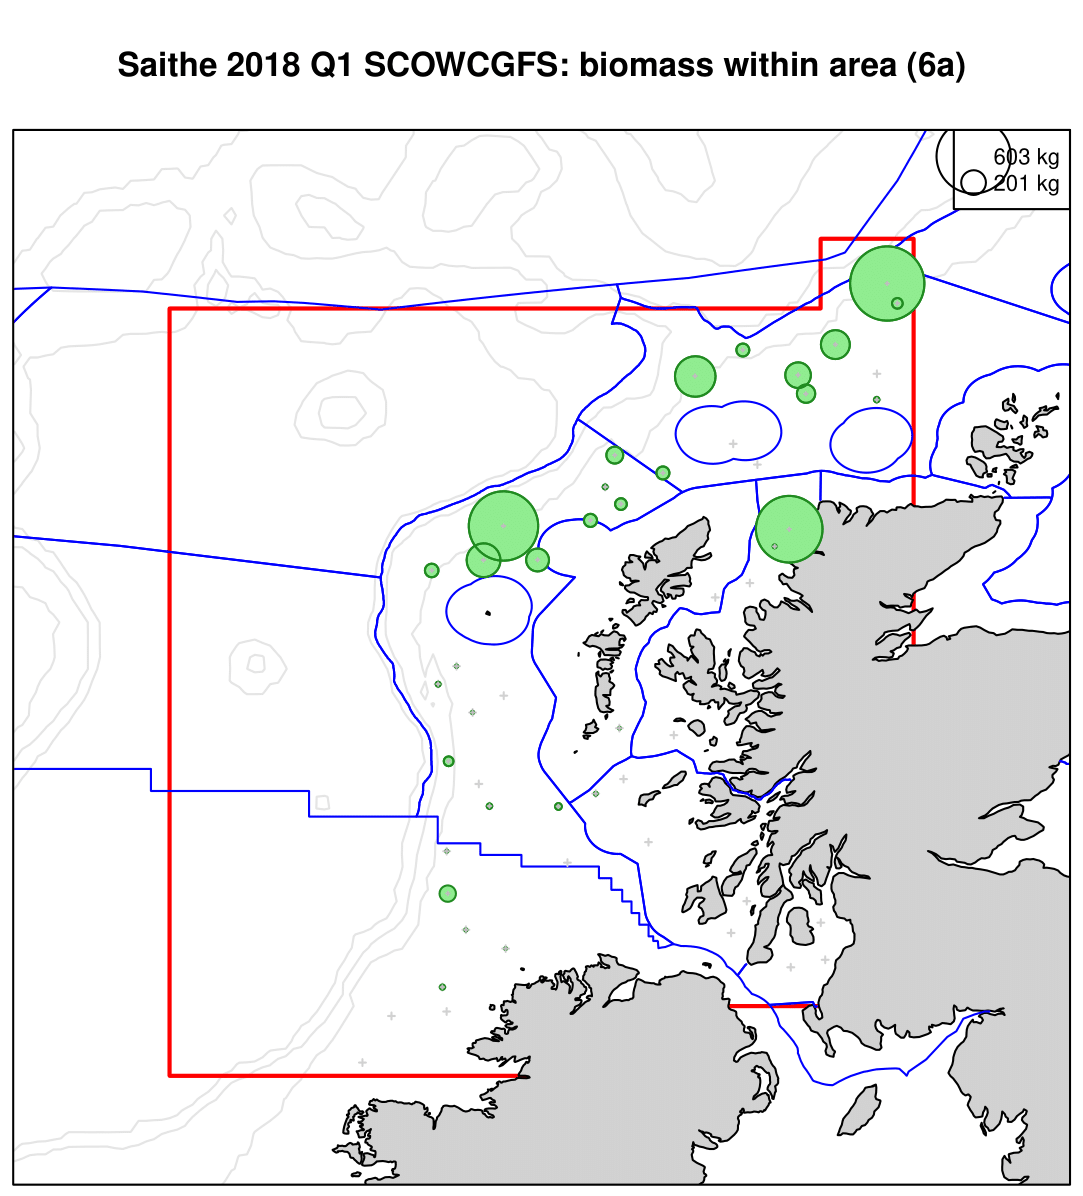
Figure z: Saithe 2018 Q1 SCOWCGFS: biomass within area 6a. Source: ICES. Survey-based distribution map for North Sea saithe, using data from the 2018 SCOWCGFS Q1 survey. The size of the circles is proportional to the square root of the weight of saithe caught at that location. |
 |
|
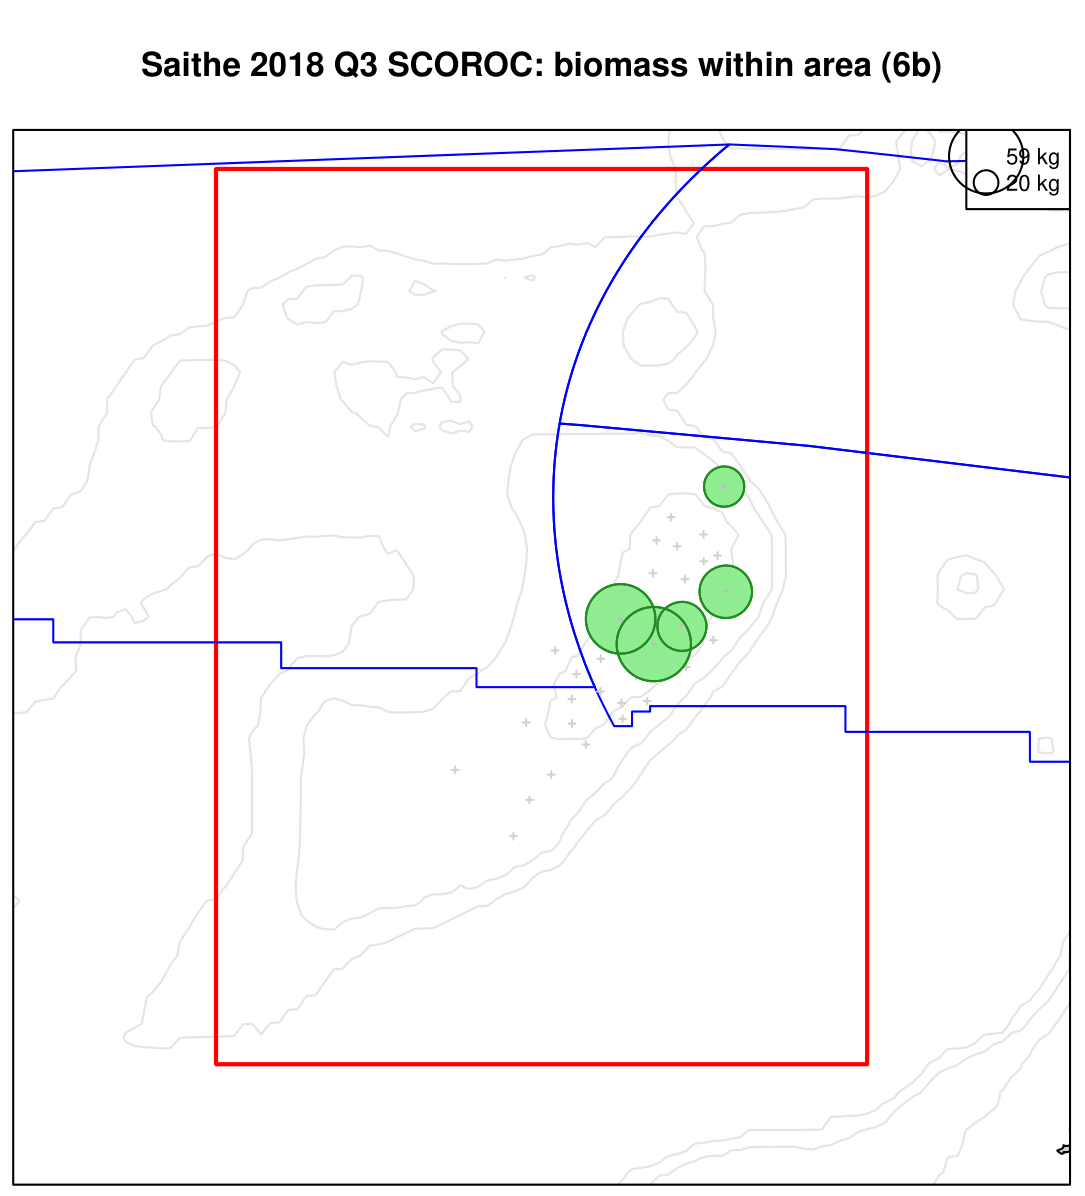
Figure aa: Saithe 2018 Q3 SCOROC: biomass within area 6b. Source: ICES. Survey-based distribution map for Rockall saithe, using data from the 2018 SCOROC Q3 survey. The size of the circles is proportional to the square root of the weight of saithe caught at that location. |
Conclusion
The key commercial stocks covered in this assessment summary are some of the most data-rich in the world, and are extensively analysed by internationally-renowned groups. The Scottish Sustainable Fishing Indicator (SSFI) summarises the recent trends in fishing mortality for these stocks, as compared with the estimated fishing mortality rates that should lead to the maximum sustainable yield. The fishing mortality estimates on which the SSFI are based are measured with varying degrees of uncertainty, but they remain the best estimates generated by ICES.
The SSFI shows a steady increase during 2016 to 2018, from 46% to 54%. However, the indicator is a broad summary metric that conceals stock-specific information. As the stocks are biologically distinct, and subject to different management measures, it is important to note cases for which the trends in fishing mortality are increasing. This is the situation for the important mackerel, monkfish and cod stocks summarised above, and more needs to be done to ensure sustainable fishing opportunities into the future for specific stocks.
Knowledge gaps
The knowledge gaps include current data for predation and natural mortality; the impact of climate change on fish stocks; and comprehensive observer coverage for fishing vessels. It is also not possible to make assessments for Scottish and Offshore Marine Regions (SMRs and OMRs) as these are relatively small compared with the scale at which the stocks are assessed.
The data used to estimate predation and natural mortality are based on the ICES Year of the Stomach initiatives, in which an international collaborative survey effort collates and analyses large numbers of predator stomach contents. This is an expensive undertaking and the last of these was conducted in 1991. The information on prey preferences of key predators may therefore be out of date.
While climate change is clearly instrumental in determining abundance and distribution of commercial fish stocks, it is seldom considered explicitly in these assessments. Their principal purpose is to inform fisheries management for one or two years into the future, and climate is not forecast to change significantly at a scale to affect fish stocks within that time frame. It is also assumed that existing historical assessments will have integrated the historical impact of climate change already. However, longer-term management evaluation is increasingly important, and for this an estimation of climate-change impacts would be very relevant. The key problems are a) forecasting climate change itself, and b) determining the causal mechanism through which climate change is likely to affect fish stocks.
MSS have conducted an observer programme on Scottish fishing vessels, covering around 75 trips annually. Recently these have been augmented by observers from the Scottish Fishermen’s Federation, who cover around the same number of trips under a consistent sampling scheme. However, this represents less than 1% of all trips undertaken, and a more comprehensive coverage is likely to need to involved cameras or other Remote Electronic Monitoring (REM) systems. MSS has trialled these systems since 2008, but further work is needed to develop a fully-implementable system.
Scottish and Offshore Marine Regions (SMRs and OMRs) are relatively small areas when compared with the distributions of most of the key commercial stocks highlighted in this assessment. The survey hauls on which the analysis is based are widely spaced, in order to try and cover the whole area in a limited time. As such SMRs and OMRs may well have very few (or no) survey hauls within them. Evaluating stock trends within SMRs and OMRs would therefore be very difficult, and involve considerable interpolation between observations which may not be reliable. More fine-scale surveys would help to address this knowledge gap, but resources would need to be found for these.
Status and trend assessment
|
Region assessed |
Status with confidence |
Trend with confidence |
|---|---|---|
| All Scotland |
 |
|
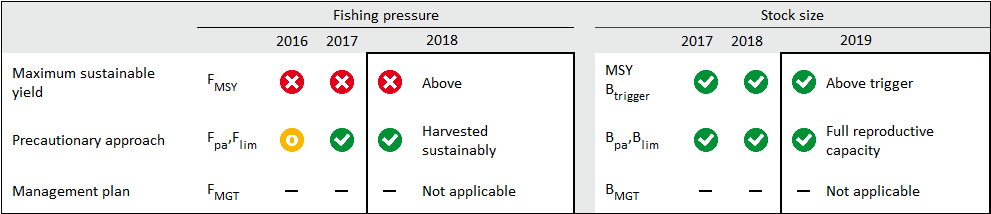
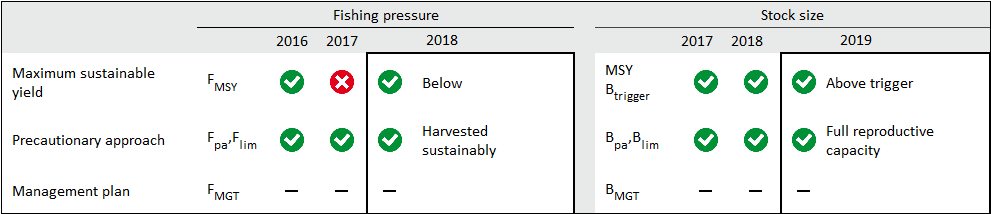
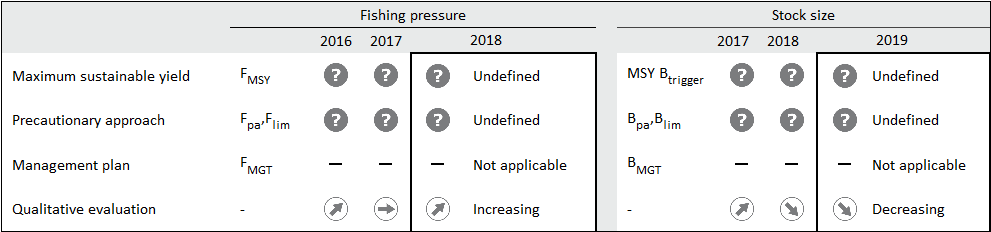
The following tables summarise traffic-light assessments for each of the key commercial stocks considered. Source: ICES
Mackerel in ICES areas 1-8, 9a, 14 |
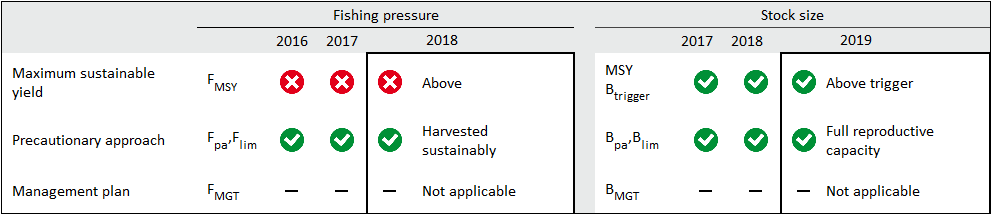 |
Haddock in ICES areas 4, 3a, 6a |
 |
Haddock in ICES areas 6b |
 |
Monkfish in ICES areas 4, 3a, 6 |
 |
Cod in ICES areas 4, 3a, 7d |
 |
Cod in ICES areas 6a |
 |
Herring in ICES areas 4, 3a, 7d |
 |
Herring in ICES areas 6a, 7b-l |
 |
Hake in ICES areas 4, 6, 7, 3a, 8a-b, 8d |
 |
Whiting in ICES areas 4, 7d |
 |
Whiting in ICES areas 6a |
 |
This Legend block contains the key for the status and trend assessment, the confidence assessment and the assessment regions (SMRs and OMRs or other regions used). More information on the various regions used in SMA2020 is available on the Assessment processes and methods page.
Status and trend assessment
|
Status assessment
(for Clean and safe, Healthy and biologically diverse assessments)
|
Trend assessment
(for Clean and safe, Healthy and biologically diverse and Productive assessments)
|
||
|---|---|---|---|
 |
Many concerns |
No / little change |
|
 |
Some concerns |
Increasing |
|
 |
Few or no concerns |
Decreasing |
|
 |
Few or no concerns, but some local concerns |
No trend discernible |
|
 |
Few or no concerns, but many local concerns |
All trends | |
 |
Some concerns, but many local concerns |
||
 |
Lack of evidence / robust assessment criteria |
||
| Lack of regional evidence / robust assessment criteria, but no or few concerns for some local areas | |||
 |
Lack of regional evidence / robust assessment criteria, but some concerns for some local areas | ||
| Lack of regional evidence / robust assessment criteria, but many concerns for some local areas | |||
Confidence assessment
|
Symbol |
Confidence rating |
|---|---|
|
Low |
|
|
Medium |
|
|
High |

Assessment regions
 and the Scottish Offshore Marine Regions (OMRs, O1 – O10)")
Key: S1, Forth and Tay; S2, North East; S3, Moray Firth; S4 Orkney Islands, S5, Shetland Isles; S6, North Coast; S7, West Highlands; S8, Outer Hebrides; S9, Argyll; S10, Clyde; S11, Solway; O1, Long Forties, O2, Fladen and Moray Firth Offshore; O3, East Shetland Shelf; O4, North and West Shetland Shelf; O5, Faroe-Shetland Channel; O6, North Scotland Shelf; O7, Hebrides Shelf; O8, Bailey; O9, Rockall; O10, Hatton.
 Regions. These have been used as the assessment areas for hazardous substances.")
, Regions.")