
Sections
Key message

Background
Heavy metals are ubiquitous in the marine environment being from both natural and anthropogenic sources. Mercury (Hg), cadmium (Cd) and lead (Pb) are three of the most toxic heavy metals commonly found in the marine environment. Natural sources of Cd and Hg include volcanic activity. Principal anthropogenic inputs of mercury to the environment are from fossil fuel combustion, metal and cement production. Inputs of Cd include non-ferrous metal mining and smelting, batteries and the use of phosphate fertilizers. Sources of Pb include non-ferrous metal mining and smelting, batteries, spent ammunition and lost fishing tackle.
Heavy metals often end up in marine sediment, where they may be trapped in lower layers unless the sediments are disturbed. Hg and Cd can bioaccumulate in marine food chains.
Due to their persistence, potential to accumulate and toxicity, analyses (Figure 1) of Hg, Cd and Pb in sediment and biota (fish and shellfish) are required for the OSPAR Coordinated Environmental Monitoring Programme (CEMP), the Marine Strategy Framework Directive (MSFD) and the Water Framework Directive (WFD) (Hg in biota only). Heavy metals have the potential to impact on an organisms activity, growth, metabolism, reproduction and overall chance of survival. To fulfill these monitoring commitments, heavy metals are monitored in sediment and biota as part of the UK Clean Seas Environmental Monitoring Programme (CSEMP) for 4 biogeographic regions (Figure 2): Irish Sea (Clyde and Solway), Minches and Western Scotland, Scottish Continental Shelf and Northern North Sea. See Introduction to SMA2020 for more about the areas used.
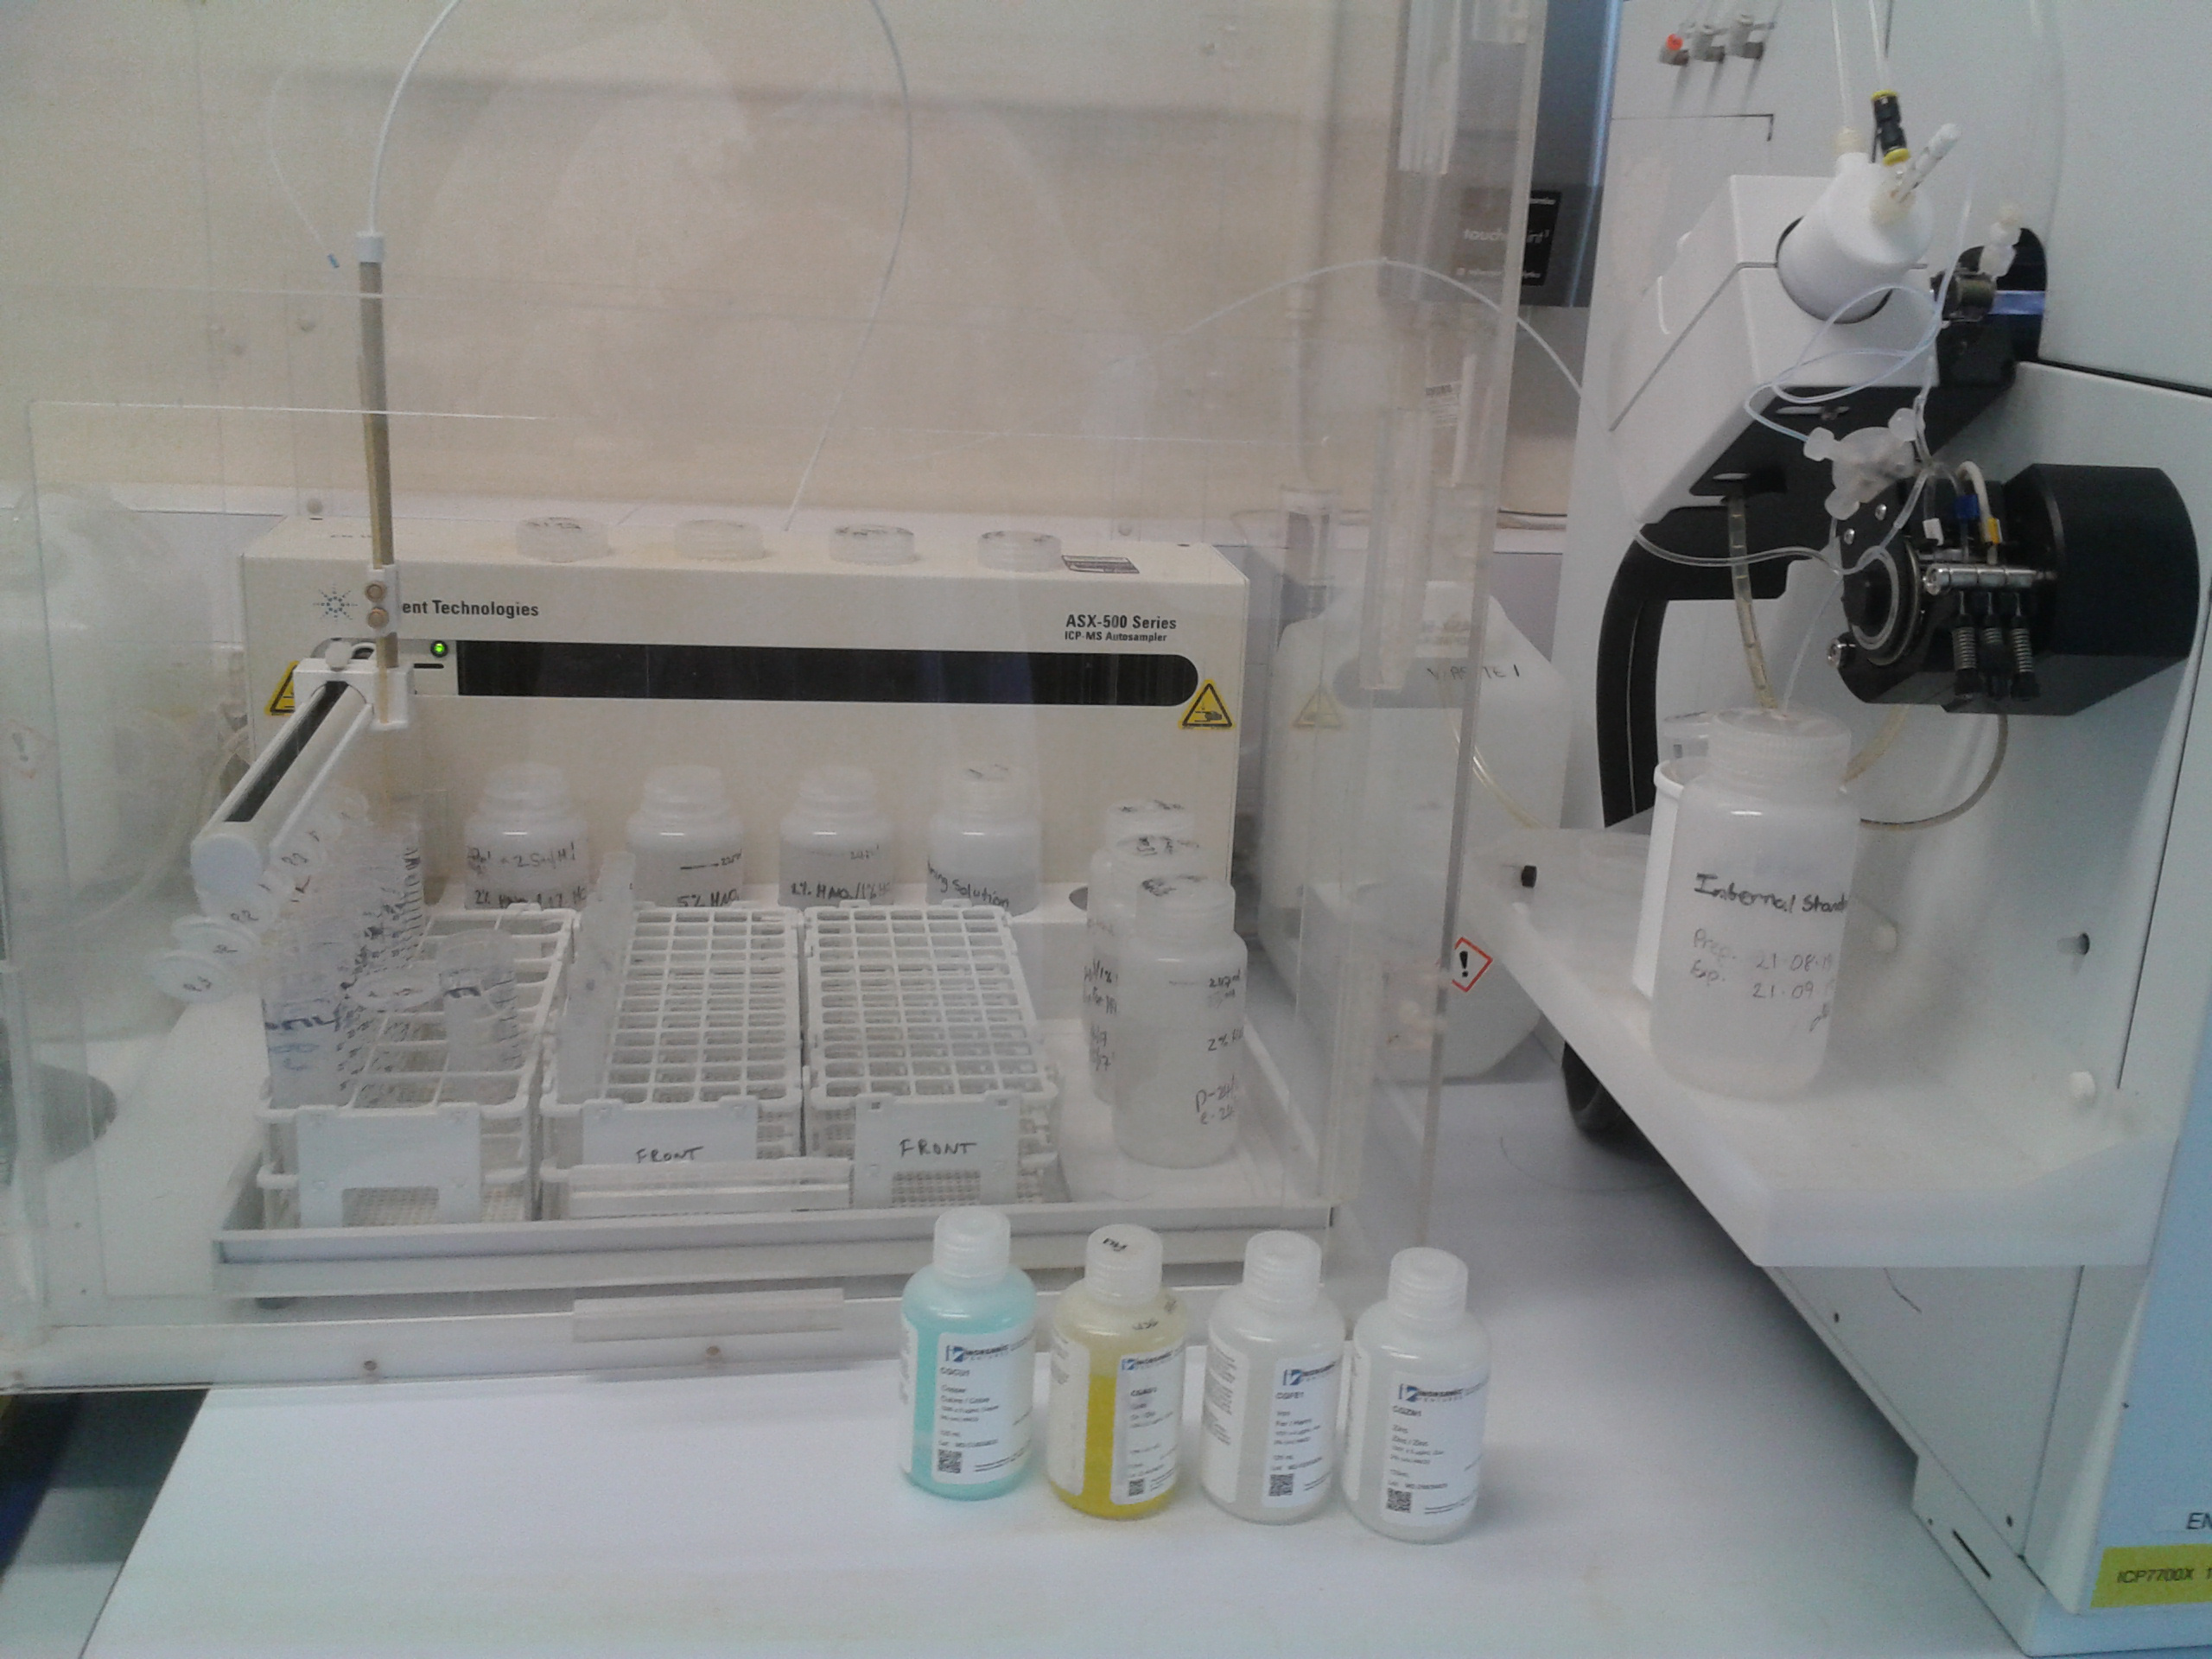
Figure 1: Inductively coupled plasma mass spectrometry (ICP-MS) inlet and autosampler, with standard bottles alongside. Heavy metals were analysed in fish, shellfish and sediment by ICP-MS.
Contaminants and effects monitoring is undertaken in Scottish coastal and offshore areas as part of the UK Clean Seas Environment Monitoring Programme (CSEMP). CSEMP is operated to ensure a coordinated monitoring programme across the United Kingdom. CSEMP contaminant and biological effects data are submitted to the UK Marine Environment Monitoring and Assessment National database (MERMAN) and from there to the International Council for the Exploration of the Sea (ICES) Environmental database.
The main focus of the CSEMP to date has been to meet the temporal trend monitoring requirements of the OSPAR Convention and of compliance with EC Directives such as Water Framework Directive and the Marine Strategy Framework Directive (MSFD) (Directive 2008/56/EC). The UK monitors substances detailed in the OSPAR Coordinated Environmental Monitoring Programme (CEMP) in sediment, fish and shellfish. The CEMP includes the monitoring of polycyclic aromatic hydrocarbons (9 parent PAHs), polychlorinated biphenyls (ICES7 PCBs), polybrominated diphenyl ethers (9 PBDE congeners) and heavy metals (Hg, Cd and Pb) in sediment and biota and tributyltin (TBT) in sediment.
The OSPAR Strategy for Hazardous Substances has a strategic objective which is to ‘Move towards the cessation of discharges, emissions and losses of hazardous substances by 2020 with the ultimate aim of achieving concentrations in the marine environment of near background for naturally occurring substances and close to zero for man-made substances’. Descriptor 8 (contaminants and their effects) is one of the eleven MSFD qualitative descriptors for determining Good Environmental Status (GES). To monitor compliance with GES for Descriptor 8, common indicators for contaminants and biological effects should be measured in environmental samples and compared to assessment criteria.
Metals are released into the marine environment from both anthropogenic and natural inputs. The main anthropogenic inputs of mercury are from fossil fuel combustion, metal and cement production. Natural sources include emissions from volcanoes. Mercury is one of the most toxic metals to marine life and can be transformed by biochemical and biological reactions into more toxic organic compounds (e.g. methyl mercury). Both neurotoxicity and nephrotoxicity have been associated with acute methylmercury poisoning incidents in humans, and neurotoxicity, particularly in the developing foetus, has been associated with lower level chronic exposures (Mergler et al., 2007; Scheuhammer, Meyer, Sandheinrich & Murray, 2007; Sheehan et al., 2014).
Inputs of Cd to the marine environment include natural sources, such as volcanic activity. Anthropogenic inputs include non-ferrous metal mining and smelting, batteries and the use of phosphate fertilizers.
Inputs of Pb include non-ferrous metal mining and smelting, spent ammunition and lost fishing tackle.
The release of heavy metals into freshwater, transitional and coastal waters are regulated by the Scottish Environment Protection Agency (SEPA) through The Scotland River Basin District (Standards) Directions 2014, where environmental quality standards are set in freshwater and marine waters.
Heavy metals settle in marine sediment, where they may be trapped in lower layers unless the sediments are disturbed. Hg and Cd can accumulate in marine biota, and concentrations of Hg will increase in marine food chains such that it can reach harmful concentrations in top-predators such as marine mammals (Lavoie, Jardine, Chumchal, Kidd & Campbell, 2013). Pb is mainly particle bound and whilst it can be concentrated from the water column by organisms, it tends not to bioaccumulate and does not biomagnify within the food chain.
Due to their persistence, potential to accumulate and toxicity, monitoring of heavy metals (Cd, Hg and Pb) in sediment and biota is required for the OSPAR CEMP, the Marine Strategy Framework Directive (MSFD) and the Water Framework Directive (WFD). To fulfil these commitments monitoring of heavy metals in sediment and biota are undertaken in Scotland as part of CSEMP.
Monitoring of heavy metals in sediment and biota (shellfish and fish) is undertaken in Scottish coastal (SEPA and Marine Scotland Science (MSS)) and offshore areas (MSS) as part of the CSEMP. WFD monitoring in coastal and transitional water bodies is undertaken by SEPA (mainly water and some shellfish). SEPA and MSS heavy metal data in sediment and biota is submitted to MERMAN and has been used in this assessment.
The 2019 assessment of CSEMP data describes the trends and status of contaminant concentrations at sediment (1999 - 2017) and biota (shellfish and fish, 1999 - 2018) monitoring stations in four Scottish biogeographic regions for which an assessment was possible. Metals data for sediment are only available up to 2017, after which time MSS stopped undertaking this analysis. Assessments are made for many time series, each of a single contaminant at a single monitoring station. This section describes how the results of the individual time series are synthesised to assess status and trends at the biogeographic regional level (Table a). Three trace metals (Cd, Hg and Pb) for which assessment criteria were available, were assessed for status and trends (Table b).
Assessment scales
Status and trends assessments were conducted for 4 Scottish biogeographic regions. Figure 2a and b shows all the monitoring stations where there are suitable data for sediment and biota, with the magenta dots showing stations used for trend and status assessments and cyan dots showing stations where there is only status information. The areas delineated by the grey lines are the biogeographic regions. The number of stations in each biogeographic region is given in Table a.
|
Scottish Biogeographic Region
|
Sediment
|
Biota (shellfish and fish)
|
||||||||||
|
trends
|
status
|
trends
|
status
|
|||||||||
|
Cd
|
Hg
|
Pb
|
Cd
|
Hg
|
Pb
|
Cd
|
Hg
|
Pb
|
Cd
|
Hg
|
Pb
|
|
|
Irish Sea (Clyde and Solway)
|
4
|
4
|
4
|
6
|
6
|
6
|
9
|
14
|
8
|
10
|
15
|
10
|
|
Minches and Western Scotland
|
4
|
5
|
5
|
5
|
5
|
5
|
4
|
8
|
4
|
5
|
8
|
5
|
|
Scottish Continental Shelf
|
1
|
0
|
1
|
1
|
1
|
1
|
1
|
5
|
1
|
1
|
5
|
1
|
|
Northern North Sea
|
11
|
12
|
15
|
16
|
16
|
16
|
9
|
25
|
9
|
14
|
30
|
14
|
Assessment of concentrations of Cd, Hg and Pb in sediment and biota (fish and shellfish)
Heavy metals are monitored in sediment and biota (shellfish and fish liver/muscle) as part of the CSEMP. Sampling and chemical analysis methodologies met the relevant OSPAR requirements (OSPAR, 2008). Statistical assessments of status and trends were also based on OSPAR methodologies.
OSPAR Environmental Assessment Criteria (EACs) are not available for the assessment of heavy metals in sediment or biota. Therefore to assess if adverse effects are likely to occur in marine life “proxy EACs” were used. The Effects Range Low (ER-L) values that were developed by the US National Oceanic and Atmospheric Administration were used as the proxy EACs for sediment (Long, Macdonald, Smith, & Calder, 1995).
The WFD introduced Environmental Quality Standards (EQS) for some contaminants in biota, including Hg. The EQS for Hg is less than the OSPAR Background Assessment Concentration (BAC). In addition, there are a number of technical issues with the use of this biota EQS which still need to be resolved, such as the adjustment for trophic level. Although the use of the EQS for the assessment of Hg in biota has been considered for use in OSPAR assessments, to date it has not been used and was therefore not used in this assessment.
OSPAR use the food standards set out in EC Regulation No 1881/2006 as proxy EACs in the status assessment of heavy metals in biota. The Commission Regulation (EC) No 1881/2006 sets Maximum Permissible Concentrations (MPC) for contaminants in foodstuffs to protect public health. This regulation includes maximum levels for Pb, Hg and Cd in bivalve molluscs and fish muscle. For CSEMP, Hg is required to be measured in fish muscle and mussels, therefore the corresponding EC MPCs were used to assess Hg. However Pb and Cd are measured in fish liver (as well as mussels), but no MPC is available for fish liver. It is recognised that Cd and Pb concentrations in fish liver are naturally greater than in fish muscle, and therefore that fish muscle standards cannot be used. Therefore the statutory dietary limits for Cd and Pb in bivalve mollusc tissue are used for the assessment of Cd and Pb concentrations in fish liver, as well as for mussels.
In the status assessment of metals in biota, orange is used rather than green when concentrations are above BACs but below the proxy EAC due to the uncertainties in using the MPC for contaminants in foodstuffs for environmental assessments.
|
Sediment
|
Biota
|
||||
|
BAC
(mg kg-1 dw)
|
ER-L
(mg kg-1 dw)
|
BAC
(μg kg-1 dw)
bivalves
|
BAC
(μg kg-1 ww)
fish
|
MPC
(μg kg-1 ww)
|
|
|
Cadmium
|
0.31
|
1.2
|
960
|
26
|
1,000
|
|
Mercury
|
0.07
|
0.15
|
90
|
35
|
500
|
|
Lead
|
38
|
47
|
1,300
|
26
|
1,500
|
- all concentrations for sediment are expressed as mg kg-1 dw.
- BACs for sediment are normalised to 5% aluminium.
- BACs for mussels are expressed as μg kg‑1 dw and BACs for fish and ECs are expressed as μg kg-1 ww.
-
there is at least one year with data in the period 2013 - 2018 for biota or 2012 - 2017 for sediment.
-
there are at least three years of data over the whole-time series.
-
a parametric model can be fitted to the data and used to estimate the mean concentration in the final monitoring year (or, occasionally, if a non-parametric test of status is applied).
-
there are at least five years of data over the whole-time series.
-
a parametric model can be fitted to the data and used to estimate the trend in mean concentrations.
For the regional assessment, the results from the individual time series are combined. Essentially, a summary measure of status or trend is obtained from each time series. These are then modelled, using a linear mixed model, to estimate the mean status, or the mean trend in each biogeographic region. Only biogeographic regions with at least three monitoring stations with good geographic spread are considered in the regional assessment.
The trend analysis is further restricted to time series from monitoring stations that are classified as ‘representative’. ‘Baseline’ stations (those with near pristine conditions or only subject to very diffuse inputs) are omitted because any trends there will likely be caused by different processes to those at representative stations. Similarly ‘impacted’ stations (those close to a point source) are omitted because trends there will likely reflect changes due to the point source, and will be ‘unrepresentative’ at the regional level. There are no restrictions on the time series used in the status analysis based on the classification of the monitoring station; time series from baseline, representative and impacted stations are all included.
Results
Hg, Cd and Pb concentrations are measured in sediment and biota (shellfish and fish) samples taken between 1999 and 2017 (sediment) or 2018 (biota) from four biogeographic regions (Figure 2), in cycles varying from annually to every six years. Only biogeographic regions with at least three stations with a reasonable geographic spread were included in the regional assessment of status and trends. There were insufficient sites for the regional assessment of status and trends of metals in sediment and biota from Scottish Continental Shelf. Shellfish (blue mussel) were collected in coastal and estuarine areas only, whilst sediment and fish were collected from coastal and more offshore areas.
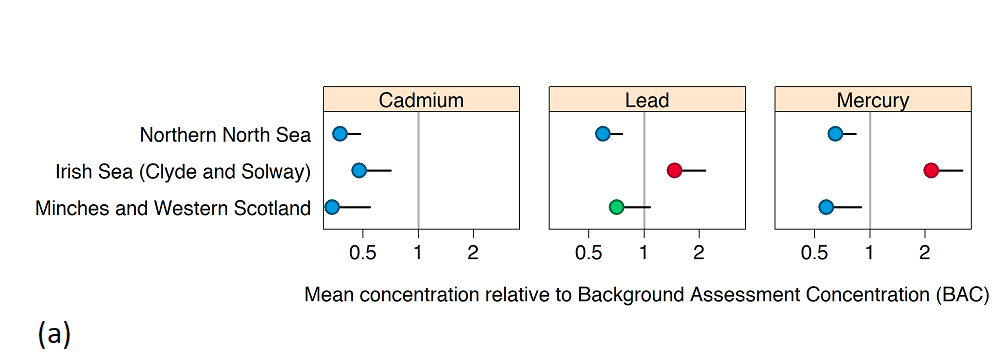
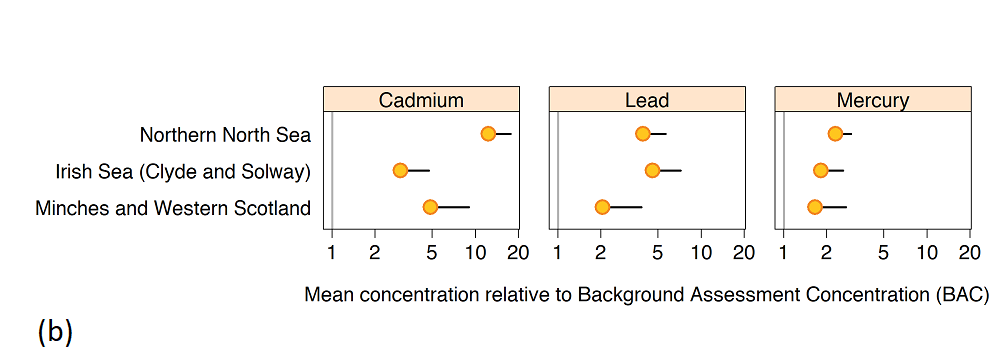
Heavy metal concentrations in sediment and biota (blue mussels and fish) were compared to the OSPAR Background Assessment Concentration (BAC). BACs are used to assess whether concentrations are near background values for naturally occurring substances, such as heavy metals. In addition, metal concentrations in shellfish and fish were compared to the EC Maximum Permissible Concentrations (MPC) and concentrations in sediment compared to the United States Environmental Protection Agency’s Effects Range-Low (ER-L) (Figure 3). Adverse effects on marine organisms are rarely observed when concentrations are below the ER-L value.
The highest Hg and Pb concentrations in sediment were in the Irish Sea (Clyde and Solway), with mean regional concentrations exceeding the ER-L. The Irish Sea (Clyde and Solway) includes the Clyde, the most industrialised and urbanised Scottish sea area. Cd in sediment was at background in all three assessed regions. Hg and Pb in sediment were at background in the Northern North Sea along with Hg in sediment in the Minches and Western Scotland region. Heavy metal concentrations in biota were similar in all three biogeographic regions, with mean regional concentrations for all three metals being above background but below the MPC.
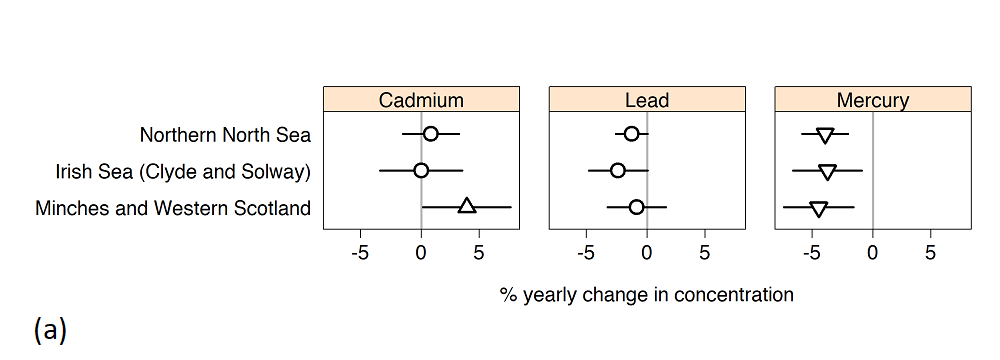
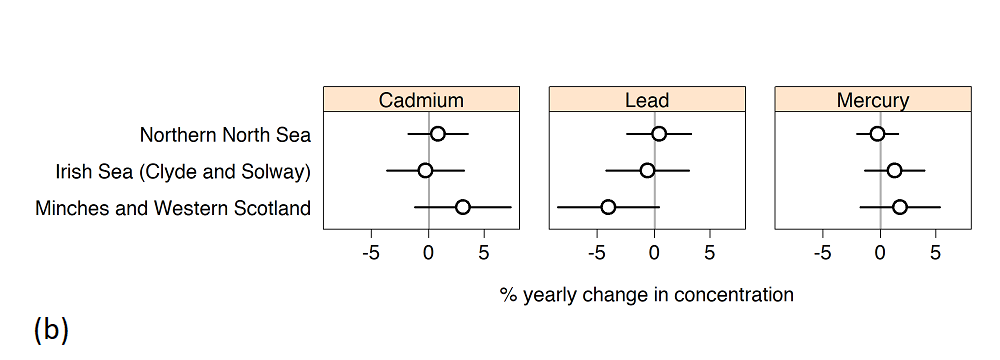
Trends in heavy metal concentrations were assessed in biogeographic regions where there were at least five years of data (Figure 4). Three regions were assessed for trends in sediment and biota, where concentrations were either stable or declining, except for Cd in sediment in the Minches and Western Scotland region. Although there was a significant increasing trend for Cd in sediment in the Minches and Western Scotland region, concentrations are still at background (<BAC). Hg concentrations are declining in sediment in )all three regions. Metal concentrations are stable in biota in all regions assessed. Similar to sediment, a positive %yearly change was observed for biota in the Minches and Western Scotland region, however in this case the increase was not significant.
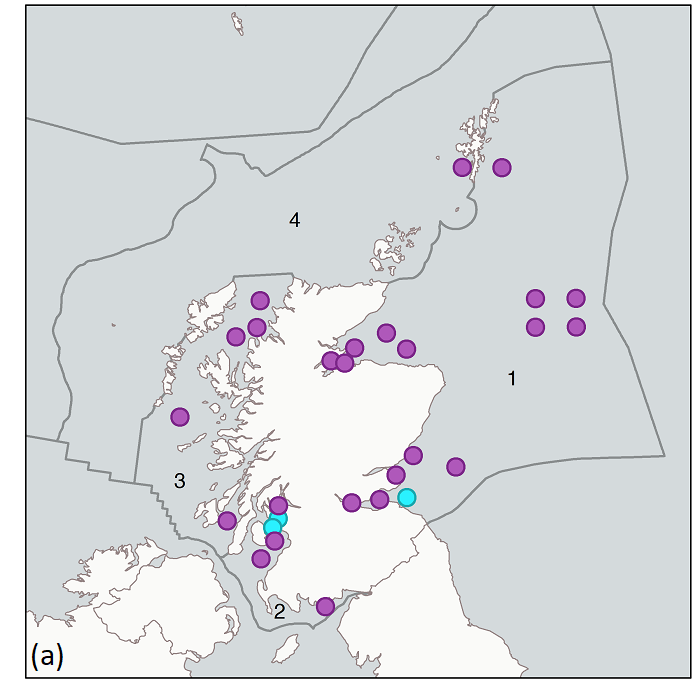
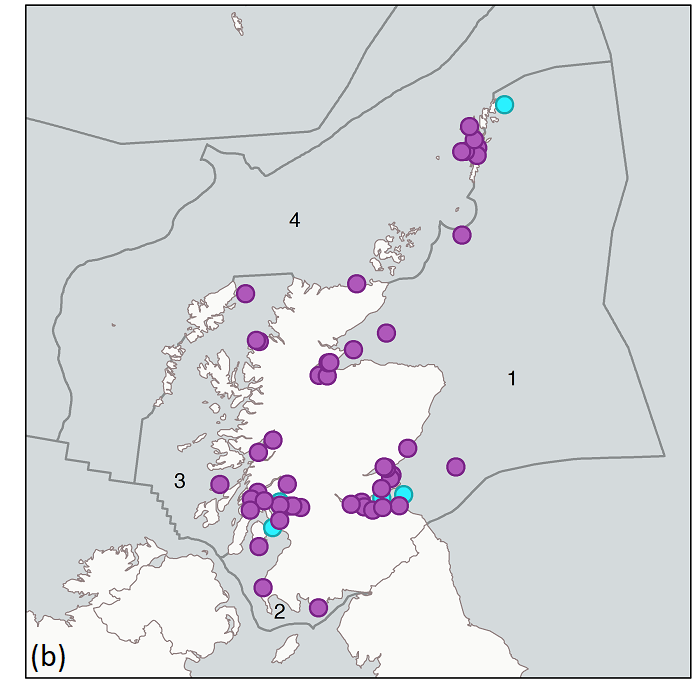
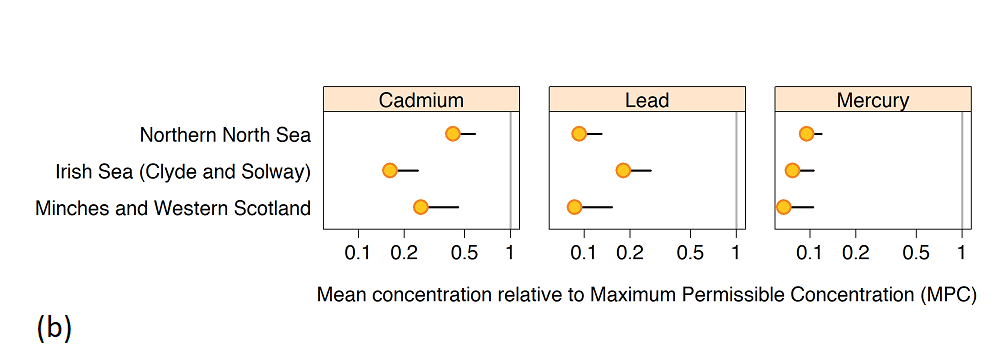
Figure 3: Status assessment; mean Hg, Cd and Pb concentration in (a) sediment and (b) biota (fish and shellfish) in each Scottish biogeographic region relative to the ER-L (sediment) or European Commission Food Limit (MPC; biota) (with 95 % confidence limits), where the ER-L or MPC is 1. Concentrations are significantly below the ER-L/MPC if the upper confidence limit is below 1. Blue = statistically significantly below the BAC. Green = at or above the BAC but statistically significantly below the ER-L. Orange = at or above the BAC but statistically significantly below the MPC. Red = statistically significantly above the ER-L/MPC. Orange is used rather than green due to the uncertainties in using the EC Maximum Permissible Concentrations (MPC) for contaminants in foodstuffs for environmental assessments.
MSS and SEPA Hg, Cd and Pb data were used in the assessment, with laboratories complying with ISO 17025, being UKAS accredited and participating in the QUASIMEME proficiency testing scheme. Therefore, there is high confidence in the quality of the data used in this assessment. The data have been collected over many years using established sampling methodologies. In addition, established and internationally recognised protocols for monitoring and assessment are used, therefore there is also high confidence in the methods. The assessment methodology has been developed and improved since the assessment for Scotland’s Marine Atlas (Baxter et al., 2011), with a regional assessment being undertaken and presented here rather than the individual station assessment presented in the 2011 Atlas.
The number of stations assessed for status and trends in each of the 4 biogeographic regions is shown in Table a. Mean regional heavy metal concentrations relative to the BAC for sediment and biota are shown in Figure a. In sediment Cd was at background (<BAC) in the three assessed regions as were Hg and Pb in sediment in the Northern North Sea and Hg in the Minches and Western Scotland region. Highest Hg and Pb concentrations in sediment were in the Irish Sea (Clyde and Solway), with mean regional concentrations being unacceptable, exceeding the ER-L. The Irish Sea (Clyde and Solway) includes the Clyde, the most industrialised and urbanised Scottish sea area. Although overall concentrations of Hg and Pb were at background in the Northern North Sea (<BAC) of the 16 stations assessed for status, 2 exceeded the ER-L for Pb and Hg. In the Minches and Western Scotland region no station exceeded the ER-Ls. There were insufficient sites for the regional assessment of status and trends of metals in sediment from Scottish Continental Shelf, however for the one site assessed Hg and Pb concentrations were at background (<BAC) and the Cd concentration was < ER-L.
For biota (fish and mussels) concentrations in all three regions were similar, with mean regional concentrations for all three metals being above the BAC but below the MPC. Only 4 of 14 sites in the Northern North Sea for Cd, and 1 out of 10 for Pb in the Irish Sea (Clyde and Solway) exceeded the MPC. However, if the EQS for Hg in biota was used in the status assessment (without any adjustment for trophic level) then mean regional concentrations would exceed the EQS in all 3 regions assessed, as the EQS is lower than the BAC.
Trends in heavy metal concentrations were assessed in biogeographic regions where there were at least five years of data (Figure 4). Three regions were assessed for trends in sediment and biota. All three regions gave significant negative % yearly changes for Hg in sediment, with means of -3.95% (Northern North Sea), -3.76% (Irish Sea (Clyde and Solway)) and -4.47% (Minches and Western Scotland). The decreasing trends for Hg are likely due to implementation of EU Best Available Techniques (BAT). Introduction of this BAT has seen a 73% drop in Hg emissions to air between 1990 and 2014 recorded and a 71% drop in Hg emissions to water recorded between 2007 and 2014. Mean percentage yearly changes for Pb in sediment were also negative in all 3 regions with % yearly changes of the -1.28%(Northern North Sea), -2.41% (Irish Sea (Clyde and Solway)) and –0.86% (Minches and Western Scotland), although there were no significant trends. Cd showed positive % yearly changes which was significant in the Minches and Western Scotland region.
For biota, mean regional % yearly changes ranged from -4.04% for Pb in Minches and Western Scotland to 3.05% for Cd in Minches and Western Scotland, however there were no significant trends.
Although a regional assessment of status was not undertaken for Scotland’s Marine Atlas (2011), the status of Hg, Cd and Pb concentrations in sediment sites was similar to this regional assessment with many sites being at background, and only in the industrialised areas of the Clyde and Forth were concentrations for Hg and Pb of concern (>ER-L). For the 2011 assessment, fish and mussels were assessed separately and concentrations for both were mainly below the EAC proxy, and in mussels frequently below the BAC, particularly for Cd. This regional assessment showed that heavy metal concentrations in biota (fish and mussels assessed together) were above BAC but below the MPC, the different conclusion from the 2011 assessment will be due to the differences in the assessment methodology.
Scottish Marine Regions
Eleven Scottish Marine Regions (SMRs) were created by The Scottish Marine Regions Order 2015 which cover sea areas extending out to 12 nm. Regional assessments to support Regional Marine Plans are required to be developed for each SMR by the relevant Marine Planning Partnership.
The CSEMP sampling design is based on the biogeographic regions used within UK and MSFD assessments and therefore there are insufficient data for a regional assessment for all SMRs. In particular, some SMRs have no or few (<3) monitoring stations. For sediment, four of the eleven SMRs might have sufficient data for a regional assessment; Clyde, Forth and Tay, Moray Firth and West Highland. For biota, eight of the eleven SMRs (all but Orkney, North Coast and North East) might have sufficient data for a regional assessment. Further work is needed to undertake an assessment at the SMR level.
However, each SMR is contained within a biogeographic region or, in some cases, straddles two biogeographic regions (Shetland and Outer Hebrides). Table c shows the SMR and the biogeographic region(s) they are in. Using the biogeographic regional assessment of heavy metals, concentrations in sediment and biota are likely to be above background but below the ER-L/MPC in all SMRs, apart for Hg and Pb in sediment from the Clyde, and Forth and Tay. Concentrations are also likely to be stable or decreasing in all SMRs. For Hg, 2 of 4 stations in the Forth and Tay, and 3 of 6 stations in the Clyde exceeded the ER-L, although one station in each was showing significant reductions. For Pb, all stations exceeded the ER-L in the Clyde and 2 of 4 in the Forth and Tay, with one station in the Clyde showing significant reductions.
Additional monitoring stations would be required to enable regional assessments in each SMR. This might be achievable for biota if the monitoring stations are increased. It is less likely to occur for sediment as it will be harder in some SMRs to find muddy areas suitable for contaminant monitoring. For example, much of the sediment in the Outer Hebrides, Orkney, North Coast and North East SMRs are sand, gravel or rock.
|
SMR
|
Biogeographic region
|
|
Argyll
|
Minches and Western Scotland
|
|
Clyde
|
Irish Sea (Clyde and Solway)
|
|
Forth and Tay
|
Northern North Sea
|
|
Moray Firth
|
Northern North Sea
|
|
North Coast
|
Scottish Continental Shelf
|
|
North East
|
Northern North Sea
|
|
Outer Hebrides
|
Scottish Continental Shelf
Minches and Western Scotland
|
|
Orkney Islands
|
Scottish Continental Shelf
|
|
Shetland Isles
|
Northern North Sea (east Shetland)
Scottish Continental Shelf (west Shetland)
|
|
Solway
|
Irish Sea (Clyde and Solway)
|
|
West Highlands
|
Minches and Western Scotland
|
Conclusion
Mean concentrations for all three metals in biota were above background concentrations but below the EC food safety level. The uncertainties in the assessment criteria used (MPC for contaminants in foodstuffs) means there is low confidence in concentrations in biota being acceptable. Further work is needed to develop suitable assessment criteria for metals in biota to improve understanding of the effects of the metals on the marine environment.
For sediments, concentrations were at background for all three metals in the Northern North Sea, for Cd and Hg in the Minches and Western Scotland and for Cd in the Irish Sea (Clyde and Solway). Pb and Hg concentrations were unacceptable in the Irish Sea (Clyde and Solway) (>ER-L). However, concentrations of Hg are decreasing in sediment in all three regions.
Metal concentrations need to be kept under surveillance, as concentrations exceeded the ER-L in some areas, and there is an increasing trend for Cd in sediment in Minches and Western Scotland. Besides anthropogenic sources, heavy metals can also come from natural sources and therefore they will always be found in the marine environment. However, better use of emission control technology in combustion processes could improve the situation further.
The assessment methodology has been developed and improved since Scotland’s Marine Atlas (2011). Therefore a direct comparison to the 2011 assessment was not possible. The assessment criteria used were the same but the regional assessment model was not used and concentrations at individual sites were compared directly to assessment criteria and there was no statistical assessment of trends undertaken for heavy metals.
The 2011 assessment showed that heavy metal concentrations in sediment were at background at most sites and concentrations were only unacceptable for Hg and Pb in a few sites, mainly in the Clyde and Forth, which is in agreement with this current regional assessment.
For the 2011 assessment, fish and mussels were assessed separately and concentrations were mainly below the EAC proxy and in mussels frequently below the BAC, particularly for Cd.
No attempt was made to combine individual heavy metal assessments to give an overall assessment of status and trends for biota. The regional assessment showed heavy metal concentrations in biota were above background but below the proxy EAC, the different conclusion from the 2011 assessment will be due to the differences in the assessment methodology.
The EQS for Hg in biota was not used in OSPAR or MSFD assessments and was not used in this assessment for the reasons outlined in the Assessment Method section. However, if used then concentrations are likely to exceed this concentration at all sites.
The CSEMP sampling design was based around the biogeographic regions used in OSPAR and MSFD assessments, therefore there are insufficient data for status and trend assessments of all SMRs. Each SMR will be within a biogeographic region. In some SMRs there will be no or few stations, particularly for sediment, and regional assessments will not be possible without additional sampling.
Knowledge gaps
There are a lack of monitoring data, particularly for sediment in the Scottish Continental Shelf. This is partly due to difficulties sampling in this area and the sediment type which is mainly sandy or rock and therefore not suitable for contaminant monitoring.
There are no OSPAR EACs available for heavy metals in biota, therefore the European Commission Food Limit was used as an EAC-proxy. There is no clear evidence to link these limits to environmental harm in sea life. The confidence in assessment for trace metals in biota is low. There is a need to develop EACs for metals in biota.
There were insufficient data for the assessment of all SMRs. Since Scotland’s Marine Atlas (2011) and OSPAR Quality Status Report (OSPAR, 2010) the focus for annual CSEMP contaminant monitoring has been to establish sufficient coverage to make regional assessments at the biogeographic scale for OSPAR and MSFD assessments.
Additional sampling and analysis would be required if regional assessments were to be made for all SMRs. However the sediment type may not be suitable for contaminant analysis in all SMRs. In addition, shellfish sampling in all SMRs might not be possible, due to the lack of mussels in some areas. It may be possible to use heavy metal data for scallops to improve the spatial coverage for regional assessments, MSS is currently investigating this.
Status and trend assessment
This status and trend assessment is an overall assessment for Contaminants in sediment and biota (PAHs, PCBs, PBDEs and metals in sediment and biota) and Biological effects of contaminants.
|
Region assessed
|
Status with confidence
|
Trend with confidence
|
Comments
|
|---|---|---|---|
|
Irish Sea (Clyde and Solway)
|
 |
|
Green square with red triangle for status indicates few or no concerns as a whole, but many local concerns, particularly in the Clyde, with some sites exceeding the EAC/EAC-proxy. Two stars for confidence in the status is due to lack of suitable assessment criteria for some determinands (metals in biota and some biological effects measurements)
|
|
Minches and Western Scotland
|
 |
|
Two stars for confidence in the status is due to lack of suitable assessment criteria for some determinands (metals in biota and some biological effects measurements). In addition there is limited fish sites which impacts on the ability to make biological effects assessments.
|
|
Northern North Sea
|
|
|
Two stars for confidence in the status is due to lack of suitable assessment criteria for some determinands (metals in biota and some biological effects measurements)
|
|
Scottish Continental Shelf
|
|
|
One star for confidence in the status is due to lack of suitable assessment criteria for some determinands (metals in biota and some biological effects measurements). In addition this region could not be assessed for all determinand/matrix combinations due to the lack of sites
|
This Legend block contains the key for the status and trend assessment, the confidence assessment and the assessment regions (SMRs and OMRs or other regions used). More information on the various regions used in SMA2020 is available on the Assessment processes and methods page.
Status and trend assessment
|
Status assessment
(for Clean and safe, Healthy and biologically diverse assessments)
|
Trend assessment
(for Clean and safe, Healthy and biologically diverse and Productive assessments)
|
||
|---|---|---|---|
 |
Many concerns |
No / little change |
|
 |
Some concerns |
Increasing |
|
| |
Few or no concerns |
Decreasing |
|
 |
Few or no concerns, but some local concerns |
No trend discernible |
|
| |
Few or no concerns, but many local concerns |
All trends | |
 |
Some concerns, but many local concerns |
||
 |
Lack of evidence / robust assessment criteria |
||
| Lack of regional evidence / robust assessment criteria, but no or few concerns for some local areas | |||
 |
Lack of regional evidence / robust assessment criteria, but some concerns for some local areas | ||
| Lack of regional evidence / robust assessment criteria, but many concerns for some local areas | |||
Confidence assessment
|
Symbol |
Confidence rating |
|---|---|
|
Low |
|
|
Medium |
|
|
High |

Assessment regions
 and the Scottish Offshore Marine Regions (OMRs, O1 – O10)")
Key: S1, Forth and Tay; S2, North East; S3, Moray Firth; S4 Orkney Islands, S5, Shetland Isles; S6, North Coast; S7, West Highlands; S8, Outer Hebrides; S9, Argyll; S10, Clyde; S11, Solway; O1, Long Forties, O2, Fladen and Moray Firth Offshore; O3, East Shetland Shelf; O4, North and West Shetland Shelf; O5, Faroe-Shetland Channel; O6, North Scotland Shelf; O7, Hebrides Shelf; O8, Bailey; O9, Rockall; O10, Hatton.
 Regions. These have been used as the assessment areas for hazardous substances.")
, Regions.")