

Background
Polycyclic aromatic hydrocarbons (PAHs) are natural components of coal and oil, and are also formed during the combustion of fossil fuels and organic material. PAHs occur as a result of natural processes such as forest fires. PAHs enter the marine environment through atmospheric deposition, road run-off, industrial discharges and as a result of oil spills.
PAHs often end up in marine sediment, where they may be trapped in lower layers unless the sediments are disturbed. PAHs can also accumulate in shellfish, because they are taken in either directly from the marine environment or indirectly through food consumption. In contrast, fish metabolise PAHs and therefore concentrations in fish are lower. Although this is the case, exposure to PAHs can be screened for by the measurement of PAH bile metabolites in the gall bladders of fish. The problems caused by PAHs in the marine environment vary considerably from tainting the taste of fish and shellfish to being potentially carcinogenic to humans and animals.
Due to their persistence, potential to accumulate and toxicity, analysis of PAHs in sediment and shellfish is required for the OSPAR Coordinated Environmental Monitoring Programme (CEMP), the Water Framework Directive (WFD) and the Marine Strategy Framework Directive (MSFD). To fulfil these monitoring and assessment commitments, analysis of PAHs are undertaken as part of the UK Clean Seas Environment Monitoring Programme (CSEMP) for 4 biogeographic regions (Figure 2): Irish Sea (Clyde and Solway), Minches and Western Scotland, Scottish Continental Shelf and Northern North Sea. See Introduction to SMA2020 for more about the areas used.
Contaminants and effects monitoring is undertaken in Scottish coastal and offshore areas as part of the UK Clean Seas Environment Monitoring Programme (CSEMP). CSEMP is operated to ensure a coordinated monitoring programme across the United Kingdom. CSEMP contaminant and biological effects data are submitted to the UK Marine Environment Monitoring and Assessment National database (MERMAN) and from there to the International Council for the Exploration of the Sea (ICES) Environmental database.
The main focus of the CSEMP to date has been to meet the temporal trend monitoring requirements of the OSPAR Convention and of compliance with EC Directives such as the WFD and the MSFD (Directive 2008/56/EC). The UK monitors substances detailed in the OSPAR Coordinated Environmental Monitoring Programme (CEMP) in sediment, fish and shellfish. The CEMP includes the monitoring of polycyclic aromatic hydrocarbons (9 parent PAHs), polychlorinated biphenyls (ICES7 PCBs), polybrominated diphenyl ethers (9 PBDE congeners) and heavy metals (Hg, Cd and Pb) in sediment and shellfish and tributyltin (TBT) in sediment. A range of biological effects in flatfish (mainly dab, but including flounder and plaice) are also monitored as part of CSEMP, including 1-hydroxy pyrene equivalent (PYR1OHEQ) concentrations in bile, which informs on recent exposure to PAHs in fish.
The OSPAR Strategy for Hazardous Substances has a strategic objective which is to ‘Move towards the cessation of discharges, emissions and losses of hazardous substances by 2020 with the ultimate aim of achieving concentrations in the marine environment of near background for naturally occurring substances and close to zero for man-made substances’. Descriptor 8 (contaminants and their effects) is one of the eleven MSFD qualitative descriptors for determining Good Environmental Status (GES). To monitor compliance with GES for Descriptor 8, common indicators for contaminants and biological effects should be measured in environmental samples and compared to assessment criteria.
PAHs are hydrocarbons composed of two or more fused aromatic rings, encompassing both parent (non-alkylated) compounds and alkylated (branched) homologues. Although PAHs can be produced through natural processes, they also arise from anthropogenic sources. Incomplete combustion processes are a major source of PAHs, but they can also be of petrogenic origin (crude oils or refinery products). PAHs of petrogenic origin include mainly alkylated, 2-ring and 3-ring PAHs formed as a result of diagenetic processes, whereas PAHs from pyrolytic sources comprise mainly of the heavier, parent (non-alkylated) PAHs. Assessment of the PAH profile, including PAH ratios such as the phenanthrene/anthracene ratio or the fluoranthenene/pyrene ratio can give an indication of the source of PAHs.
PAHs are of concern due to their persistence, potential to bioaccumulate and toxicity, and are therefore included on the OSPAR List of Chemicals for Priority Action. PAH properties will vary considerably depending on the number of rings. Low molecular weight PAHs can cause tainting of fish and shellfish and render them unfit for sale (Davis, Moffat & Shepherd, 2002); secondly, metabolites of some of the high molecular PAHs, such as benzo[a]pyrene, are potent animal and human carcinogens. Less is known about the toxicity of alkylated PAHs, although one study has demonstrated that alkylated PAHs may have increased toxicity compared to the parent compound (Marvanova et al., 2008).
PAHs can enter the marine environment through atmospheric deposition, run-off, industrial discharges and as a result of oil spills. Sediment will act as a sink for PAHs in the marine environment. There are marked differences in the behaviour of PAHs in the marine environment between the low molecular weight compounds (e.g. naphthalene) and the high molecular weight compounds (e.g. benzo[ghi]perylene) as a consequence of their differing physico-chemical properties. The low molecular weight compounds are water soluble and can be bioaccumulated from the dissolved phase by transfer across the gill surfaces of aquatic organisms; whereas the high molecular weight compounds are relatively insoluble and hydrophobic, and can attach to both organic and inorganic particulates within the water column (Baumard et al., 1999). Although fish uptake PAHs they do not generally accumulate high concentrations as they possess an effective mixed-function oxygenase (MFO) system which allows them to metabolise PAHs and to excrete them in bile (Stagg, McIntosh, & Mackie, 1995; Richardson, Davies, Moffat, Pollard, & Stagg, 2001). Therefore, the measurement of PAH bile metabolites (PYR1OHEQ) in fish can inform on recent exposure to PAHs in fish. Other marine vertebrate and marine mammals also metabolise PAHs efficiently.
Emissions of PAHs are controlled via a number of different regulations. These are (i) Industrial Emissions Directive (EC 76/2010) which limits releases from industrial processes; (ii) REACH registration process (EC 1906/2007) which states conditions for the safe use of substances including PAHs; and (iii) Persistent Organic Pollutants regulation (EC 850/2004) which requires PAH emissions to be captured in an inventory and an action plan to limit releases.
PAH monitoring in sediment and shellfish is undertaken in Scottish coastal (SEPA and Marine Scotland Science (MSS)) and offshore areas (MSS) as part of the CSEMP. In addition MSS measure PYR1OHEQ in fish. SEPA and MSS PAH data in sediment and shellfish, and PYR1OHEQ data in fish are submitted to MERMAN and have been used in this assessment.
The 2019 assessment of CSEMP data (1999 – 2018) describes the trends and status of contaminant concentrations at sediment and shellfish monitoring stations in the four Scottish biogeographic regions. Assessments are made for many time series, each of a single contaminant at a single monitoring station. This section describes how the results of the individual time series are synthesised to assess status and trends at the biogeographic regional level (Table a). Nine PAH compounds and the PAH metabolite 1-hydroxypyrene, for which assessment criteria were available, were assessed for status and trends (Table b).
Assessment scales
Status and trends assessments were conducted for the 4 biogeographic regions. Figure 1a-c (Results Section) shows all the monitoring stations where there are suitable data for shellfish, sediment and fish, with the magenta dots showing stations used for status and trend assessments and cyan dots showing stations where there is only status information. The areas delineated by the grey lines are the biogeographic regions. The number of stations in each biogeographic region is given in Table a.
|
Scottish Biogeographic Region
|
Sediment
|
Shellfish
|
Fish
|
|||
|
Trends
|
Status
|
Trends
|
Status
|
Trends
|
Status*
|
|
|
Irish Sea (Clyde and Solway)
|
10
|
11
|
9
|
9
|
5
|
3
|
|
Minches and Western Scotland
|
6
|
6
|
5
|
5
|
2
|
1
|
|
Scottish Continental Shelf
|
1
|
1
|
5
|
5
|
0
|
0
|
|
Northern North Sea
|
17
|
17
|
18
|
19
|
6
|
7
|
* assessment criteria are not available for all species sampled
Assessment of concentrations of PAHs in sediment and biota (shellfish and fish)
PAH compounds are monitored in sediment and shellfish and PAH metabolites in fish as part of the CSEMP. Sampling and chemical analysis methodologies met the relevant OSPAR requirements (OSPAR, 2008). Statistical assessments of status and trends were also based on OSPAR methodologies using the assessment criteria shown in Table b (OSPAR, 2009).
There are agreed OSPAR Environmental Assessment Criteria (EACs) for PAHs in biota, but not for sediment. Therefore the Effects Range Low (ER-L) values that were developed by the US National Oceanic and Atmospheric Administration are used to assess if adverse effects are likely to occur in marine life due to PAH concentrations in sediment (Long, Macdonald, Smith & Calder, 1995).
The WFD introduced Environmental Quality Standards (EQS) for some contaminants in biota, including PAHs. However as EACs are available for shellfish, and given that these have been used in OSPAR and MSFD assessments, the same criteria were used for this assessment.
|
|
Abbreviation
|
Sediment
|
Shellfish
|
Fish
|
|||
|
BAC
(μg kg-1 dw)
|
ER-L
(μg kg-1 dw)
|
BAC
(μg kg-1 dw)
|
EAC
(μg kg-1 dw)
|
BAC
(ng ml-1)
|
EAC
(ng ml-1)
|
||
|
Phenanthrene
|
PA
|
32
|
240
|
11.0
|
1700
|
-
|
-
|
|
Anthracene
|
ANT
|
5
|
85
|
-
|
290
|
-
|
-
|
|
Fluoranthene
|
FLU
|
39
|
600
|
12.2
|
110
|
-
|
-
|
|
Pyrene
|
PYR
|
24
|
665
|
9.0
|
100
|
-
|
-
|
|
Benz[a]anthracene
|
BAA
|
16
|
261
|
2.5
|
80
|
-
|
-
|
|
Chrysene/Triphenylene
|
CHR
|
20
|
384
|
8.1
|
-
|
-
|
-
|
|
Benzo[a]pyrene
|
BAP
|
30
|
430
|
1.4
|
600
|
-
|
-
|
|
Benzo[ghi]perylene
|
BGHIP
|
80
|
-
|
2.5
|
110
|
-
|
-
|
|
Indeno[123-cd]pyrene
|
ICDP
|
103
|
-
|
2.4
|
-
|
-
|
-
|
|
1-hydroxypyrene equivalent (in fish)
|
PYR1OHEQ
|
-
|
-
|
-
|
-
|
150
|
22,000
|
-
BACs in sediment are normalised to 2.5% organic carbon.
-
BACs and EACs for PYR1OHEQ are not available for all species.
-
there is at least one year with data in the period 2013 to 2018.
-
there are at least three years of data over the whole-time series.
-
a parametric model can be fitted to the data and used to estimate the mean concentration in the final monitoring year (or, occasionally, if a non-parametric test of status is applied).
-
there are at least five years of data over the whole-time series.
-
a parametric model can be fitted to the data and used to estimate the trend in mean concentrations.
Information on how the individual time series are assessed for status and trends can be found here https://www.bodc.ac.uk/projects/data_management/uk/merman/assessments_and_data_access/csemp/
For the regional assessment, the results from the individual time series are combined. Essentially, a summary measure of status or trend is obtained from each time series. These are then modelled, using a linear mixed model, to estimate the mean status, or the mean trend in each biogeographic region. Only biogeographic regions with at least three monitoring stations with good geographic spread are considered in the regional assessment.
The trend analysis is further restricted to time series from monitoring stations that are classified as ‘representative’. ‘Baseline’ stations (those with near pristine conditions or only subject to very diffuse inputs) are omitted because any trends there will likely be caused by different processes to those at representative stations. Similarly, ‘impacted’ stations (those close to a point source) are omitted because trends there will likely reflect changes due to the point source, and will be ‘unrepresentative’ at the regional level. There are no restrictions on the time series used in the status analysis based on the classification of the monitoring station; time series from baseline, representative and impacted stations are all included.
Results
PAH concentrations are measured in sediment and shellfish samples and bile metabolites in fish, taken between 1999 and 2018 from four biogeographic regions (Figure 1), in cycles varying from annually to every six years. Only biogeographic regions with at least three stations with a reasonable geographic spread were included in the regional assessment of status and trends. Shellfish (blue mussel) were collected in coastal and estuarine areas only whilst sediment and fish were collected from coastal and more offshore areas.
PAH concentrations in sediment and shellfish and the PAH metabolite in fish, were compared to the OSPAR Background Assessment Concentration (BAC). BACs are used to assess whether concentrations are near background values for naturally occurring substances, such as PAHs. In addition, PAH concentrations in shellfish (and PAH metabolite for fish) were compared to Environmental Assessment Criteria (EAC) and concentrations in sediment compared to the United States Environmental Protection Agency’s Effects Range-Low (ER-L). Adverse effects on marine organisms are rarely observed when concentrations are below the EAC or ER-L value.
There were insufficient sites for the regional assessment of status and trends of PAHs in sediment and biota from Scottish Continental Shelf and for bile metabolites in the Scottish Continental Shelf, Irish Sea (Clyde and Solway) (only status assessment possible) and Minches and Western Scotland. Concentrations in sediment and shellfish were lowest in the Minches and Western Scotland region, although still above background for shellfish. Highest PAH concentrations in sediment and shellfish were in the Irish Sea (Clyde and Solway), which includes the Clyde, the most industrialised and urbanised Scottish sea area. Concentrations for all PAHs were above the BACs but below the ER-L or EACs (Figure 2). Bile metabolites were assessed in the Northern North Sea and Irish Sea (Clyde and Solway). Mean regional concentrations were highest in the Irish Sea (Clyde and Solway) but both regions were above the BACs but below the EACs. Therefore adverse biological effects in marine species are unlikely. However, there are still single sites where the EAC/ER-L is breached. For example, 9 out of 28 sediment sites and 9 out of 28 shellfish sites in the Irish Sea (Clyde and Solway) and Northern North Sea still report concentrations of at least one PAH compound that are not acceptable (> EAC/ER-L).
Trends in PAH concentrations were assessed in biogeographic regions where there were at least five years of data (Figure 3). Three regions were assessed for trends in shellfish and sediment and one for fish. Across all PAHs, concentrations in sediment, shellfish and fish were stable except for shellfish in the Northern North Sea, where there was a significant downward trend. However, yearly changes in sediment in the Northern North Sea and Minches and Western Scotland region were positive with mean %-yearly changes of 0.93% and 2.62%, respectively, whilst in the Irish Sea (Clyde and Solway) there was a mean %-yearly change of -0.74%. Positive yearly changes were also observed in shellfish in the Minches and Western Scotland (1.07%) and for fish in the Northern North Sea (7.86%).
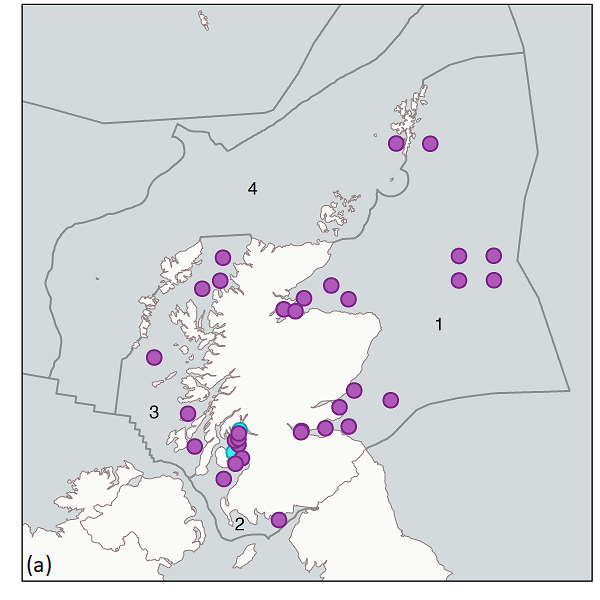
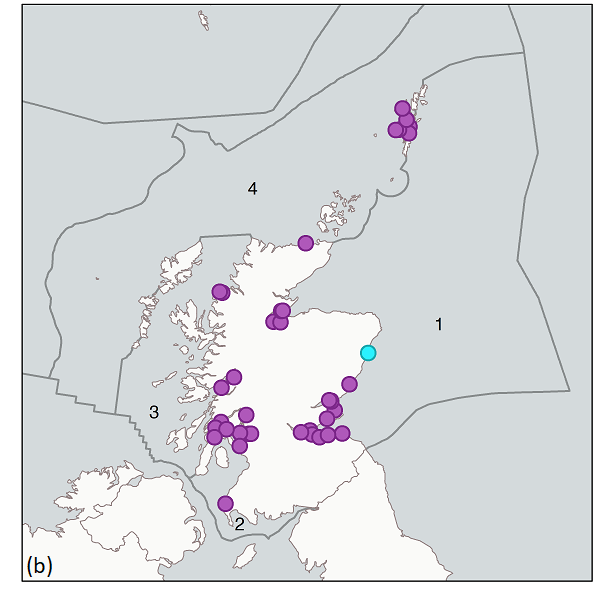
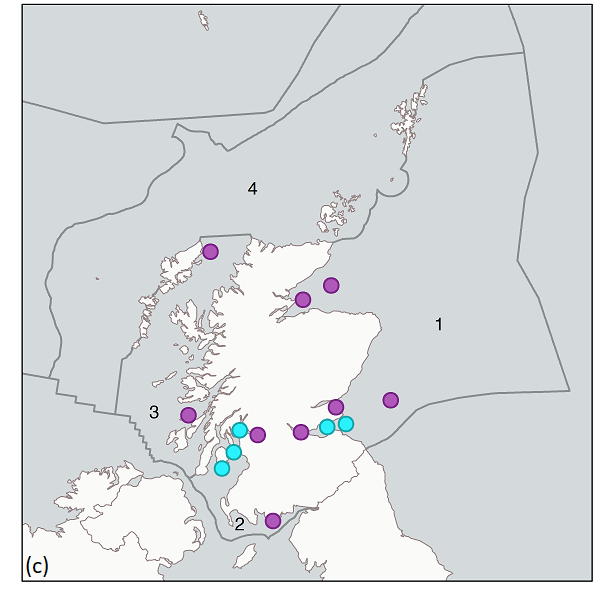
Figure 1: Monitoring stations used to assess PAH/ PYR1OHEQ concentrations in (a) sediment, (b) shellfish and (c) fish per biogeographic region (grey lines). Magenta dots = stations used for status and trend assessments. Cyan dots = stations used for status assessment only. 1, Northern North Sea; 2, Irish Sea (Clyde and Solway); 3, Minches and Western Scotland; 4, Scottish Continental Shelf.
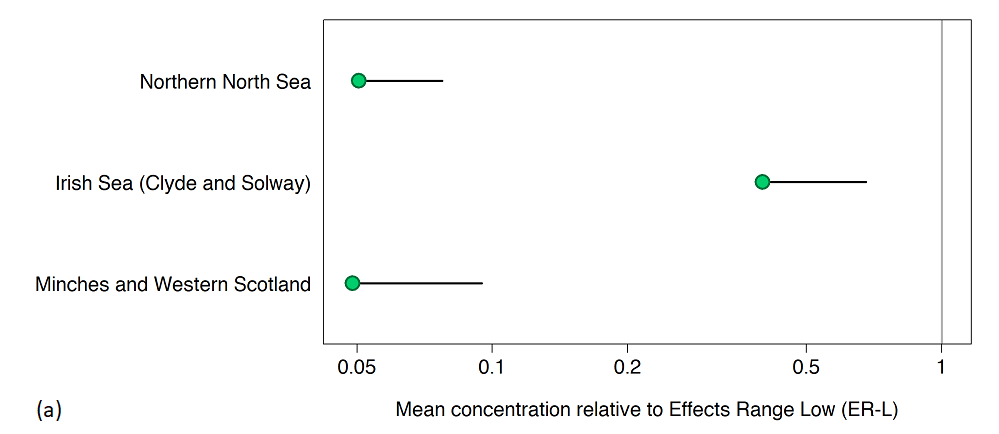
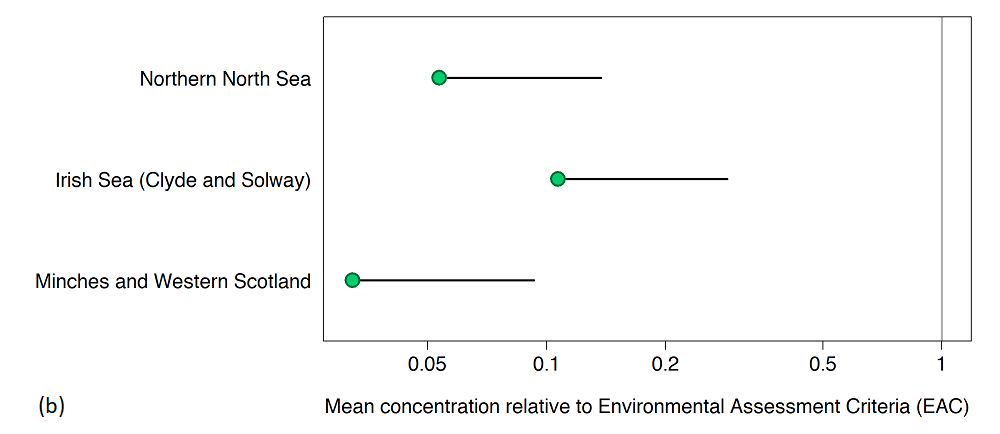
Figure 2: Status assessment; mean PAH concentration in (a) sediment and (b) shellfish in each Scottish biogeographic region relative to the ER-L for sediment and EAC for shellfish (with 95 % confidence limits), where the EAC/ER-L value is 1. Concentrations are significantly below the EAC/ER-L if the upper confidence limit is below 1. Blue = statistically significantly below the BAC. Green = at or above the BAC but statistically significantly below the EAC, ER-L.
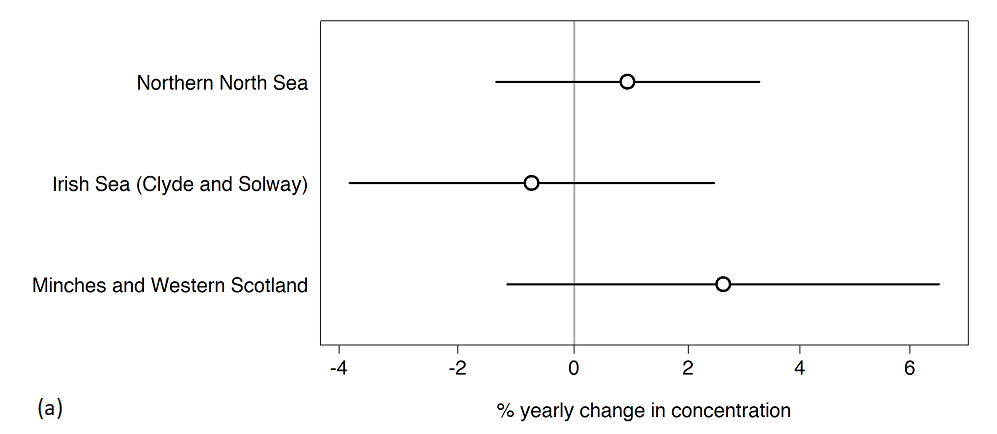
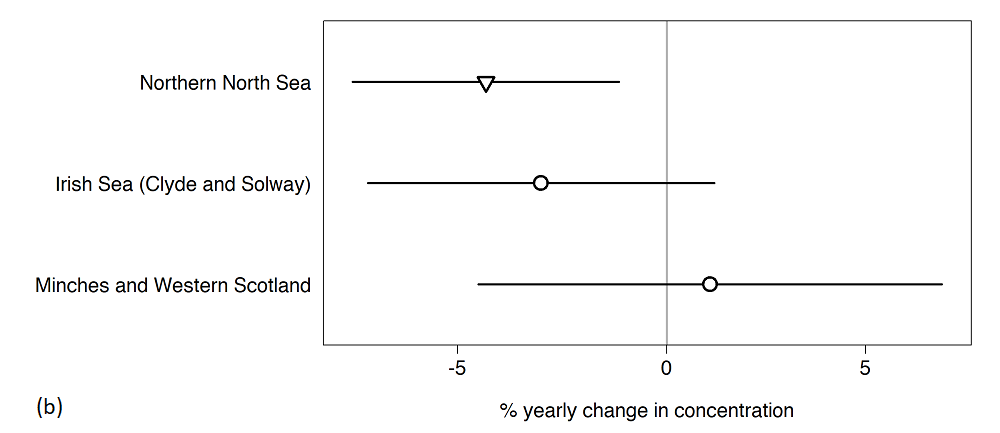
Figure 3: Trend assessment; percentage yearly change in PAH concentrations in each Scottish biogeographic region for (a) sediment and (b) shellfish. There is a significant trend if the confidence limits does not cut the vertical line at 0. Upward trends (upwards triangle), downward trends (downwards triangle), no change (circle) and 95 % confidence limits (lines).
MSS and SEPA PAH data were used in the assessment, with laboratories complying with ISO 17025, being UKAS accredited (for most determinands) and participating in the QUASIMEME proficiency testing scheme. Therefore, there is high confidence in the quality of the data used in this assessment. The data have been collected over many years using established sampling methodologies. In addition, established and internationally recognised protocols for monitoring and assessment are used, therefore there is also high confidence in the methods. The assessment methodology has been developed and improved since the assessment for Scotland’s Marine Atlas (Baxter et al, 2011), with a regional assessment being undertaken and presented here rather than the individual station assessment presented in the 2011 Atlas.
The number of stations assessed for status and trends in each of the 4 biogeographic regions are shown in Table a. Mean individual PAH concentrations (normalised to organic carbon for sediment) relative to the ER-L and EAC for each biogeographic region are shown in Figure a. The mean regional PAH concentration relative to the BAC is shown in Figure b.
The mean regional concentration for phenanthrene was at background (below BAC) in sediment from the Northern North Sea. Mean regional concentrations for individual PAHs were significantly below the ER-L (sediment) or EAC (shellfish) in all regions, except for phenanthrene in sediment from the Irish Sea (Clyde and Solway). Only in the Northern North Sea and Irish Sea (Clyde and Solway) were there sufficient PYR1OHEQ data for a status assessment. Mean regional concentrations were below the EAC, furthermore all stations gave concentrations below the EAC. Therefore, overall adverse biological effects in marine species are unlikely in the assessed areas.
Although a regional assessment of status was not undertaken for Scotland’s Marine Atlas (2011), the status of PAH concentrations in sediment and biota were similar to this assessment with most sites having concentrations below the EAC/ER-L, with a few also below the BAC. In 2011, only in industrialised areas such as the Clyde and Forth, were concentrations of concern (> EAC/ER-L).
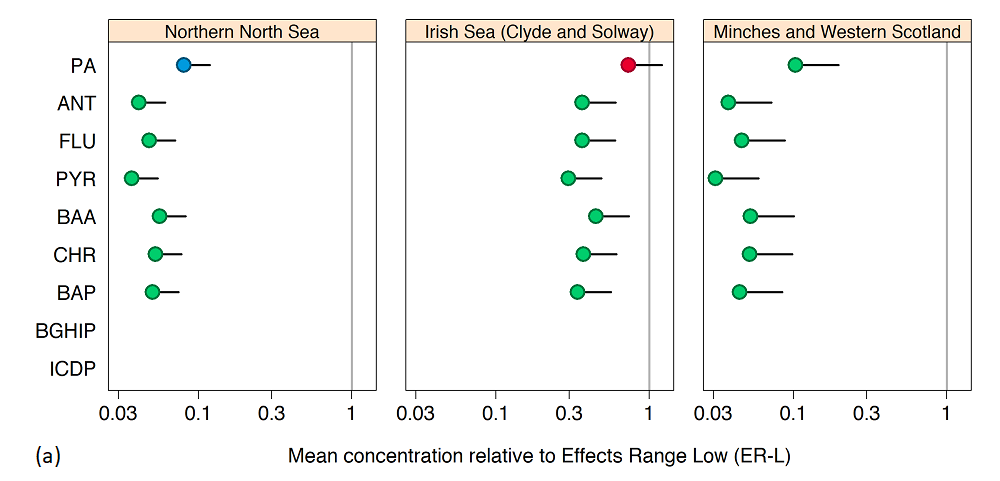
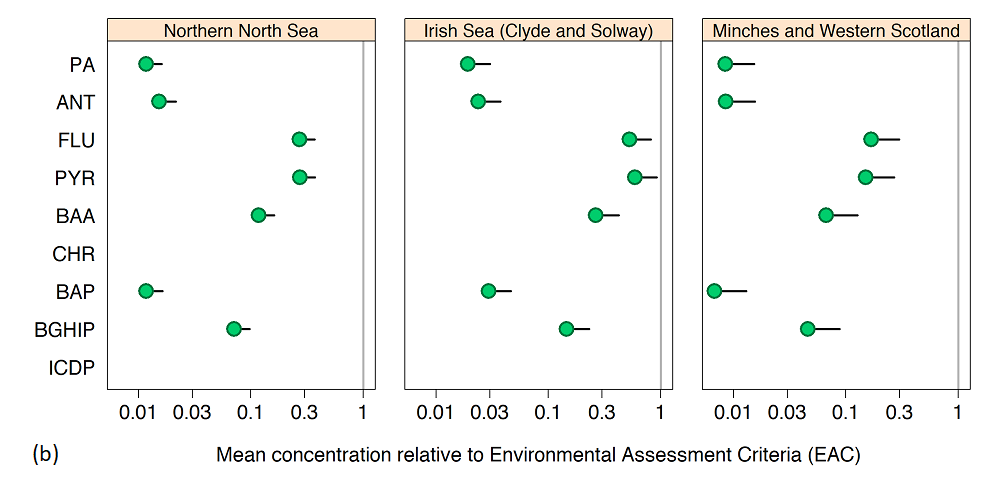
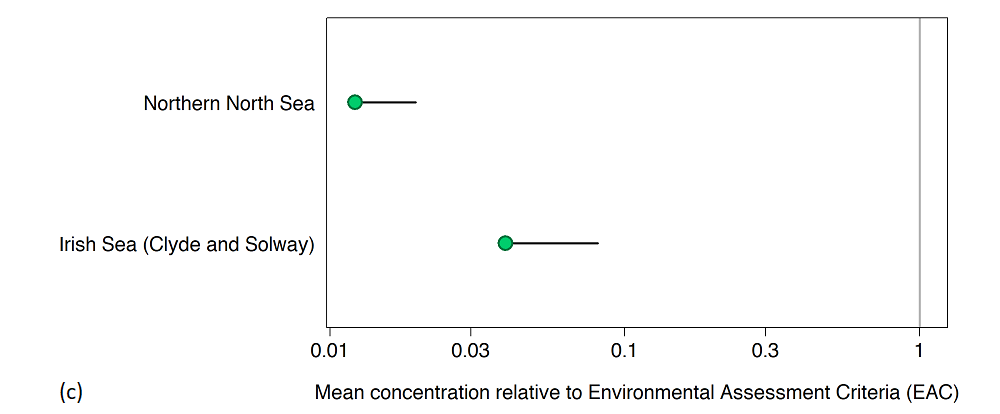
Figure a: Status assessment; mean PAH concentration in (a) sediment, (b) shellfish and PYR1OHEQ concentration in (c) fish in each Scottish biogeographic regions, relative to the EAC/ER-L (with 95% confidence limits) where the EAC/ER-L value is 1. Concentrations are significantly below the EAC/ER-L if the upper confidence limit is below 1. Blue = statistically significantly below the BAC. Green = at or above the BAC but statistically significantly below the EAC, ER-L. Red = statistically significantly above the EAC, ER-L. ICDP = indeno[123-cd]pyrene, BGHIP = benzo[ghi]perylene, BAP = benzo[a]pyrene, CHR = chrysene (including triphenylene), BAA = benz[a]anthracene, PYR = pyrene, FLU = fluoranthene, ANT = anthracene, PA = phenanthrene.
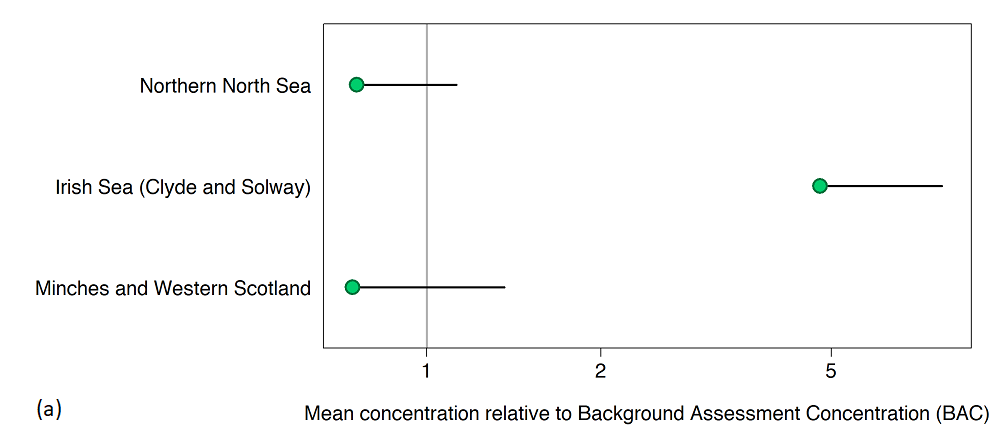
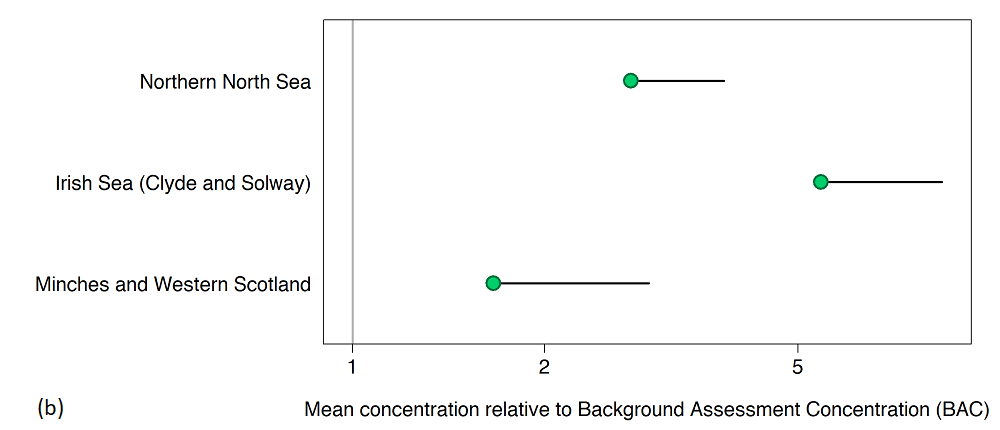
Figure b: Status assessment; mean PAH concentration in (a) sediment and (b) shellfish in each Scottish biogeographic region, relative to the BAC (with 95% confidence limits), where the BAC is 1. Concentrations are significantly below the BAC if the upper confidence limit is below 1. Blue = statistically significantly below the BAC. Green = at or above the BAC but statistically significantly below the EAC, ER-L.
Trends in PAH concentrations were also assessed in regions where there were at least five years of data. The %-yearly change for individual PAH compounds in each Scottish biogeographic region is shown in Figure c.
For sediment there were no significant trend for any PAH in any of the three regions assessed (Figure c(a)). Mean percentage yearly changes were positive for all PAHs in the Northern North Sea (0.93%) and Minches and Western Scotland (2.62%) regions, whilst the annual %-yearly change in the Irish Sea (Clyde and Solway) was -0.74%, although these were not significant. This was in contrast to the shellfish data, where a number of PAHs gave negative yearly changes, with significant downwards trends for a number of PAHs in the Northern North Sea and Irish Sea (Clyde and Solway). Across all PAHs the largest decrease in PAH concentrations in shellfish was observed in the Northern North Sea with a significant annual decrease of 4.34%. It should be noted that shellfish and sediment sampling cover different areas, with shellfish sites being coastal and estuarine, and sediment samples being collected in coastal and offshore areas. Trends for fish metabolites were assessed in the Northern North Sea, although there was no significant trend, the regional yearly change was positive (7.86%).
Scotland’s Marine Atlas (2011) did not present any information on the trends of PAHs in sediment and biota either by individual site or by Scottish Sea Areas. The overall conclusion for trends of hazardous substances in the 2011 Atlas was that concentrations in water, sediment and mussels were decreasing, but remained high in industrialised areas such as the Clyde and Forth.
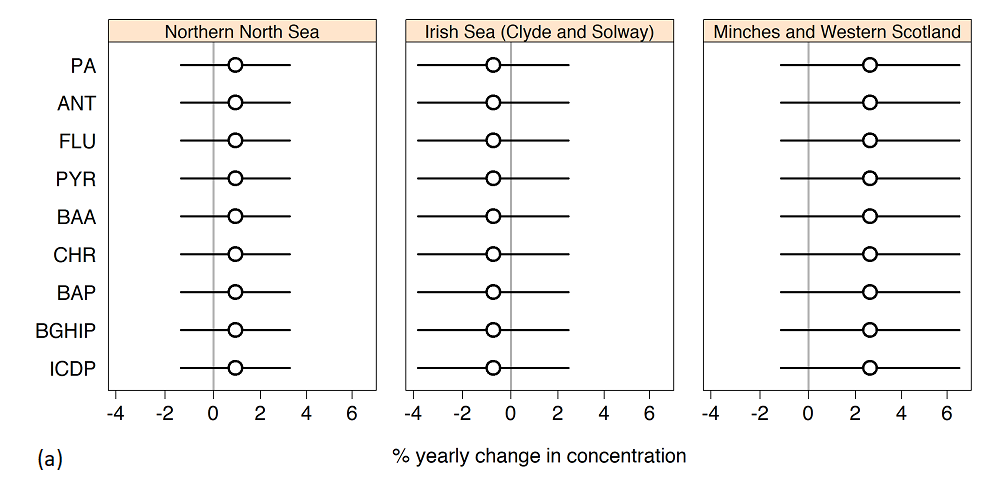
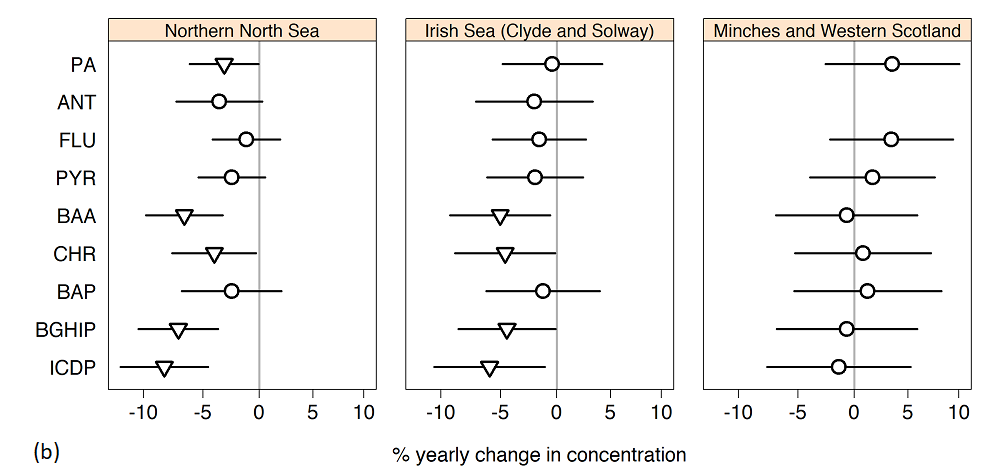
Figure c: Trend assessment; mean annual trends in PAH concentrations in (a) sediment and (b) shellfish by biogeographic region and compound. There is a significant trend if the confidence limits does not cut the vertical line at 0. Upward trends (upwards triangle), downward trends (downwards triangle), no change (circle) and 95% confidence limits (lines). ICDP = indeno[123-cd]pyrene, BGHIP = benzo[ghi]perylene, PYR = pyrene, BAA = benz[a]anthracene, BAP = benzo[a]pyrene, PA = phenanthrene, ANT = anthracene, CHR = chrysene (including triphenylene) and FLU = fluoranthene.
Scottish Marine Regions
Eleven Scottish Marine Regions (SMRs) were created by The Scottish Marine Regions Order 2015 which cover sea areas extending out to 12 nm. Regional assessments to support Regional Marine Plans are required to be developed for each SMR by the relevant Marine Planning Partnership.
The CSEMP sampling design is based on the biogeographic regions used within UK and MSFD assessments and therefore there are insufficient data for a regional assessment for all SMRs. In particular, some SMRs have no or few (<3) monitoring stations. For sediment, four of the eleven SMRs might have sufficient data for a regional assessment; Clyde, Forth and Tay, Moray Firth and West Highland. For biota, eight of the eleven SMRs (all but Orkney, North Coast and North East) might have sufficient data for a regional assessment. Further work is needed to undertake an assessment at the SMR level.
However, each SMR is contained within a biogeographic region or, in some cases, straddles two biogeographic regions (Shetland and Outer Hebrides). Table c shows the SMR and the biogeographic region(s) they are in. Using the biogeographic assessment of PAHs, it is likely that PAH concentrations in shellfish and sediment will be above background but below the EAC/ER-L. Concentrations are also likely to be stable in all SMRs. SMRs are more coastal than the biogeographic regions and therefore regional concentrations may be higher at this smaller scale but should still be below the EAC/ER-L. For example, available stations in the Forth and Tay SMR are above BACs for all PAHs assessed, with 2 PAH compounds (phenanthrene and anthracene) at one station also exceeding the ER-L.
Additional monitoring stations would be required to enable regional assessments in each SMR. This might be achievable for biota if the monitoring stations are increased. It is less likely to occur for sediment as it will be harder in some SMRs to find muddy areas suitable for contaminant monitoring. For example, much of the sediment in the Outer Hebrides, Orkney, North Coast and North East SMRs are sand, gravel or rock.
|
SMR
|
Biogeographic region
|
|
Argyll
|
Minches and Western Scotland
|
|
Clyde
|
Irish Sea (Clyde and Solway)
|
|
Forth and Tay
|
Northern North Sea
|
|
Moray Firth
|
Northern North Sea
|
|
North Coast
|
Scottish Continental Shelf
|
|
North East
|
Northern North Sea
|
|
Outer Hebrides
|
Scottish Continental Shelf
Minches and Western Scotland
|
|
Orkney Islands
|
Scottish Continental Shelf
|
|
Shetland Isles
|
Northern North Sea (east Shetland)
Scottish Continental Shelf (west Shetland)
|
|
Solway
|
Irish Sea (Clyde and Solway)
|
|
West Highlands
|
Minches and Western Scotland
|
Conclusion
Mean PAH concentrations in sediment and shellfish and bile metabolites in fish were above background concentrations in the assessed Scottish biogeographic regions. Mean PAH concentrations were below the ER-L or EAC in all regions and therefore are unlikely to cause adverse effects in marine organisms. In addition, across all PAHs the concentrations were stable except for biota from the Northern North Sea where there was a significant downward trend.
Although concentrations were stable, PAH concentrations need to be kept under surveillance, as concentrations for a small number of PAHs in sediment and shellfish were increasing in all areas, and some PAH compounds exceeded the EACs/ER-Ls. Even though there are natural sources of PAHs, the results from this assessment show that many are above BACs. Therefore regulation is still needed to limit losses from emissions from combustion processes.
The assessment methodology has been developed and improved since Scotland’s Marine Atlas (2011). Therefore a direct comparison to the 2011 assessment was not possible. The assessment criteria used were the same but the regional assessment model was not used and concentrations at individual sites were compared directly to assessment criteria and there was no statistical assessment of trends undertaken for PAHs.
The 2011 assessment also showed that PAH concentrations at most sites were above the BAC but below the EAC/ER-L. Only the status assessment for pyrene was presented in the 2011 assessment and no attempt was made to combine individual PAH assessments to give an overall PAH assessment of status and trends.
The CSEMP sampling design was based around the biogeographic regions used in OSPAR and MSFD assessments, therefore there are insufficient data for status and trend assessments of all SMRs. Each SMR will be within a biogeographic region. In some SMRs there will be no or few stations, particularly for sediment, and regional assessments will not be possible without additional sampling.
Knowledge gaps
There were a lack of monitoring data, particularly for sediment in the Scottish Continental Shelf. This is partly due to difficulties sampling in this area and the sediment type which is mainly sandy or rock and therefore not suitable for contaminant monitoring.
The ER-L was used in the assessment of PAHs in sediment, as there are no OSPAR EACs currently available. There is a need for EACs to be developed for both alkylated and parent PAH in sediment. More research may be needed to identify the specific sources of PAHs that are resulting in concentrations being above BAC and not decreasing in sediment in some areas.
There were insufficient data for the assessment of all SMRs. Since Scotland’s Marine Atlas (2011) and OSPAR Quality Status Report (OSPAR, 2010) the focus for annual CSEMP contaminant monitoring has been to establish sufficient coverage to make regional assessments at the biogeographic scale for OSPAR and MSFD assessments.
Additional sampling and analysis would be required if regional assessments were to be made for all SMRs. However the sediment type may not be suitable for contaminant analysis in all SMRs. In addition, shellfish sampling in all SMRs might not be possible, due to the lack of mussels in some areas. It may be possible to use PAH data for scallops to improve the spatial coverage for regional assessments; MSS is currently investigating this.
Status and trend assessment
This status and trend assessment is an overall assessment for Contaminants in sediment and biota (PAHs, PCBs, PBDEs and metals in sediment and biota) and Biological effects of contaminants.
|
Region assessed
|
Status with confidence
|
Trend with confidence
|
Comments
|
|---|---|---|---|
|
Irish Sea
|
 |
|
Green square with red triangle for status indicates few or no concerns as a whole, but many local concerns, particularly in the Clyde, with some sites exceeding the EAC/EAC-proxy. Two stars for confidence in the status is due to lack of suitable assessment criteria for some determinands (metals in biota and some biological effects measurements)
|
|
Minches and Western Scotland
|
 |
|
Two stars for confidence in the status is due to lack of suitable assessment criteria for some determinands (metals in biota and some biological effects measurements). In addition there is limited fish sites which impacts on the ability to make biological effects assessments.
|
|
Northern North Sea
|
|
|
Two stars for confidence in the status is due to lack of suitable assessment criteria for some determinands (metals in biota and some biological effects measurements)
|
|
Scottish Continental Shelf
|
|
|
One star for confidence in the status is due to lack of suitable assessment criteria for some determinands (metals in biota and some biological effects measurements). In addition this region could not be assessed for all determinand/matrix combinations due to the lack of sites
|
This Legend block contains the key for the status and trend assessment, the confidence assessment and the assessment regions (SMRs and OMRs or other regions used). More information on the various regions used in SMA2020 is available on the Assessment processes and methods page.
Status and trend assessment
|
Status assessment
(for Clean and safe, Healthy and biologically diverse assessments)
|
Trend assessment
(for Clean and safe, Healthy and biologically diverse and Productive assessments)
|
||
|---|---|---|---|
 |
Many concerns |
No / little change |
|
 |
Some concerns |
Increasing |
|
 |
Few or no concerns |
Decreasing |
|
 |
Few or no concerns, but some local concerns |
No trend discernible |
|
| |
Few or no concerns, but many local concerns |
All trends | |
 |
Some concerns, but many local concerns |
||
 |
Lack of evidence / robust assessment criteria |
||
| Lack of regional evidence / robust assessment criteria, but no or few concerns for some local areas | |||
 |
Lack of regional evidence / robust assessment criteria, but some concerns for some local areas | ||
| Lack of regional evidence / robust assessment criteria, but many concerns for some local areas | |||
Confidence assessment
|
Symbol |
Confidence rating |
|---|---|
|
Low |
|
|
Medium |
|
|
High |

Assessment regions
 and the Scottish Offshore Marine Regions (OMRs, O1 – O10)")
Key: S1, Forth and Tay; S2, North East; S3, Moray Firth; S4 Orkney Islands, S5, Shetland Isles; S6, North Coast; S7, West Highlands; S8, Outer Hebrides; S9, Argyll; S10, Clyde; S11, Solway; O1, Long Forties, O2, Fladen and Moray Firth Offshore; O3, East Shetland Shelf; O4, North and West Shetland Shelf; O5, Faroe-Shetland Channel; O6, North Scotland Shelf; O7, Hebrides Shelf; O8, Bailey; O9, Rockall; O10, Hatton.
 Regions. These have been used as the assessment areas for hazardous substances.")
, Regions.")