

Background
Ambient noise is the background level of sound in the sea. Natural sources such as waves, rain, and marine life contribute to the level, as well as anthropogenic sources. Ambient noise is comprised of sound at a wide range of frequencies.
Continuous anthropogenic noise is primarily generated by shipping and increases the ambient noise level mainly at low frequencies. Sources are typically less intense than impulsive sources (e.g. explosions, seismic survey or piling). However, the pervasive presence of continuous noise from shipping could lead to significant and widespread effects to animals, such as masking of sounds that animals use to communicate, forage or detect predators.
Policymakers are increasingly aware of the potential for ecological impact from underwater anthropogenic noise but are constrained by a lack of data on current and historic noise levels. International concern increasingly focuses on the potential negative effects of anthropogenic underwater noise on sensitive marine fauna, for example, reduction in reproductive rates due to behavioural disturbance, or reduced predator avoidance due to masking of natural sounds.
For this assessment, data were collected using underwater sound recorders deployed in the Moray Firth, North East and Forth and Tay Scottish Marine Regions (SMRs; Figure 1), as part of the East Coast Marine Mammal Acoustic Study (ECOMMAS). These data contributed to the first assessment of underwater noise levels in Scotland’s seas and provide a baseline for tracking future trends.
 monitoring locations.")
This assessment presents results from the first nationally coordinated effort to characterise continuous underwater noise levels in UK waters (as published by Merchant et al., 2016). This study reported baseline measurements of low frequency continuous sound for UK waters. The data informing this assessment were collected at ten locations in the North Sea by Marine Scotland Science, and were analysed by the Centre for Environment, Fisheries and Aquaculture Science (Cefas).
Environmental management of continuous underwater noise is greatly constrained by a lack of baseline data on ambient noise levels. This limits the ability of managers to make informed decisions at a range of scales, from the regulation of individual activities and developments through to large-scale ecosystem-based management via legislative instruments, e.g. international directives and national regulations. Policymakers are beginning to develop approaches to assess and manage this risk through international legislative frameworks and expert groups, e.g. the Convention for the Protection of the Marine Environment of the North East Atlantic (OSPAR) and the European Union (EU) Marine Strategy Framework Directive (MSFD). Scotland is leading in efforts to monitor and report on continuous noise levels, through involvement in several international projects aiming to assess noise on a large scale.
Monitoring in North Sea waters adjacent to Scotland has been ongoing since 2013, and effort has been extended to include monitoring in west coast waters. This monitoring is feeding into several collaborative international projects, such as:
- INTERREG North Sea Region “JOMOPANS”,
- INTERREG VA “COMPASS”,
- INTERREG VA “MarPAMM”,
- INTERREG Atlantic “JONAS”.
JOMOPANS and JONAS in particular aim to develop regional monitoring programmes for low-frequency continuous noise in the North Sea and north east Atlantic, using an innovative combination of modelling and high quality sound measurements at sea. Outputs from these projects will be the tools necessary for managers, planners and policymakers to incorporate the effects of continuous noise in their assessment of the environmental status of the region, and to evaluate measures to improve the environment.
This assessment focuses on levels of low-frequency continuous noise in Scottish waters. The dominant man-made contribution to low-frequency continuous noise is from shipping, due to the widespread and prolific occurrence of vessel traffic (Figure a).
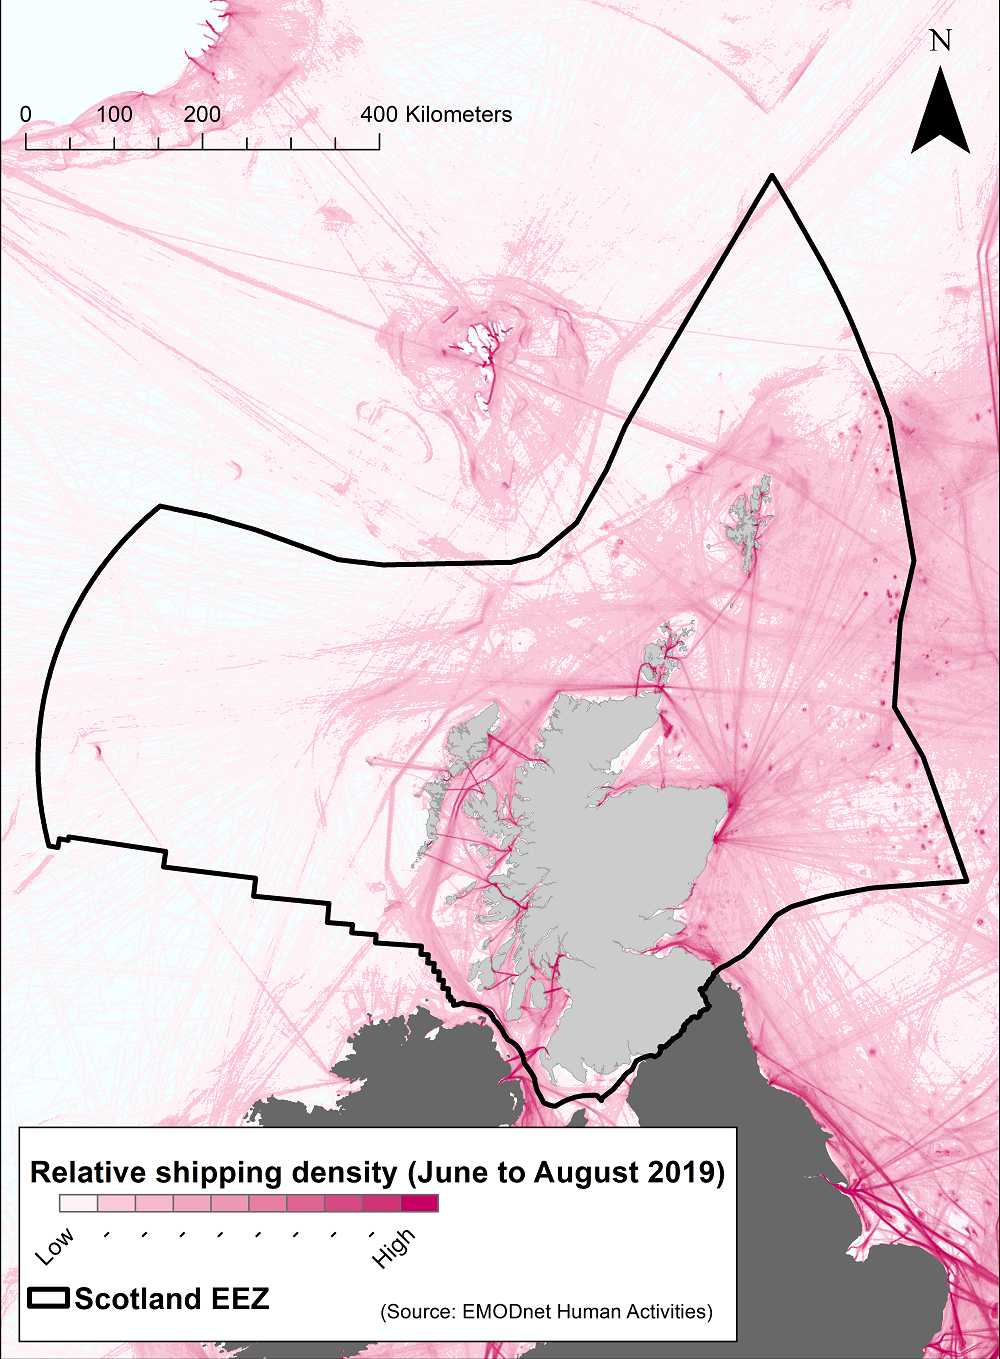
Figure a: Relative vessel density (June – August 2019) per 1 km2 in Scottish waters. The greater the intensity of pink, the higher the relative density of shipping. (Source: EMODnet)
Measuring continuous underwater noise levels uses technology and analytical methodology that has only been commercially developed over the last decade. No trend or previous status assessment for the Scottish marine area was available due to the lack of defined assessment criteria. However, these data provide a baseline for continuous noise levels in specific one-third octave frequency bands in the North Sea adjacent to Scotland. No assessment was undertaken in the 2011 Marine Atlas (Baxter et al., 2011). Levels at which continuous anthropogenic noise becomes a problem in the marine environment are poorly understood and are not defined.
Sound propagates from source with a degree of propagation loss, meaning the sound level declines with increasing distance from the source. The rate of propagation loss is influenced by a multitude of factors including frequency components of the sound, water depth, water temperature and salinity, type of seabed sediment and scattering processes such as currents and surface waves. Sound waves propagate better in deep water than in shallow, where scattering and absorption by the seabed and surface increase the rate of propagation loss. The speed of sound is influenced by temperature and salinity, which in turn influences the behaviour of sound waves as they propagate away from source. Low frequency sound waves generally propagate further than higher frequencies.
Data were collected using autonomous underwater acoustic recorders (SM2M; Wildlife Acoustics, Massachusetts, USA), as part of the Marine Scotland ECOMMAS array during the summers of 2013 (August to October) and 2014 (June to September). Data were collected at ten sites in the Forth and Tay, North East and Moray Firth Scottish Marine Regions (SMRs; Figure 1). The monitoring locations were initially chosen to monitor the occurrence of small cetacean (bottlenose dolphin and harbour porpoise) around the east coast, but coincidentally capture a range of oceanographic conditions and anthropogenic activity levels, at varying distances from the coast (5 – 15 km) across three SMRs.
Underwater sound recorders are primarily comprised of a hydrophone (an underwater microphone), electronic componentry that performs initial signal processing and data storage, and a power supply (battery pack) capable of sustaining autonomous operation for several months at a time. Sound recorders were calibrated by the UK National Physical Laboratory to allow calculation of absolute SPL from recorded data. These devices were deployed from a ship and were moored approximately 4 metres above the seabed. Deployment duration (< 4 months) meant that marine growth (biofouling) on the hydrophone element was minimal.
The sound recorders were programmed to sample sound pressure at a rate of 96,000 cycles per second, for either 10 minutes in every 20 minutes (50 % duty cycle; 2013) or 10 minutes in every 30 minutes (33 % duty cycle; 2014). Upon recovery, data were downloaded as waveform audio (.wav) files for analysis.
The entire dataset was analysed using a routine called PAMGuide, which runs in the numerical modelling software package MATLAB (Merchant et al., 2015). SPLs were processed at a resolution of one second, in one-third octave frequency bands centred around 63 Hz, 125 Hz, 250 Hz and 500 Hz. These four frequency bands were selected for detailed analysis, because the lower two are those required to be monitored under the MSFD in relation to continuous anthropogenic noise, while the two higher frequency bands have also been shown to correlate well with levels of broadband shipping noise (Merchant et al., 2014).
Statistical metrics from the analysis were computed to summarise the results for the whole Scottish area monitored, to provide an indicative baseline level for each one-third octave level: the median SPL; the root-mean-square (rms) SPL (the square root of the mean square of a waveform; a commonly used acoustic averaging metric required for MSFD reporting); the mode SPL; and the 90th percentile of the SPL (i.e. the sound level which is only exceeded 10 % of the time).
Results
Although data were collected at all ten sites during 2013 and 2014, data from the Cruden Bay site were excluded from the assessment as they were contaminated by a loud pulsed sound originating nearby. Data from the St Andrews site in 2014 were also excluded due to problems with the data.
A range of noise conditions were observed at the ten monitoring sites off the east coast (Figure 1). The spectrogram from the Fraserburgh site is typical of a site where anthropogenic noise from shipping makes a substantial contribution to the low-frequency soundscape. The spectrogram (Figure 2) shows frequent vessel passages, which appear as intense vertical bands with peak frequencies at ~100 Hz (Figure 2, one example of a vessel passing close to the recorder is labelled A), and a sustained period of high noise levels on 14 September, apparently due to a vessel moored near the monitoring location (Figure 2, labelled B).
Overall, the continuous noise levels at each site are broadly similar (Figure 3). Noise levels in the 125 Hz one-third octave band are predominantly within the range 80 – 120 dB re 1 μPa rms, and the modes of these distributions lie between 84 – 95 dB re 1 μPa rms.
An exception is the Cromarty site, which is located in the relatively sheltered waters of the inner Moray Firth. Here, the mode noise level in the 125 Hz one-third octave band was lower than at other sites (ca. 84 dB re 1 μPa rms) in both 2013 and 2014 (Figure 3). While the inner Moray Firth does sustain noise from shipping, levels of vessel traffic are relatively low compared to the main coastal shipping routes close to major ports such as Aberdeen and Peterhead. The shallower waters of the inner Moray Firth will also result in comparatively poor propagation of low-frequency sound, with the result that noise from shipping traffic in the wider Moray Firth SMR is not detectable at the monitoring location. This highlights how local oceanographic conditions can lead to deviations from wider trends in a monitoring region.
There are as yet no defined assessment criteria for continuous anthropogenic noise, so it is not possible to make an assessment of the status of the Scottish marine area. In addition, it is not clear at what level continuous anthropogenic noise will have a negative impact on marine life. However, these data provide a useful baseline for the North Sea for comparison in future assessments.
Continuous anthropogenic noise was not assessed in the 2011 Marine Atlas (Baxter et al., 2011) and no assessment of trend can be made.
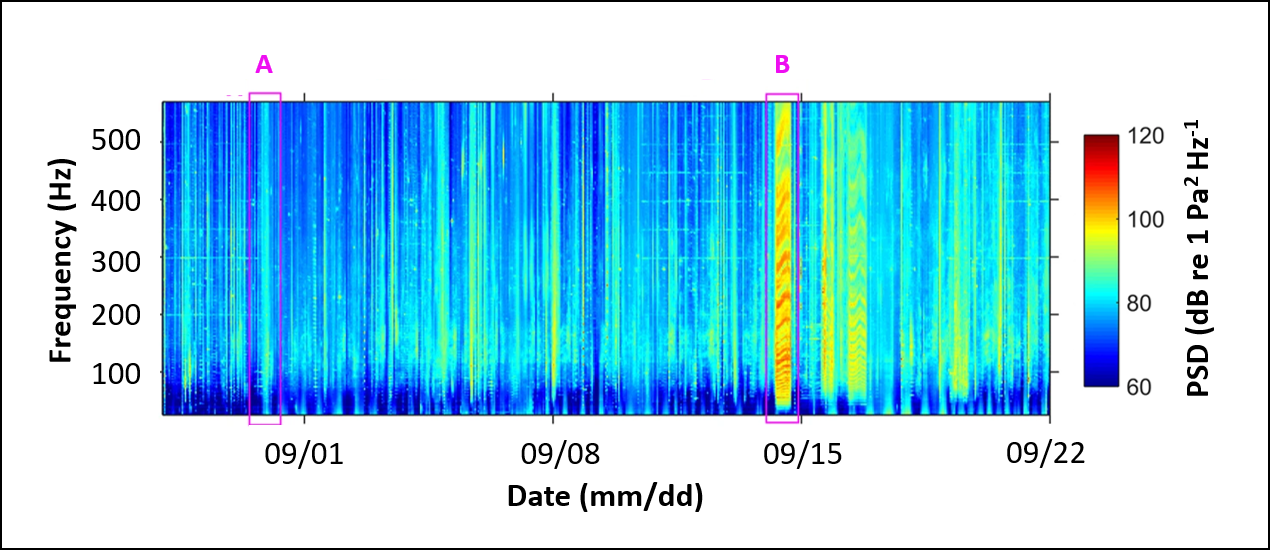
Figure 2: Spectrogram showing data from the Fraserburgh monitoring site (referred to by Merchant et al. (2016) as NNS5) from a period during 2013.
The colour scale (Power Spectral Density; PSD) indicates noise level at a given time and frequency, with absolute noise levels as indicated by the colour bar.
The box labelled A indicates an example of a vessel passage close to the sound recorder; the box labelled B, indicates a sustained period of high noise levels on 14 September, appears to be a vessel moored near the monitoring location.
(Reproduced from Merchant et al. (2016), Scientific Reports).
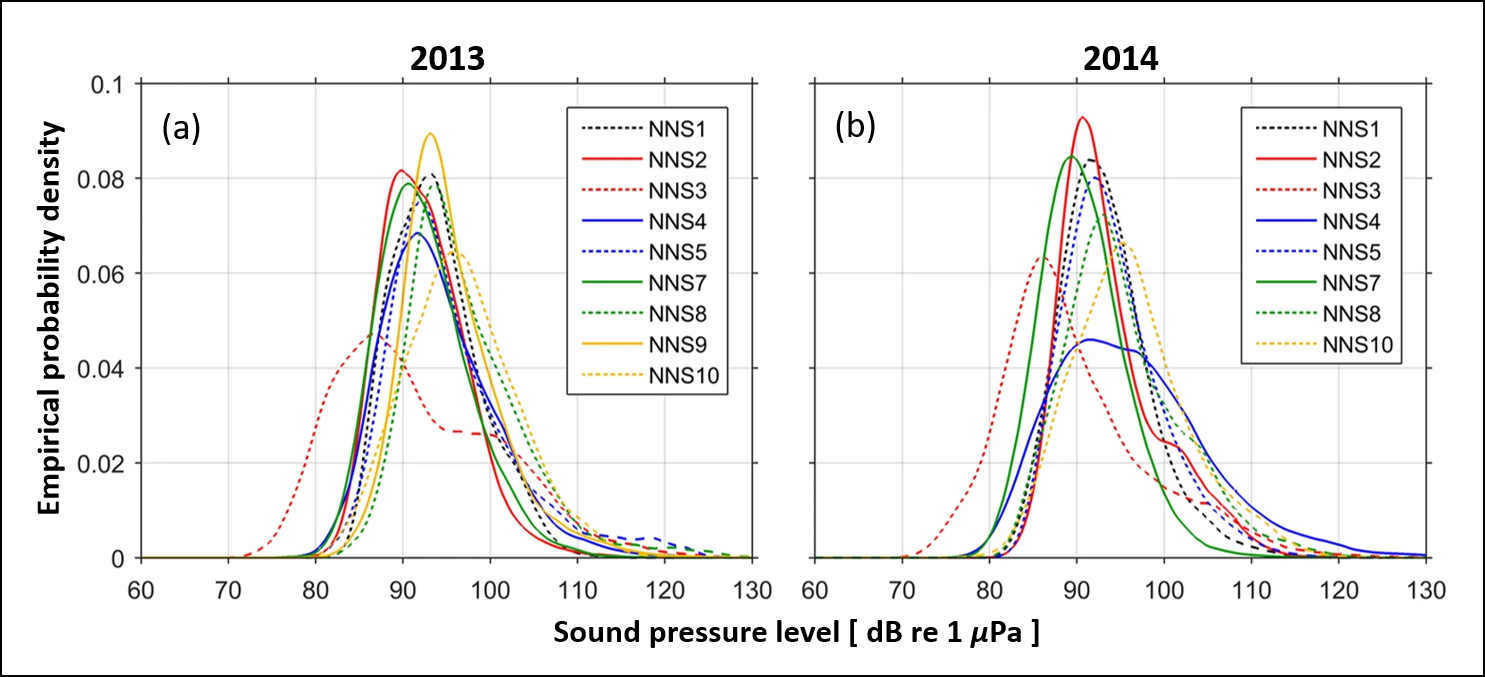
Figure 3: Empirical probability densities of noise levels in the 125 Hz one-third octave band.
Site names in the figure legend come from Merchant et al. (2016), and represent the following locations illustrated in Figure 1: NNS1 Latheron; NNS2 Helmsdale; NNS3 Cromarty; NNS4 Spey Bay; NNS5 Fraserburgh; NNS6 Cruden Bay; NNS7 Stonehaven; NNS8 Arbroath; NNS9 St Andrews; NNS10 St Abbs.
(Reproduced from Merchant et al. (2016), Scientific Reports).
Noise levels at the North Sea monitoring locations, from the summers of 2013 (n = 9) and 2014 (n = 8), were summarised using four different statistical metrics across four one-third octave frequency bands. Data from the Cruden Bay site were omitted in both years due to a persistent pulsed noise source, thought to be an acoustic deterrent device close to the monitoring site, and the resulting data were considered to be not representative of the continuous soundscape. Data from the St Andrews site in 2014 were also deemed unusable.
|
Location ID
|
Lat
|
Lon
|
Depth (m)
|
Duty cycle
|
Sample rate
|
Data start date
|
Data end date
|
|
Latheron
|
58.269333
|
-3.318194
|
23
|
10 min on, 10 min off
|
96 kHz
|
10/08/2013
|
14/10/2013
|
|
Helmsdale
|
57.975703
|
-3.535840
|
49
|
10 min on, 10 min off
|
96 kHz
|
10/08/2013
|
25/09/2013
|
|
Cromarty
|
57.706683
|
-3.810718
|
16
|
10 min on, 10 min off
|
96 kHz
|
10/08/2013
|
15/10/2013
|
|
Spey Bay
|
57.741482
|
-3.038816
|
22
|
10 min on, 10 min off
|
96 kHz
|
10/08/2013
|
12/10/2013
|
|
Fraserburgh
|
57.711346
|
-2.130122
|
37
|
10 min on, 10 min off
|
96 kHz
|
10/08/2013
|
07/10/2013
|
|
Cruden Bay*
|
57.380190
|
-1.828364
|
22
|
10 min on, 10 min off
|
96 kHz
|
10/08/2013
|
12/10/2013
|
|
Stonehaven
|
56.946944
|
-2.176713
|
28
|
10 min on, 10 min off
|
96 kHz
|
10/08/2013
|
03/10/2013
|
|
Arbroath
|
56.499798
|
-2.379895
|
49
|
10 min on, 10 min off
|
96 kHz
|
10/08/2013
|
11/10/2013
|
|
St Andrews
|
56.257894
|
-2.499312
|
43
|
10 min on, 10 min off
|
96 kHz
|
10/08/2013
|
18/10/2013
|
|
St Abbs
|
55.929198
|
-2.177105
|
33
|
10 min on, 10 min off
|
96 kHz
|
10/08/2013
|
28/11/2013
|
|
Latheron
|
58.269333
|
-3.318194
|
23
|
10 min on, 20 min off
|
96 kHz
|
25/06/2014
|
05/10/2014
|
|
Helmsdale
|
57.975703
|
-3.535840
|
49
|
10 min on, 20 min off
|
96 kHz
|
25/06/2014
|
25/09/2014
|
|
Cromarty
|
57.706683
|
-3.810718
|
16
|
10 min on, 20 min off
|
96 kHz
|
25/06/2014
|
29/09/2014
|
|
Spey Bay
|
57.741482
|
-3.038816
|
22
|
10 min on, 20 min off
|
96 kHz
|
25/06/2014
|
12/09/2014
|
|
Fraserburgh
|
57.711346
|
-2.130122
|
37
|
10 min on, 20 min off
|
96 kHz
|
25/06/2014
|
14/09/2014
|
|
Cruden Bay*
|
57.380190
|
-1.828364
|
22
|
10 min on, 20 min off
|
96 kHz
|
25/06/2014
|
05/10/2014
|
|
Stonehaven
|
56.946944
|
-2.176713
|
28
|
10 min on, 20 min off
|
96 kHz
|
25/06/2014
|
24/09/2014
|
|
Arbroath
|
56.499798
|
-2.379895
|
49
|
10 min on, 20 min off
|
96 kHz
|
25/06/2014
|
12/09/2014
|
|
St Andrews*
|
56.257894
|
-2.499312
|
43
|
10 min on, 20 min off
|
96 kHz
|
25/06/2014
|
12/09/2014
|
|
St Abbs
|
55.929198
|
-2.177105
|
33
|
10 min on, 20 min off
|
96 kHz
|
25/06/2014
|
12/09/2014
|
Noise levels are presented in Table a as the medians of those values for all monitoring locations. The mode describes the sound pressure level most regularly recorded, while the median describes the middle of the distribution of sound pressure levels.
The 90th percentile shows the sound pressure level that was only exceeded 10% of the time, and the rms value is a commonly used acoustical averaging metric.
|
Statistic
|
One-third octave frequency band
|
|||
|---|---|---|---|---|
|
63 Hz
|
125 Hz
|
250 Hz
|
500 Hz
|
|
|
Mode
|
90.0
|
92.0
|
94.5
|
94.3
|
|
Median
|
90.5
|
93.6
|
95.5
|
94.6
|
|
90th percentile
|
100.3
|
103.5
|
103.9
|
103.3
|
|
RMS
|
101.8
|
103.8
|
104.5
|
104.2
|
Each statistic represents all data from every site (across both 2013 and 2014). All metrics are sound pressure levels (SPL) in the corresponding one-third octave frequency band (per column), in units of dB re 1 μPa.
(Reproduced from Merchant et al. (2016), Scientific Reports).
Conclusion
This is the first reported assessment of continuous underwater noise in Scottish waters (as published in Merchant et al. 2016). No trend or inter-annual comparison is available and this assessment should be considered a report of baseline noise levels, in four one-third octave frequency bands, in the Scottish North Sea.
While data were only available during the summer months in 2013 and 2014, these data nonetheless provide a broad spatial coverage, at east coast sites ranging from the northern Moray Firth to the border with England.
The results show levels in Scottish North Sea waters that are broadly comparable with the rest of the UK (i.e. southern North Sea and Celtic Sea; Merchant et al., 2016) and other studies internationally (Merchant et al., 2013; Mustonen et al., 2019).
At this stage there is little evidence of the level at which continuous anthropogenic noise could cause harm to marine species nor agreement on what constitutes a “safe” level of continuous anthropogenic noise. Further work is ongoing to attempt to quantify risk and identify an appropriate suite of indicators for north-east Atlantic waters.
Knowledge gaps
A lack of reported data from northern and western Scotland and offshore regions constrains understanding in these regions. Marine Scotland is actively engaged in projects to address some of these gap in knowledge, i.e. the COMPASS and MarPAMM projects in west coast waters (West Highlands, Outer Hebrides and Argyll Scottish Marine Regions) and the JONAS project in offshore Atlantic waters.
Knowledge gaps still exist in terms of the thresholds of underwater noise which have deleterious impacts on marine species such as cetaceans, pinnipeds, fish and invertebrates.
The implications of masking, and an understanding of at what noise levels it occurs for different species, are highly uncertain.
Data used in this assessment, from 2013 and 2014, were collected only during the summer months. Continuous noise levels during the winter period have not been assessed. Data were collected during 2015 – 2020 but were not processed and analysed in time for this assessment.
The extent of acoustic masking of natural sounds used by animals (e.g. to communicate, find food and avoid predators) is a major knowledge gap, which will dictate the noise levels at which environmental impacts may occur for different taxonomic groups.
Status and trend assessment
This assessment describes a baseline of continuous noise in the Scottish North Sea in 2013-2014. Since thresholds have not been determined for the effect of this pressure to marine species, and no previous assessment has been carried out, a traffic light assessment has not been recommended.
This Legend block contains the key for the status and trend assessment, the confidence assessment and the assessment regions (SMRs and OMRs or other regions used). More information on the various regions used in SMA2020 is available on the Assessment processes and methods page.
Status and trend assessment
|
Status assessment
(for Clean and safe, Healthy and biologically diverse assessments)
|
Trend assessment
(for Clean and safe, Healthy and biologically diverse and Productive assessments)
|
||
|---|---|---|---|
 |
Many concerns |
No / little change |
|
 |
Some concerns |
Increasing |
|
 |
Few or no concerns |
Decreasing |
|
 |
Few or no concerns, but some local concerns |
No trend discernible |
|
 |
Few or no concerns, but many local concerns |
All trends | |
 |
Some concerns, but many local concerns |
||
 |
Lack of evidence / robust assessment criteria |
||
| Lack of regional evidence / robust assessment criteria, but no or few concerns for some local areas | |||
 |
Lack of regional evidence / robust assessment criteria, but some concerns for some local areas | ||
| Lack of regional evidence / robust assessment criteria, but many concerns for some local areas | |||
Confidence assessment
|
Symbol |
Confidence rating |
|---|---|
|
Low |
|
|
Medium |
|
|
High |

Assessment regions
 and the Scottish Offshore Marine Regions (OMRs, O1 – O10)")
Key: S1, Forth and Tay; S2, North East; S3, Moray Firth; S4 Orkney Islands, S5, Shetland Isles; S6, North Coast; S7, West Highlands; S8, Outer Hebrides; S9, Argyll; S10, Clyde; S11, Solway; O1, Long Forties, O2, Fladen and Moray Firth Offshore; O3, East Shetland Shelf; O4, North and West Shetland Shelf; O5, Faroe-Shetland Channel; O6, North Scotland Shelf; O7, Hebrides Shelf; O8, Bailey; O9, Rockall; O10, Hatton.
 Regions. These have been used as the assessment areas for hazardous substances.")
, Regions.")