What, why and where?
Seafood processing includes both primary processing (such as: heading and gutting, filleting, washing, chilling and packaging) and secondary processing (such as: freezing, smoking, cooking, breading and production of ready meals). The seafood processing industry is predominantly a terrestrial activity but is highly dependent on fish landed or farmed in Scottish waters. Therefore fish processing has been included as part of this economic activity assessment.
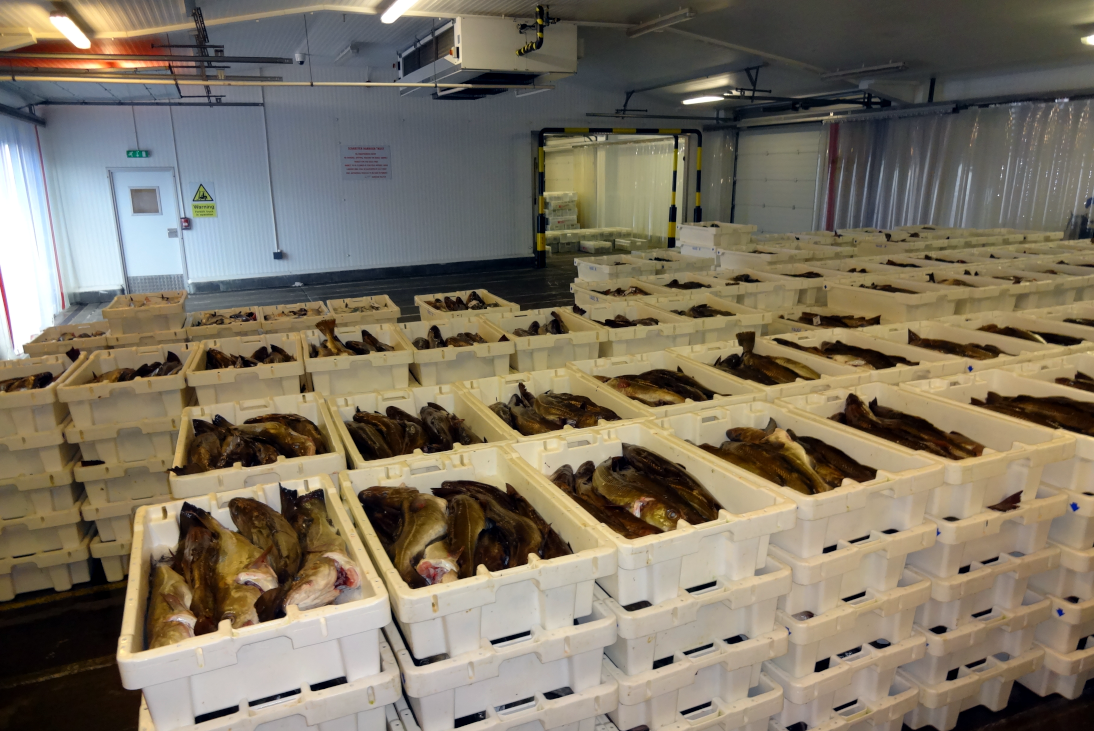
As at June 2019, there were 318 establishments in Scotland dealing with fishery products (FSA, 2019). 19% of these were in Aberdeenshire, with 16% in Highland and 10% in Aberdeen City (Figure 2). These include establishments working with fishery products using factory and freezing vessels, processing plants, those working with fresh fishery products, or auction halls or wholesale markets dealing with fish (Figure 1). 273 of the 318 fishery product establishments were registered as fish processing plants.
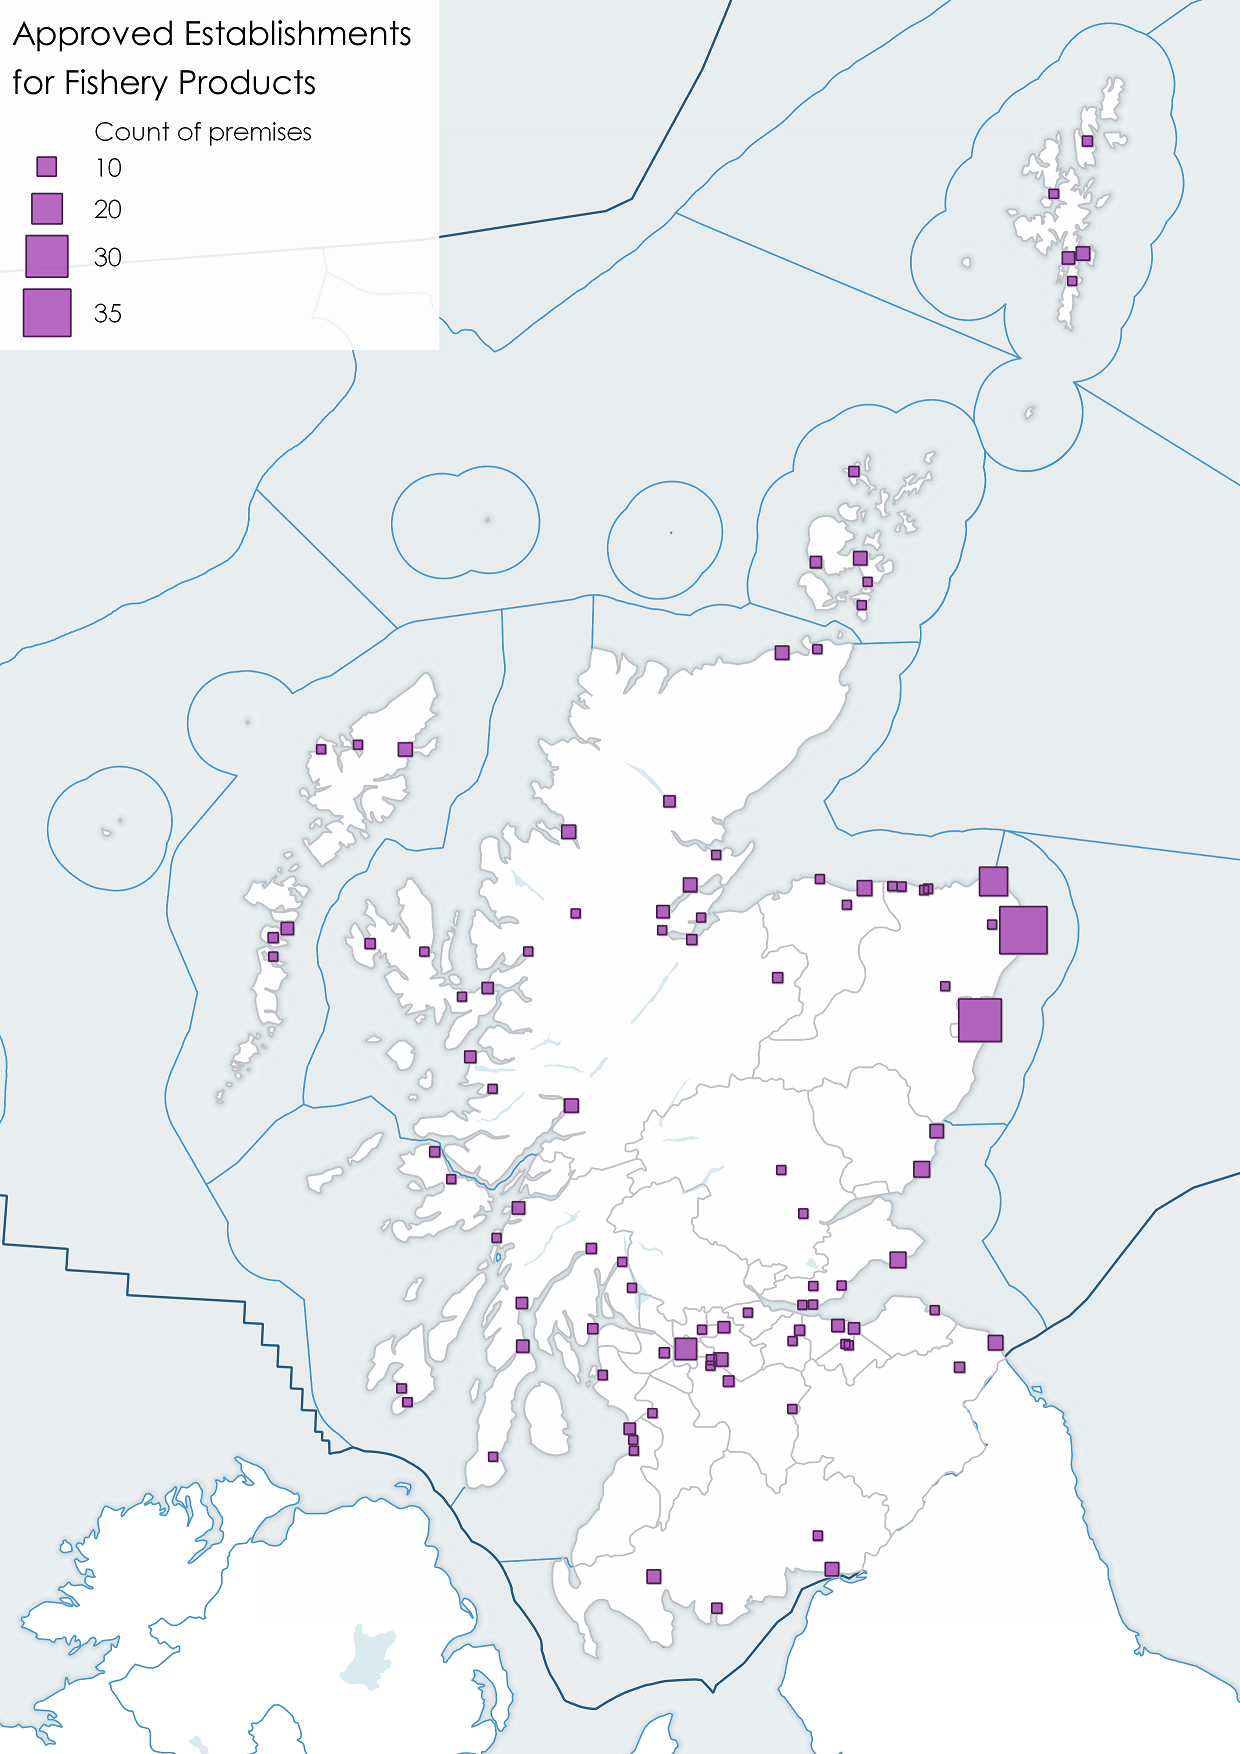
Figure 1: Number of registered fishery product establishments by location, July 2019. Source: Marine Scotland and FSA, 2019.
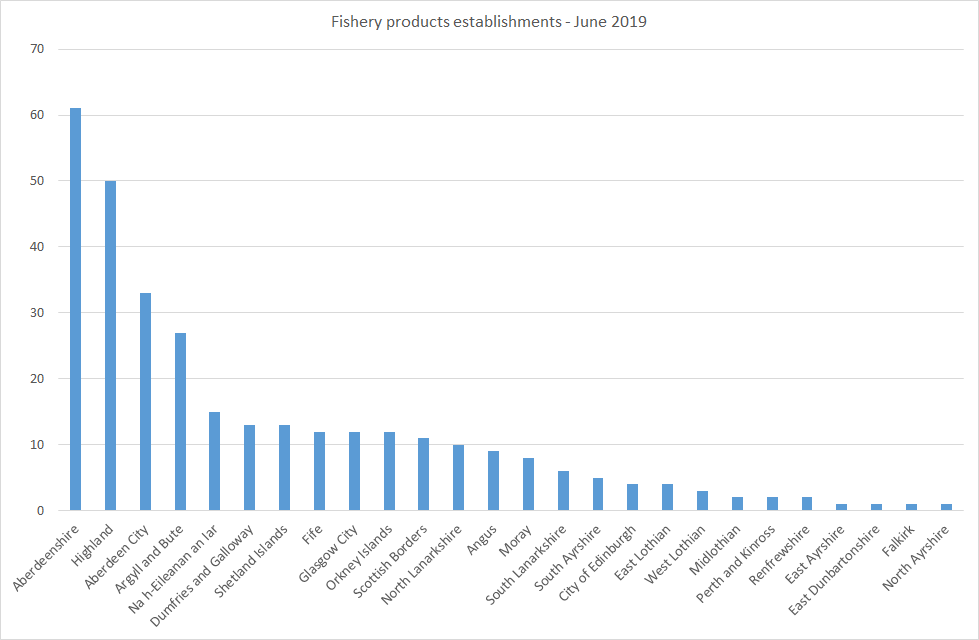
Figure 2: The geographical distribution of fish products establishments* across Scottish local authorities as at June 2019. *Covers establishments working with fishery products using factory and freezing vessels, processing plants, fresh fishery products, auction halls, wholesale markets. Source: FSA, 2019.
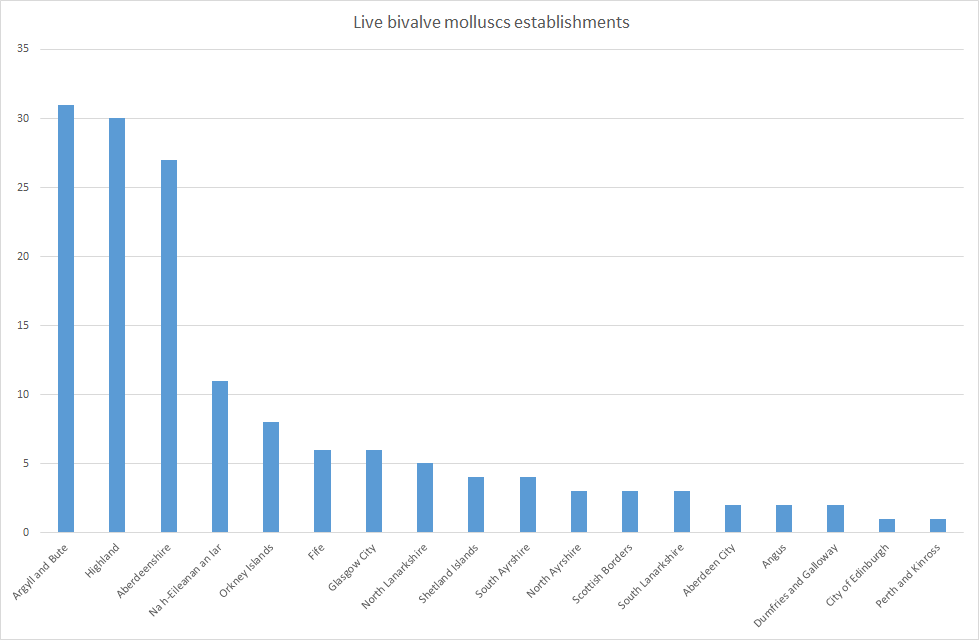
In addition to the 318 establishments dealing with fishery products, there were also 149 establishments in Scotland dealing with live bivalve molluscs (includes oysters, mussels, clams, cockles and scallops), including dispatch centres and purification centres.
Live bivalve molluscs are filter feeders and are susceptible to picking up and accumulating toxins, chemical or bacteriological contaminants from their environment. To reduce the risk of contamination, these species can only be commercially harvested from classified production areas that are monitored. They also undergo treatment to reduce the level of microbiological contamination in them and ensure they are safe for placing on the market. The local authority distribution of the 149 establishments in Scotland dealing with live bivalve molluscs, including dispatch centres and purification centres is shown in Figure a and Table a.
|
|
Fishery product establishments
|
Live bivalve molluscs dispatch and/or purification centres
|
|
|
Local authority
|
Total
|
of which: fish processing plant
|
|
|
Aberdeen City
|
33
|
30
|
2
|
|
Aberdeenshire
|
61
|
52
|
27
|
|
Angus
|
9
|
8
|
2
|
|
Argyll and Bute
|
27
|
25
|
31
|
|
City of Edinburgh
|
4
|
3
|
1
|
|
Dumfries and Galloway
|
13
|
10
|
2
|
|
East Ayrshire
|
1
|
1
|
0
|
|
East Dunbartonshire
|
1
|
0
|
0
|
|
East Lothian
|
4
|
4
|
0
|
|
Falkirk
|
1
|
1
|
0
|
|
Fife
|
12
|
9
|
6
|
|
Glasgow City
|
12
|
9
|
6
|
|
Highland
|
50
|
43
|
30
|
|
Midlothian
|
2
|
1
|
0
|
|
Moray
|
8
|
7
|
0
|
|
Na h-Eileanan an Iar
|
15
|
14
|
11
|
|
North Ayrshire
|
1
|
1
|
3
|
|
North Lanarkshire
|
10
|
10
|
5
|
|
Orkney Islands
|
12
|
9
|
8
|
|
Perth and Kinross
|
2
|
2
|
1
|
|
Renfrewshire
|
2
|
2
|
0
|
|
Scottish Borders
|
11
|
11
|
3
|
|
Shetland Islands
|
13
|
10
|
4
|
|
South Ayrshire
|
5
|
2
|
4
|
|
South Lanarkshire
|
6
|
6
|
3
|
|
West Lothian
|
3
|
3
|
0
|
|
Total
|
318
|
273
|
149
|
Contribution to the economy
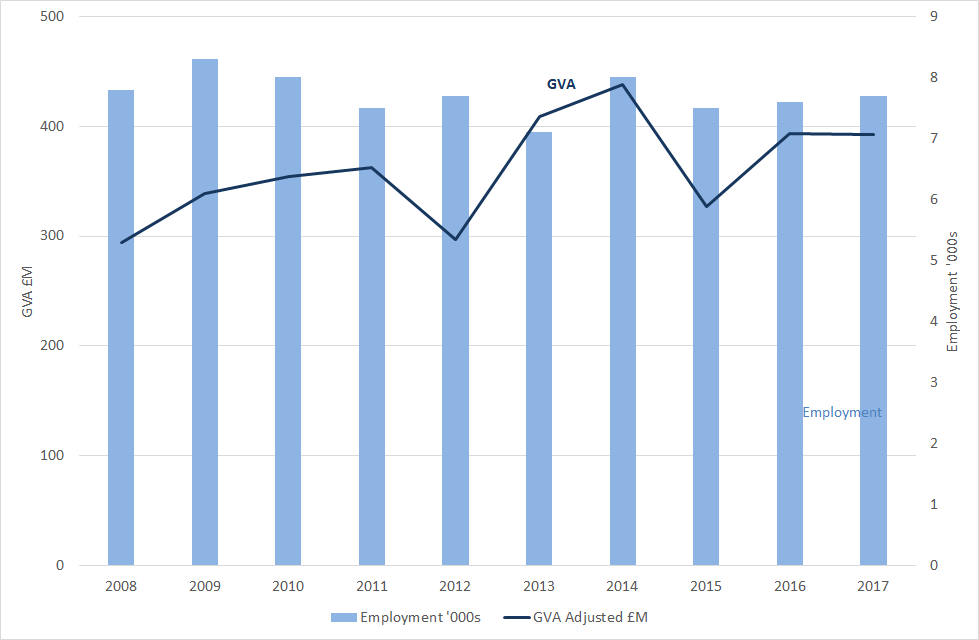
In 2017, seafood processing contributed £392 million GVA, and employment for 7,700 workers to the Scottish economy (Scottish Government, 2019). From 2013 to 2017 the Gross Value Added (GVA) for seafood processing decreased by 4% to £392 million, whilst employment (headcount) increased by 8% to 7,700 in 2017 (Table 1).
|
|
2013 |
2014 |
2015 |
2016 |
2017 |
% change from 2013 to 2017 |
|
GVA £M |
409 |
438 |
327 |
393 |
392 |
-4% |
|
Employment |
7,100 |
8,000 |
7,500 |
7,600 |
7,700 |
8% |
Between 2008 and 2017 seafood processing GVA (adjusted to 2017 prices) increased by one third. With some variation from year to year, employment in seafood processing in Scotland has changed little between 2008 to 2017 (Figure 3). GVA has fluctuated more over the same period, but the overall trend is increasing.
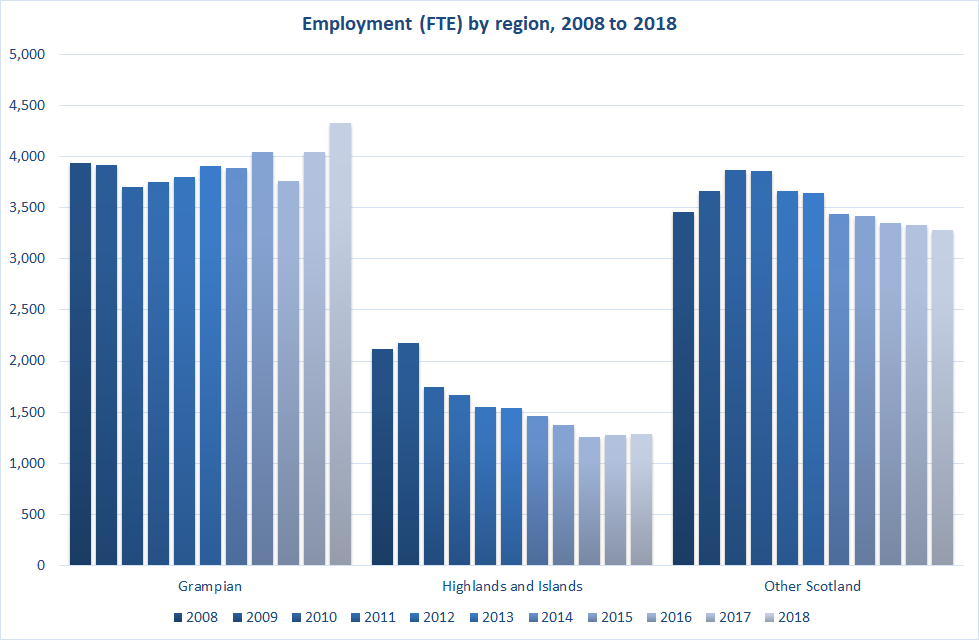
Scottish Marine Economic Statistics (SMES) do not disaggregate processing statistics by geographic region, though the Seafish data obtained through their online Processing Enquiry Tool do (Seafish, 2018). The figure below shows the Seafish values for the regional distribution of jobs across their three Scottish regions. For this assessment, ‘workers at majority seafood processing sites’ is shown. It is worth noting that the chart shows full time equivalent (FTE) values while the SMES table shows headcount, and that the SMES and Seafish data are collected using different surveys, resulting in variations of between 10% and 20% between the results.
Processing jobs in Scotland account for around 46% of total UK processing jobs.
|
|
Total employment in 2018
|
Change from 2014 to 2018
|
|
|
|
#
|
%
|
|
|
Grampian
|
4,327
|
441
|
11%
|
|
Highlands and Islands
|
1,290
|
-169
|
-12%
|
|
Other Scotland
|
3,283
|
-161
|
-5%
|
|
All Scotland
|
8,900
|
112
|
1%
|
Examples of socio-economic effects
- Employment in remote and rural communities.
- Providing healthy food and food security.
- Potential loss of access to EU Markets and increase of non-tariff barriers to those markets such as increased certification.
- Migrant labour shortages could impact the sector.
- Lack of clarity as to what funding will replace EU schemes such as European Maritime and Fisheries Fund.
Forward look
The Scottish Government is seeking to build the industry’s ability to generate investment in order to increase the capacity of Scotland’s processing sector. The proportion of fish exported from Scotland, without processing, represents a major opportunity for more value added fish products to be processed and manufactured in Scotland.
UK consumer trends favour fish as a sustainable, healthy protein source and there is increasing demand for reliable supplies of Scottish fish products from overseas markets. The processing sector will need to develop to reach increased demand for Scottish seafood.
The digital and automation technology revolution presents an opportunity to address some labour supply issues as well as providing new marketing and process control tools. Innovation around energy consumption can tackle the increasing cost of utilities whilst contributing to reducing greenhouse gases emissions.
Coordination of the catching and processing sectors and infrastructure can provide additional confidence to the sector to plan and invest to exploit new market opportunities.
In 2016, a survey (Scottish Government, 2018) of Scotland-based seafood processing businesses explored employment patterns of non-United Kingdom (UK) European Economic Area (EEA) workers in the sector. The survey found that, of the people working in the surveyed processors, 41% were from the UK, 58% were from other EEA counties and 1% were from non-EEA countries. Following Brexit, it is essential to ensure that a sufficient supply of appropriately skilled workers are available.
Economic trend assessment
National assessment is derived from the change in GVA from 2013 to 2017.
GVA in sea fish processing fell by 4% in Scotland between 2013 and 2017.
Based on published statistics
Lowest available geography is Scotland.
Regional trends by GVA from the Scottish Annual Business survey (SABS) are not available. Data on GVA and FTE jobs in the Seafood processing industry is available from a different source, Seafish. However, this data is of a lower quality and is not comparable with SABS as it uses a small sample of majority processors across the UK. It also suffers from sampling bias due to self-selection and low response rate. Therefore no reliable and comparable regional trends are available.
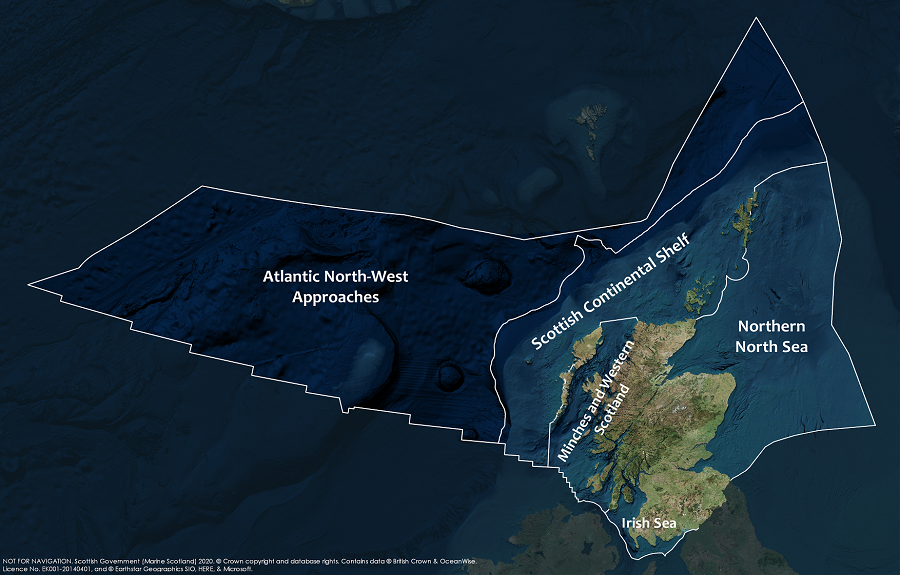
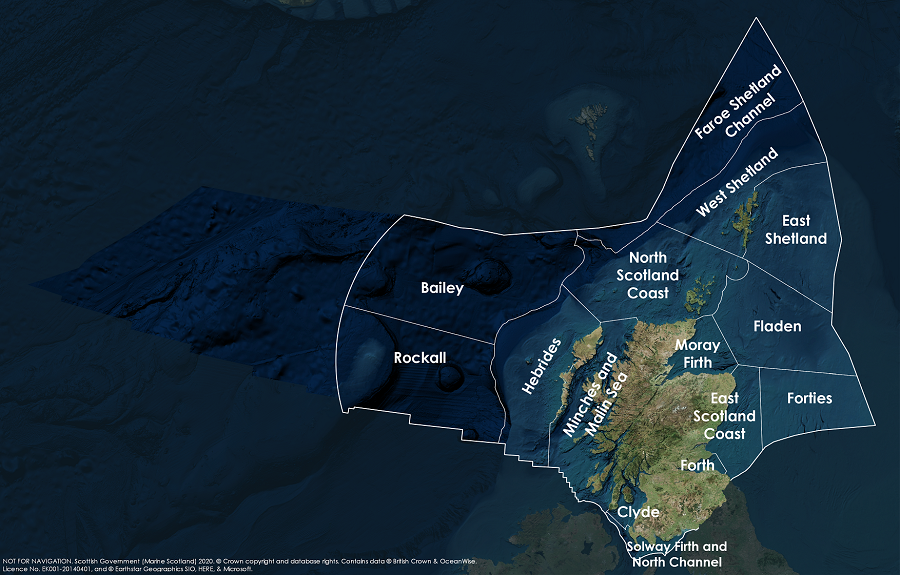
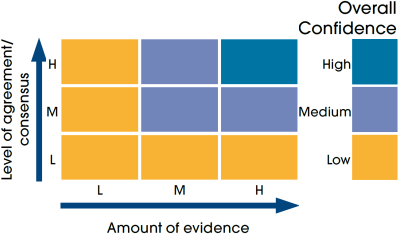
This Legend block contains the key for the status and trend assessment, the confidence assessment and the assessment regions (SMRs and OMRs or other regions used). More information on the various regions used in SMA2020 is available on the Assessment processes and methods page.
Status and trend assessment
|
Status assessment
(for Clean and safe, Healthy and biologically diverse assessments)
|
Trend assessment
(for Clean and safe, Healthy and biologically diverse and Productive assessments)
|
||
|---|---|---|---|
 |
Many concerns |
No / little change |
|
 |
Some concerns |
Increasing |
|
 |
Few or no concerns |
Decreasing |
|
 |
Few or no concerns, but some local concerns |
No trend discernible |
|
 |
Few or no concerns, but many local concerns |
All trends | |
 |
Some concerns, but many local concerns |
||
 |
Lack of evidence / robust assessment criteria |
||
| Lack of regional evidence / robust assessment criteria, but no or few concerns for some local areas | |||
 |
Lack of regional evidence / robust assessment criteria, but some concerns for some local areas | ||
| Lack of regional evidence / robust assessment criteria, but many concerns for some local areas | |||
Confidence assessment
|
Symbol |
Confidence rating |
|---|---|
|
Low |
|
|
Medium |
|
|
High |
Assessment regions
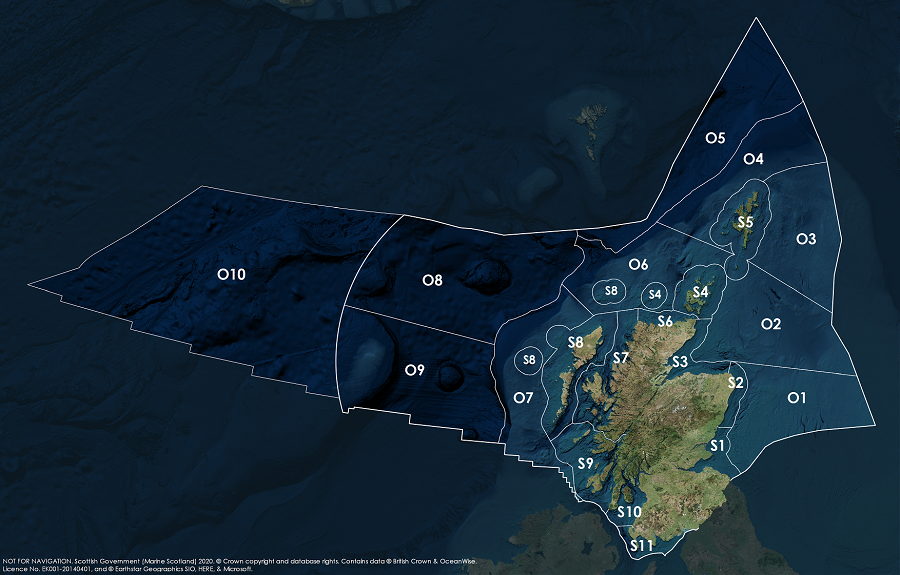
Key: S1, Forth and Tay; S2, North East; S3, Moray Firth; S4 Orkney Islands, S5, Shetland Isles; S6, North Coast; S7, West Highlands; S8, Outer Hebrides; S9, Argyll; S10, Clyde; S11, Solway; O1, Long Forties, O2, Fladen and Moray Firth Offshore; O3, East Shetland Shelf; O4, North and West Shetland Shelf; O5, Faroe-Shetland Channel; O6, North Scotland Shelf; O7, Hebrides Shelf; O8, Bailey; O9, Rockall; O10, Hatton.
