
Sections
Key message

Background
Impulsive noise is a pulsed sound that is often very loud and has a sudden onset. It is generated through activities such as acoustic surveys of seabed geology, pile-driving structures into the seabed (Figure 1), underwater explosions and various types of sonar (emitting sound pulses to detect underwater objects).
It is assessed because of its potential physiological and disturbance effects to marine organisms. Disturbance effects in particular can occur at large distances from the sound source, since sound travels approximately 4.5 times faster in water than in air. These effects have the potential to cause disruption to feeding, socialising and reproduction in marine mammals and fish, which could have individual and population consequences for these species.
This assessment is a description of the impulsive noise pressure on the environment, using data reported to the Marine Noise Registry (MNR). The MNR is hosted and managed by Joint Nature Conservation Committee (JNCC) and collates UK wide data. Impulsive noise is reported as pulse block days (PBD): the number of days of impulsive noise generating activity per United Kingdom Continental Shelf (UKCS) licensing block (Figure 2).
The initial purpose of monitoring anthropogenic impulsive noise is to quantify the pressure on the environment by making available an overview of relevant impulsive sound sources throughout the year. This in turn will aid in the definition of a baseline level for impulsive noise in Scottish waters.
There is ongoing work by expert groups of the OSPAR Convention and the European Union (EU) to establish indicators of the risk of impact of the noise pressure on marine wildlife and the subsequent establishment of threshold values for that indicator.

The MNR was developed to collect standardised data on impulsive noise to facilitate reporting for Marine Strategy Framework Directive (MSFD) purposes. These data are collected to assess the overall pressure on the marine environment from all loud, impulsive, low- and mid-frequency (10 Hz – 10 kHz) sound sources throughout the year. UK data from the MNR, along with those from other EU Member States are submitted to the OSPAR Commission regional registry hosted by the International Council for the Exploration of the Sea (ICES). The complete dataset is analysed by the OSPAR Intersessional Correspondence Group on Underwater Noise (ICG-Noise).
Underwater noise from human activities in the frequency range reported to the MNR (10 Hz – 10 kHz) can affect marine organisms, from fish to marine mammals, in a variety of ways, from masking of foraging and communication sounds, to physical injury and even death. Low- and mid-frequency sound can travel long distances through water and, depending on the physical characteristics of the sound (e.g. amplitude, frequency, duration of pulse and number of pulses), can have impacts outwith the immediate area where the sound is generated. Understanding when and where noisy activities take place allows the monitoring of temporal and spatial trends in impulsive noise in the sea, and will inform the management of human activities.
The MNR does not assess impacts of impulsive noise, as these are assessed on a development / project specific basis through the Environmental Impact Assessment process for activities such as feeding, socialising and reproduction.
An overall assessment of the effect of impulsive noise on the marine environment is challenging to undertake due to limited knowledge of the cumulative effects of noise at a population level, and the fact that currently there is no definition of what would constitute Good Environmental Status (GES) for the impulsive noise pressure.
The metric “pulse block days” represents an occurrence of a noisy activity within a United Kingdom Continental Shelf (UKCS) licensing block, on a given day. Blocks measure 10 minutes of latitude by 12 minutes of longitude. PBD does not represent the duration of the noisy activity, nor does it represent the spatial footprint of the noise generated by the activity.
Impulsive noise has been assessed through records provided to the MNR for the UK. Marine industries undertaking activities that produce impulsive noises at frequencies between 10 Hz and 10 kHz (such as oil & gas exploration, port and harbour developments, offshore wind construction) are required through marine licensing to provide information to the MNR including the location, source of the impulsive noise (e.g. seismic survey, pile driving) and dates on which the activity occurred. These data are collated by JNCC to produce a dataset of the number of days with impulsive noise in each United Kingdom Continental Shelf (UKCS) oil and gas licensing block in the UK Exclusive Economic Zone (EEZ).
For this assessment, 2015 – 2017 data were available. The data set has been clipped to Scottish waters, and covers all of the Scottish Marine Regions (SMRs) and Offshore Marine Regions (OMRs). Because of the highly variable, clustered and generally sparse nature of impulsive noise records in the MNR, as well as the lack of alignment between the reporting structure (per UKCS block) and the SMR/OMR, it has not been possible to assess impulsive noise at the SMR or OMR scale. The majority of pulse block days (PBD; the count of days of impulsive noise generating activity per block) occurred in offshore waters.
No thresholds have been set for the number of days of impulsive noise that are acceptable within a block. Work to determine this is ongoing through working groups under both OSPAR (Intersessional Correspondence Group on Underwater Noise) and MSFD (Technical Group on Underwater Noise). The assessment provided here is a description of the numbers of days of impulsive noise in UKCS blocks in Scottish waters, broken down by activity and year.
The activities reported to the MNR include:
- Geophysical surveys of the seabed, which use sound sources to study the geology of the sediment and rocks below the seabed (e.g. sub-bottom profilers, seismic air guns). Whilst sub-bottom profilers are commonly used to determine sediment types prior to installation of structures in the seabed, such as cables, pipelines or wind turbine foundations, seismic surveying is primarily used to determine rock types and locate hydrocarbon reservoirs deep underground.
- Multibeam echosounders are used to determine characteristics of the seabed itself (e.g. to determine the route for a cable or pipeline, or to locate wreckage or unexploded ordnance).
- Impact (or percussive) pile-driving, which uses a hydraulic hammer to drive a pile into the seabed. This is used in construction, i.e. to install structures such as offshore wind turbine and oil platform foundations).
- Explosions, which can be of non-military (e.g. decommissioning, rock blasting or unexploded ordnance clearance) and military (e.g. training or combat) origin.
- Military sonar; military activities are only reported to the MNR if they are unclassified.
- Acoustic deterrent devices are licensed for use at sites of marine construction to avoid injury to wildlife. These devices use a controlled sound signal to temporarily displace marine animals from an area where they could be at risk of hearing damage from loud sound sources, such as explosions and impact piling.
Submission of data to the MNR is undertaken through a web portal. JNCC run thorough quality assurance procedures to ensure marine industries are correctly reporting all required data to the MNR. Specifics of the reported data include location, dates, characteristics of the source (e.g. maximum airgun volume, maximum hammer energy, weight of explosive), and acoustic properties of the noise (e.g. frequency, sound pressure level and sound exposure level). Where the activities producing noise are carried out under licence, regulators require that those data are reported, so there is high confidence that they are reported. Some activities that produce impulsive noise do not always require a licence and so there will not be regulatory control of reporting. For these activities (i.e. high resolution geophysical surveys) the completeness of the dataset is unknown.
The information reported in this assessment is relatively simple (i.e. a count of days that noisy activity was reported within each UKCS block; known as pulse-block-days). However, this also means that relatively little detail of the activity is recorded, and the spatial scale of the data is coarse. For example, the geographical scale of the data is at the level of the UKCS block (10 minutes latitude by 12 minutes longitude), which is approx. 18.5 x 12 km in the northern North Sea. Also, the sound source level (or proxy for this such as hammer energy, airgun volume) reported is sometimes the maximum used, which is likely to overestimate the average level.
Where activities are not regulated by licence, there may be reporting omissions; however there are no other known systemic spatial or temporal gaps in reporting of data from Scottish waters to the MNR.
Results
Impulsive noise was not assessed in the 2011 Atlas (Baxter et al., 2011). This is the first assessment of impulsive noise in Scottish waters. The assessment covers the entire Scottish marine area, due to the coarse spatial scale of reporting of data to the MNR. It is also not appropriate to examine inter-annual variability or trends, as there is such a great degree of variability in location and intensity between years.
Preliminary results illustrate that across the Scottish marine area, the distribution of impulsive noise PBD was generally clustered. Some blocks had high numbers of PBD, some had very low numbers of PBD and a considerable proportion had no PBD at all.
2015 (Figure 2) had the highest percentage of blocks in the Scottish marine area with impulsive noise activity (38% of all blocks). This was much lower in 2016 (8%) and 2017 (8%).
Across all years, the activity making the greatest contribution to PBD was seismic survey (78.9%), followed by sub-bottom profilers (16.8%) (Table 1). The remaining 4.3% of PBD were attributable to piling, explosives, Ministry of Defence activity, multi-beam echo-sounders and the use of acoustic deterrent devices (ADD) as a noise mitigation tool.
During the years 2015-2017, 88.7% of PBD across all UK waters occurred in the Scottish marine area. The dominant cause of PBD in Scottish waters was seismic survey activity, with 86.9% of UK seismic survey PBD taking place in Scottish waters.
The UKCS blocks with the highest rates of activity were generally concentrated in Scottish/Offshore Marine Regions where oil and gas exploration (e.g. Long Forties, Fladen and Moray Firth Offshore, East Shetland Shelf, North and West Shetland Shelf; seismic survey) and offshore renewable energy construction (e.g. Moray Firth; pile driving) was taking place (Figure 2). The majority of activity was clustered around oil and gas exploration prospects in the east of the Scottish North Sea area.
Off western Scotland, the majority of PBD were attributable to seismic surveys occurring in deeper offshore waters (Hebrides Shelf, Rockall, Bailey, North Scotland Shelf).
The large areas with small numbers of PBD in 2015 and 2016 were mainly related to three wide ranging seismic surveys commissioned by the UK Oil and Gas Authority.
As previously described, several types of activity contribute to the impulsive noise, but by far the most common was seismic surveys (using loud sounds generated by airguns to profile the rocks below the sea floor), followed by sub bottom profiling (using sound to survey seabed sediments). Both of these activities are primarily associated with the oil and gas industry.
Piling occurred at several sites, notably in the Clyde and Moray Firth SMRs. ADDs were used to mitigate risk of injury to marine mammals at these construction sites.
|
|
Acoustic deterrent devices
|
Explosives
|
Military
|
Multi-beam echo sounder
|
Piling
|
Seismic surveys
|
Sub-bottom profilers
|
|
2015
|
0.0 %
|
0.0 %
|
0.0 %
|
0.0 %
|
0.0 %
|
83.3 %
|
16.7 %
|
|
2016
|
0.4 %
|
0.0 %
|
3.7 %
|
0.0 %
|
1.8 %
|
77.5 %
|
16.5 %
|
|
2017
|
4.7 %
|
0.6 %
|
0.8 %
|
0.3 %
|
6.0 %
|
70.4 %
|
17.2 %
|
|
Total PBD
|
1.1%
|
0.1%
|
1.2%
|
0.1%
|
1.8%
|
78.9%
|
16.8%
|
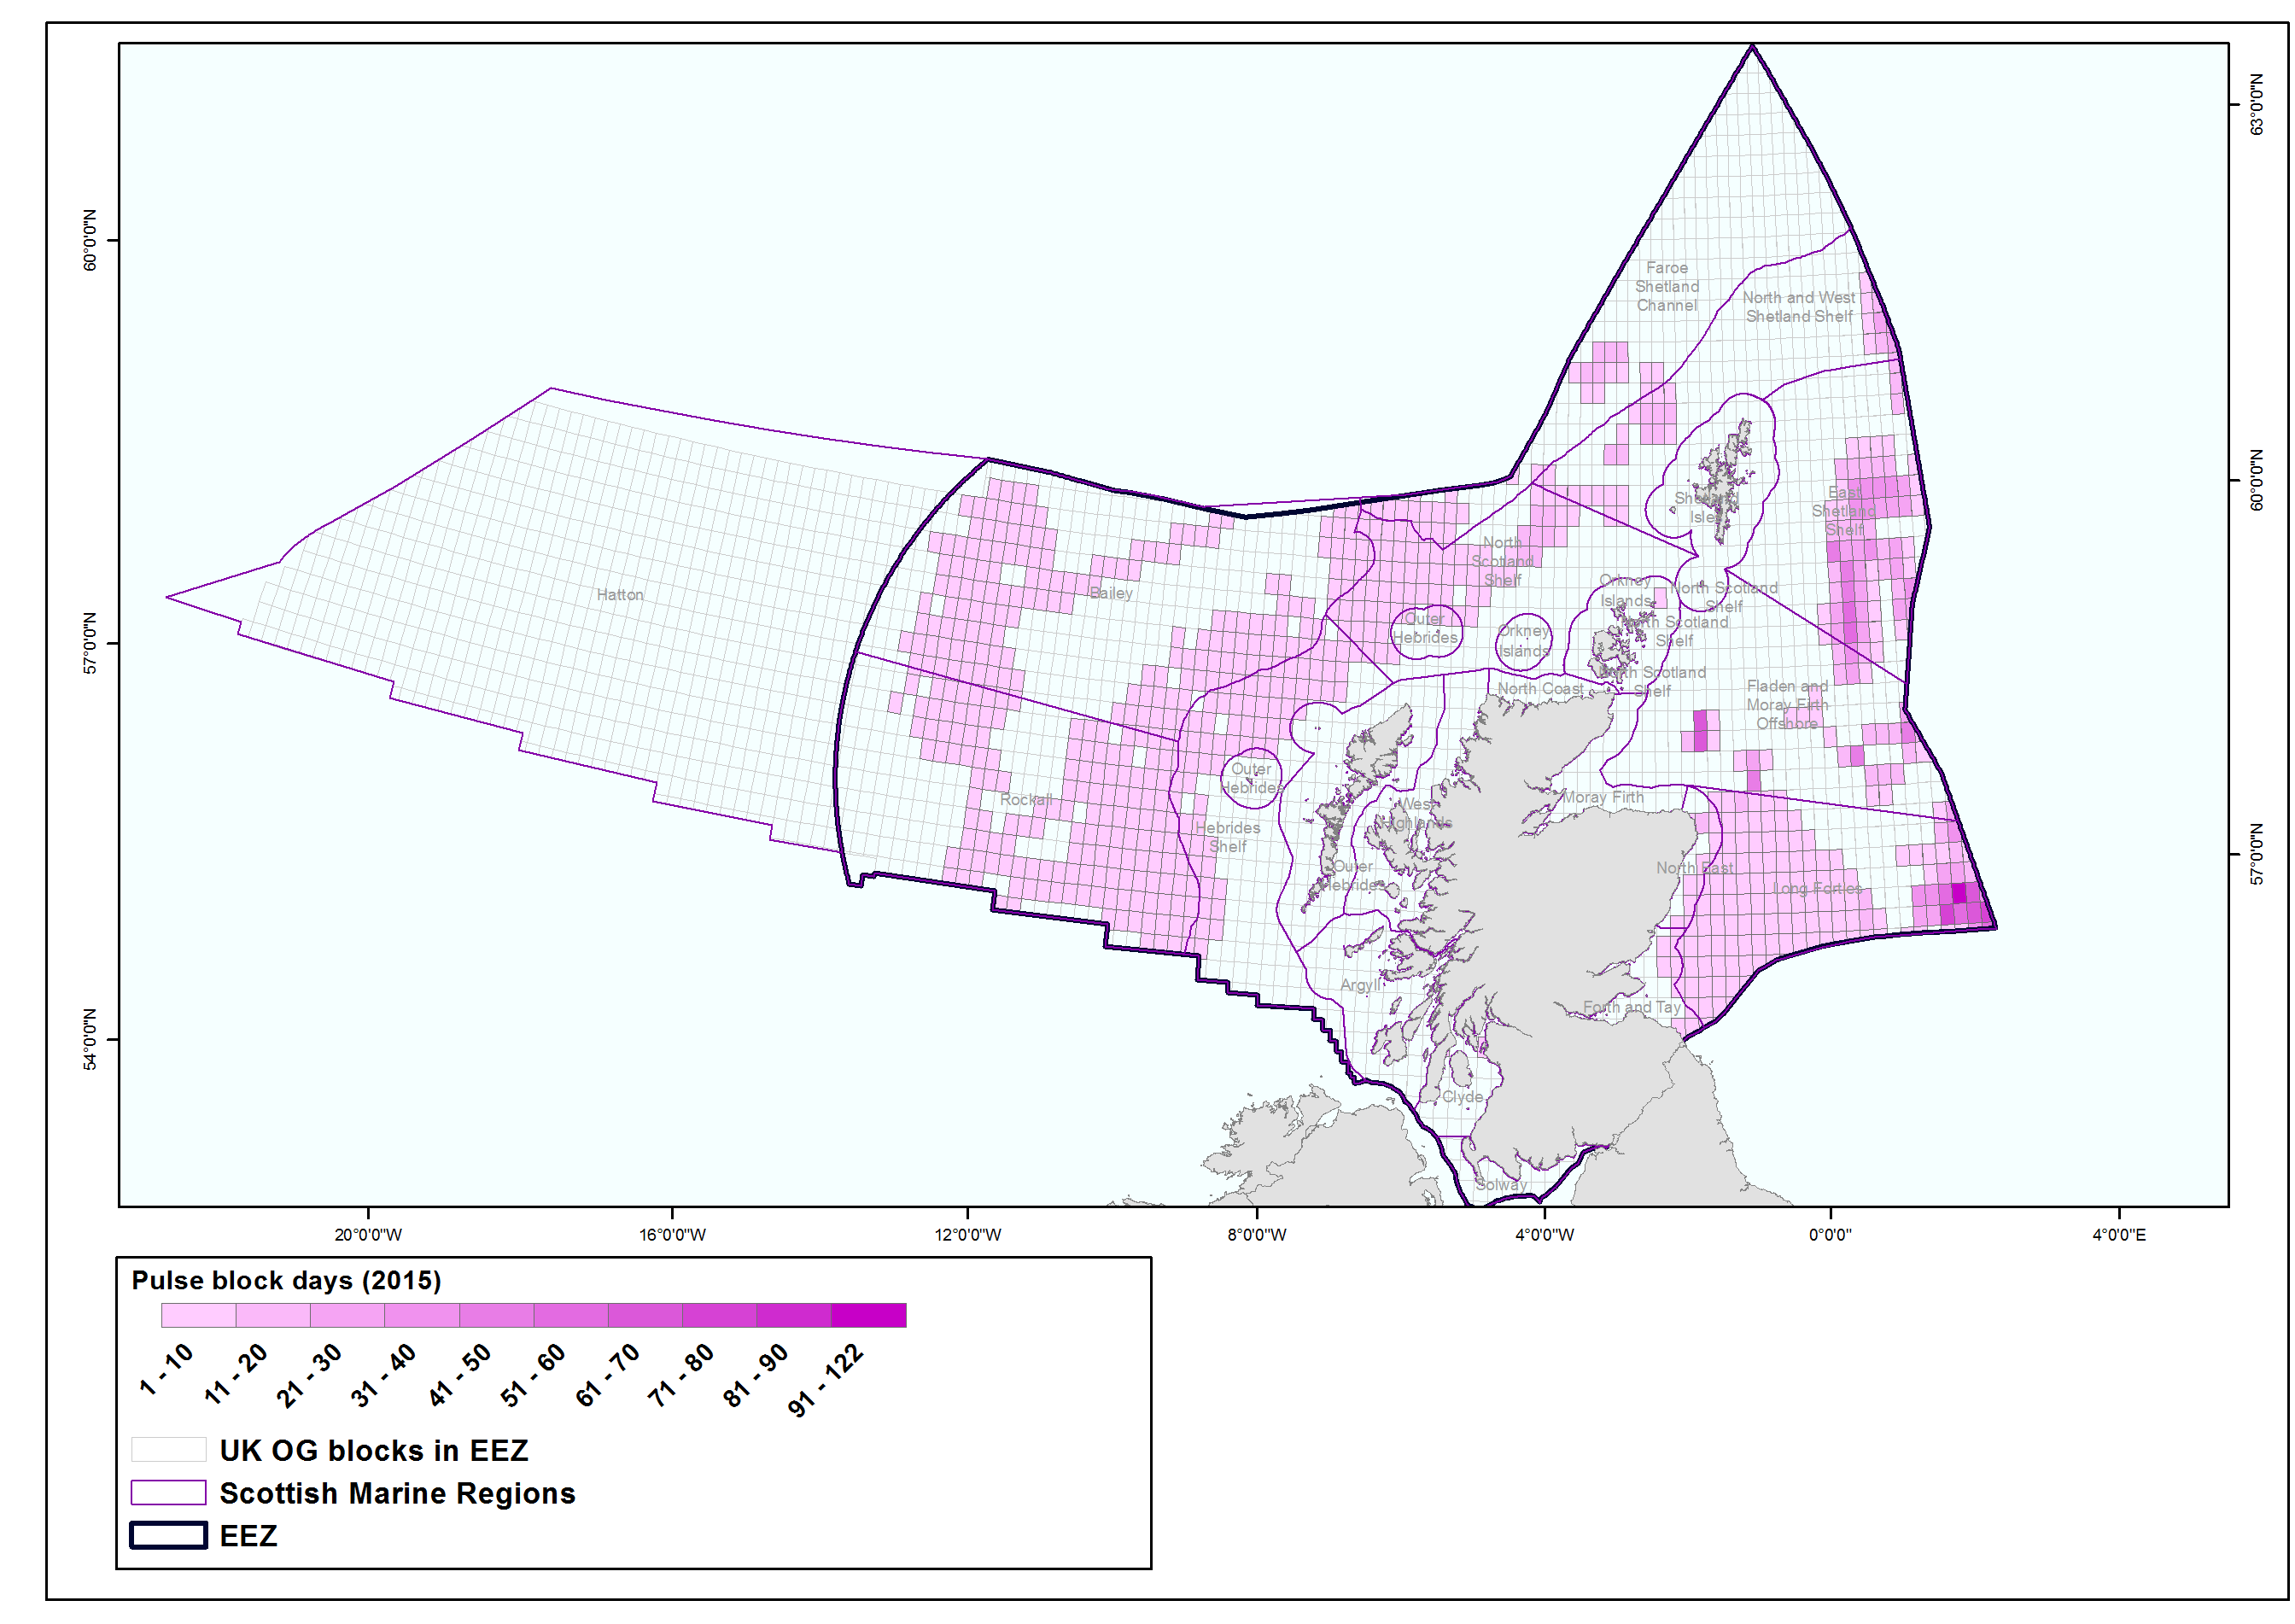
Figure 2: Distribution of pulse block days in each UKCS block in 2015. Scottish Marine Regions and Offshore Marine Regions also shown. Source: Marine Noise Registry.
Prior to 2015, activities generating impulsive noise were not routinely reported and recorded because the MNR is a recent development initiated by the UK Marine Strategy 2012, through UK obligations to the EU MSFD. Tables a and b show the MNR summary statistics for 2015 to 2017, including activity type and the proportion of total UK activity occurring in Scottish waters. The percentage of blocks in the Scottish marine area experiencing impulsive noise activity for 2016 and 2017 is shown in Figs a & b.
|
|
2015
|
2016
|
2017
|
Average 2015-2017
|
|
Highest number of days that noise activity was experienced in a single block
|
99
|
53
|
101
|
N/A
|
|
Percentage of UKCS blocks that experienced noise activity
|
38%
|
8%
|
8%
|
16%
|
|
Percentage of blocks (with noise) that experienced less than 5 days of noise activity
|
69%
|
41%
|
37%
|
60%
|
|
|
Sum of PBD 2015-2017
|
ADD PBD
|
Explosives PBD
|
MoD PBD
|
MBE PBD
|
Piling PBD
|
Seismic Survey PBD
|
Sub-bottom Profilers PBD
|
|
UK
|
14,512
|
186
|
51
|
831
|
12
|
493
|
10,393
|
2,546
|
|
Scotland
|
11,053
|
122
|
14
|
138
|
6
|
196
|
8,722
|
1,855
|
|
(Sco/UK)*100
|
76.2%
|
65.6%
|
27.5%
|
16.6%
|
50.0%
|
39.8%
|
83.9%
|
72.9%
|
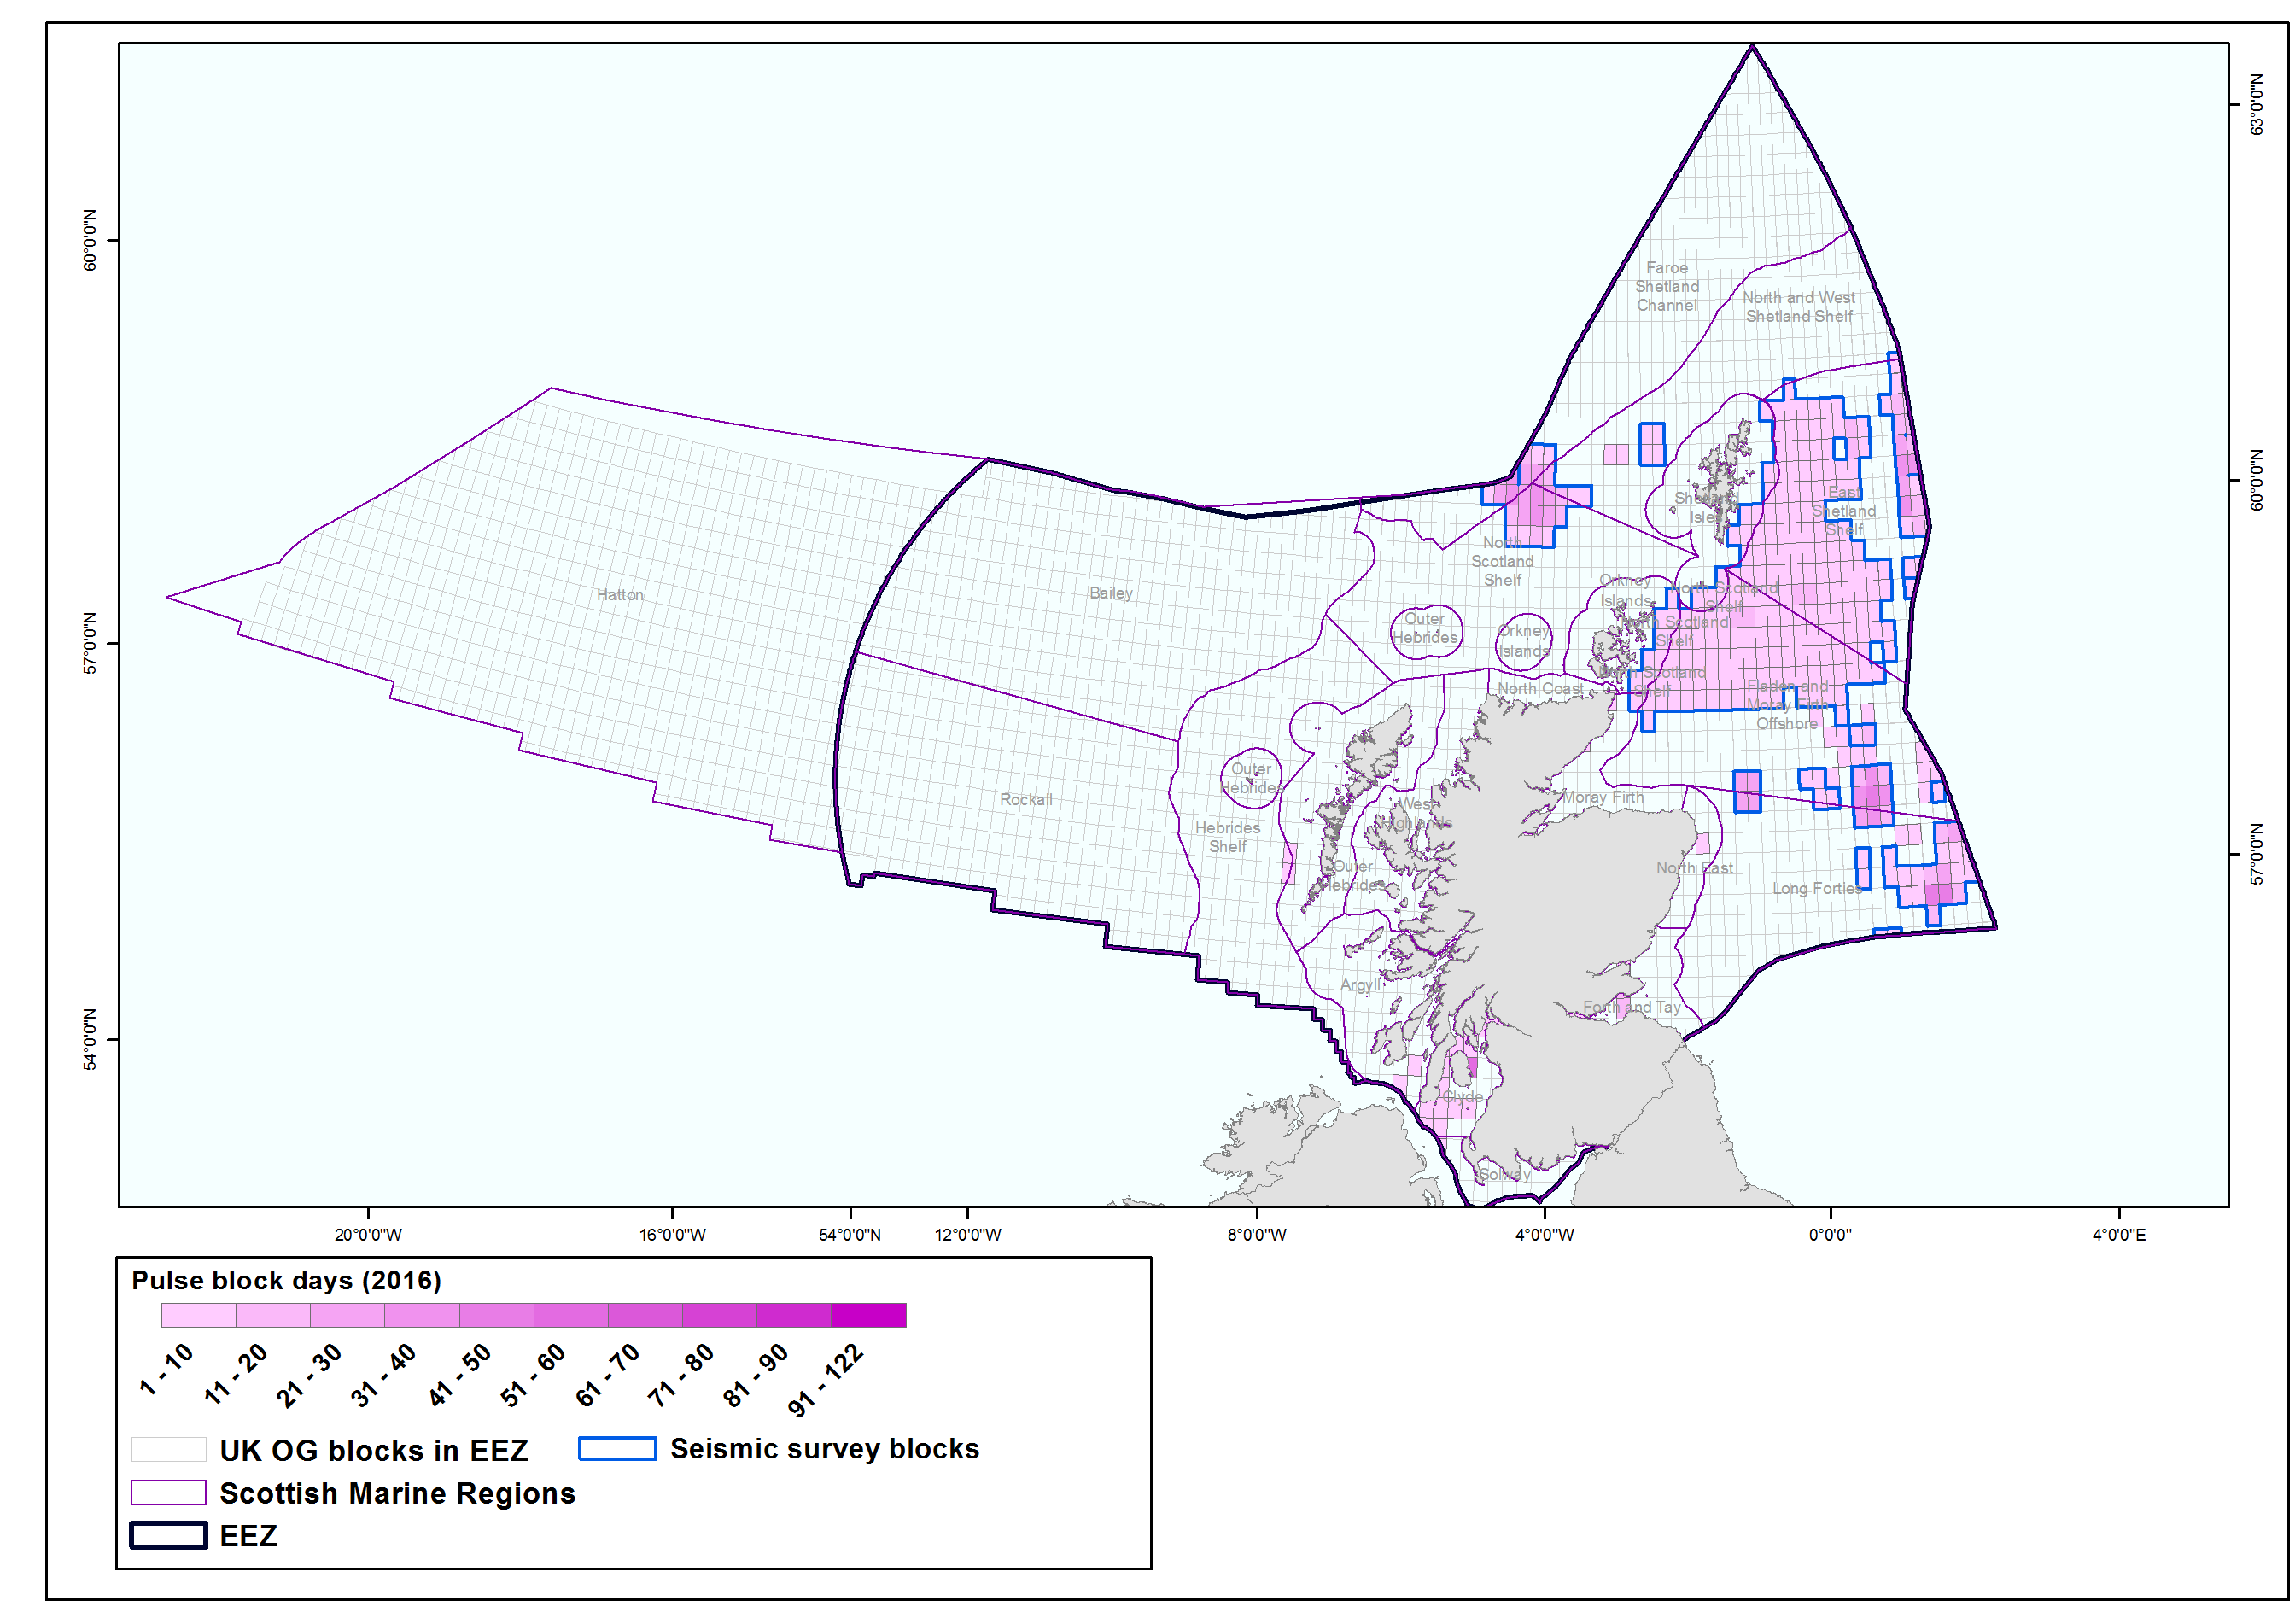
Figure a: Distribution of pulse block days in the Scottish marine area in 2016. Source: Marine Noise Registry.
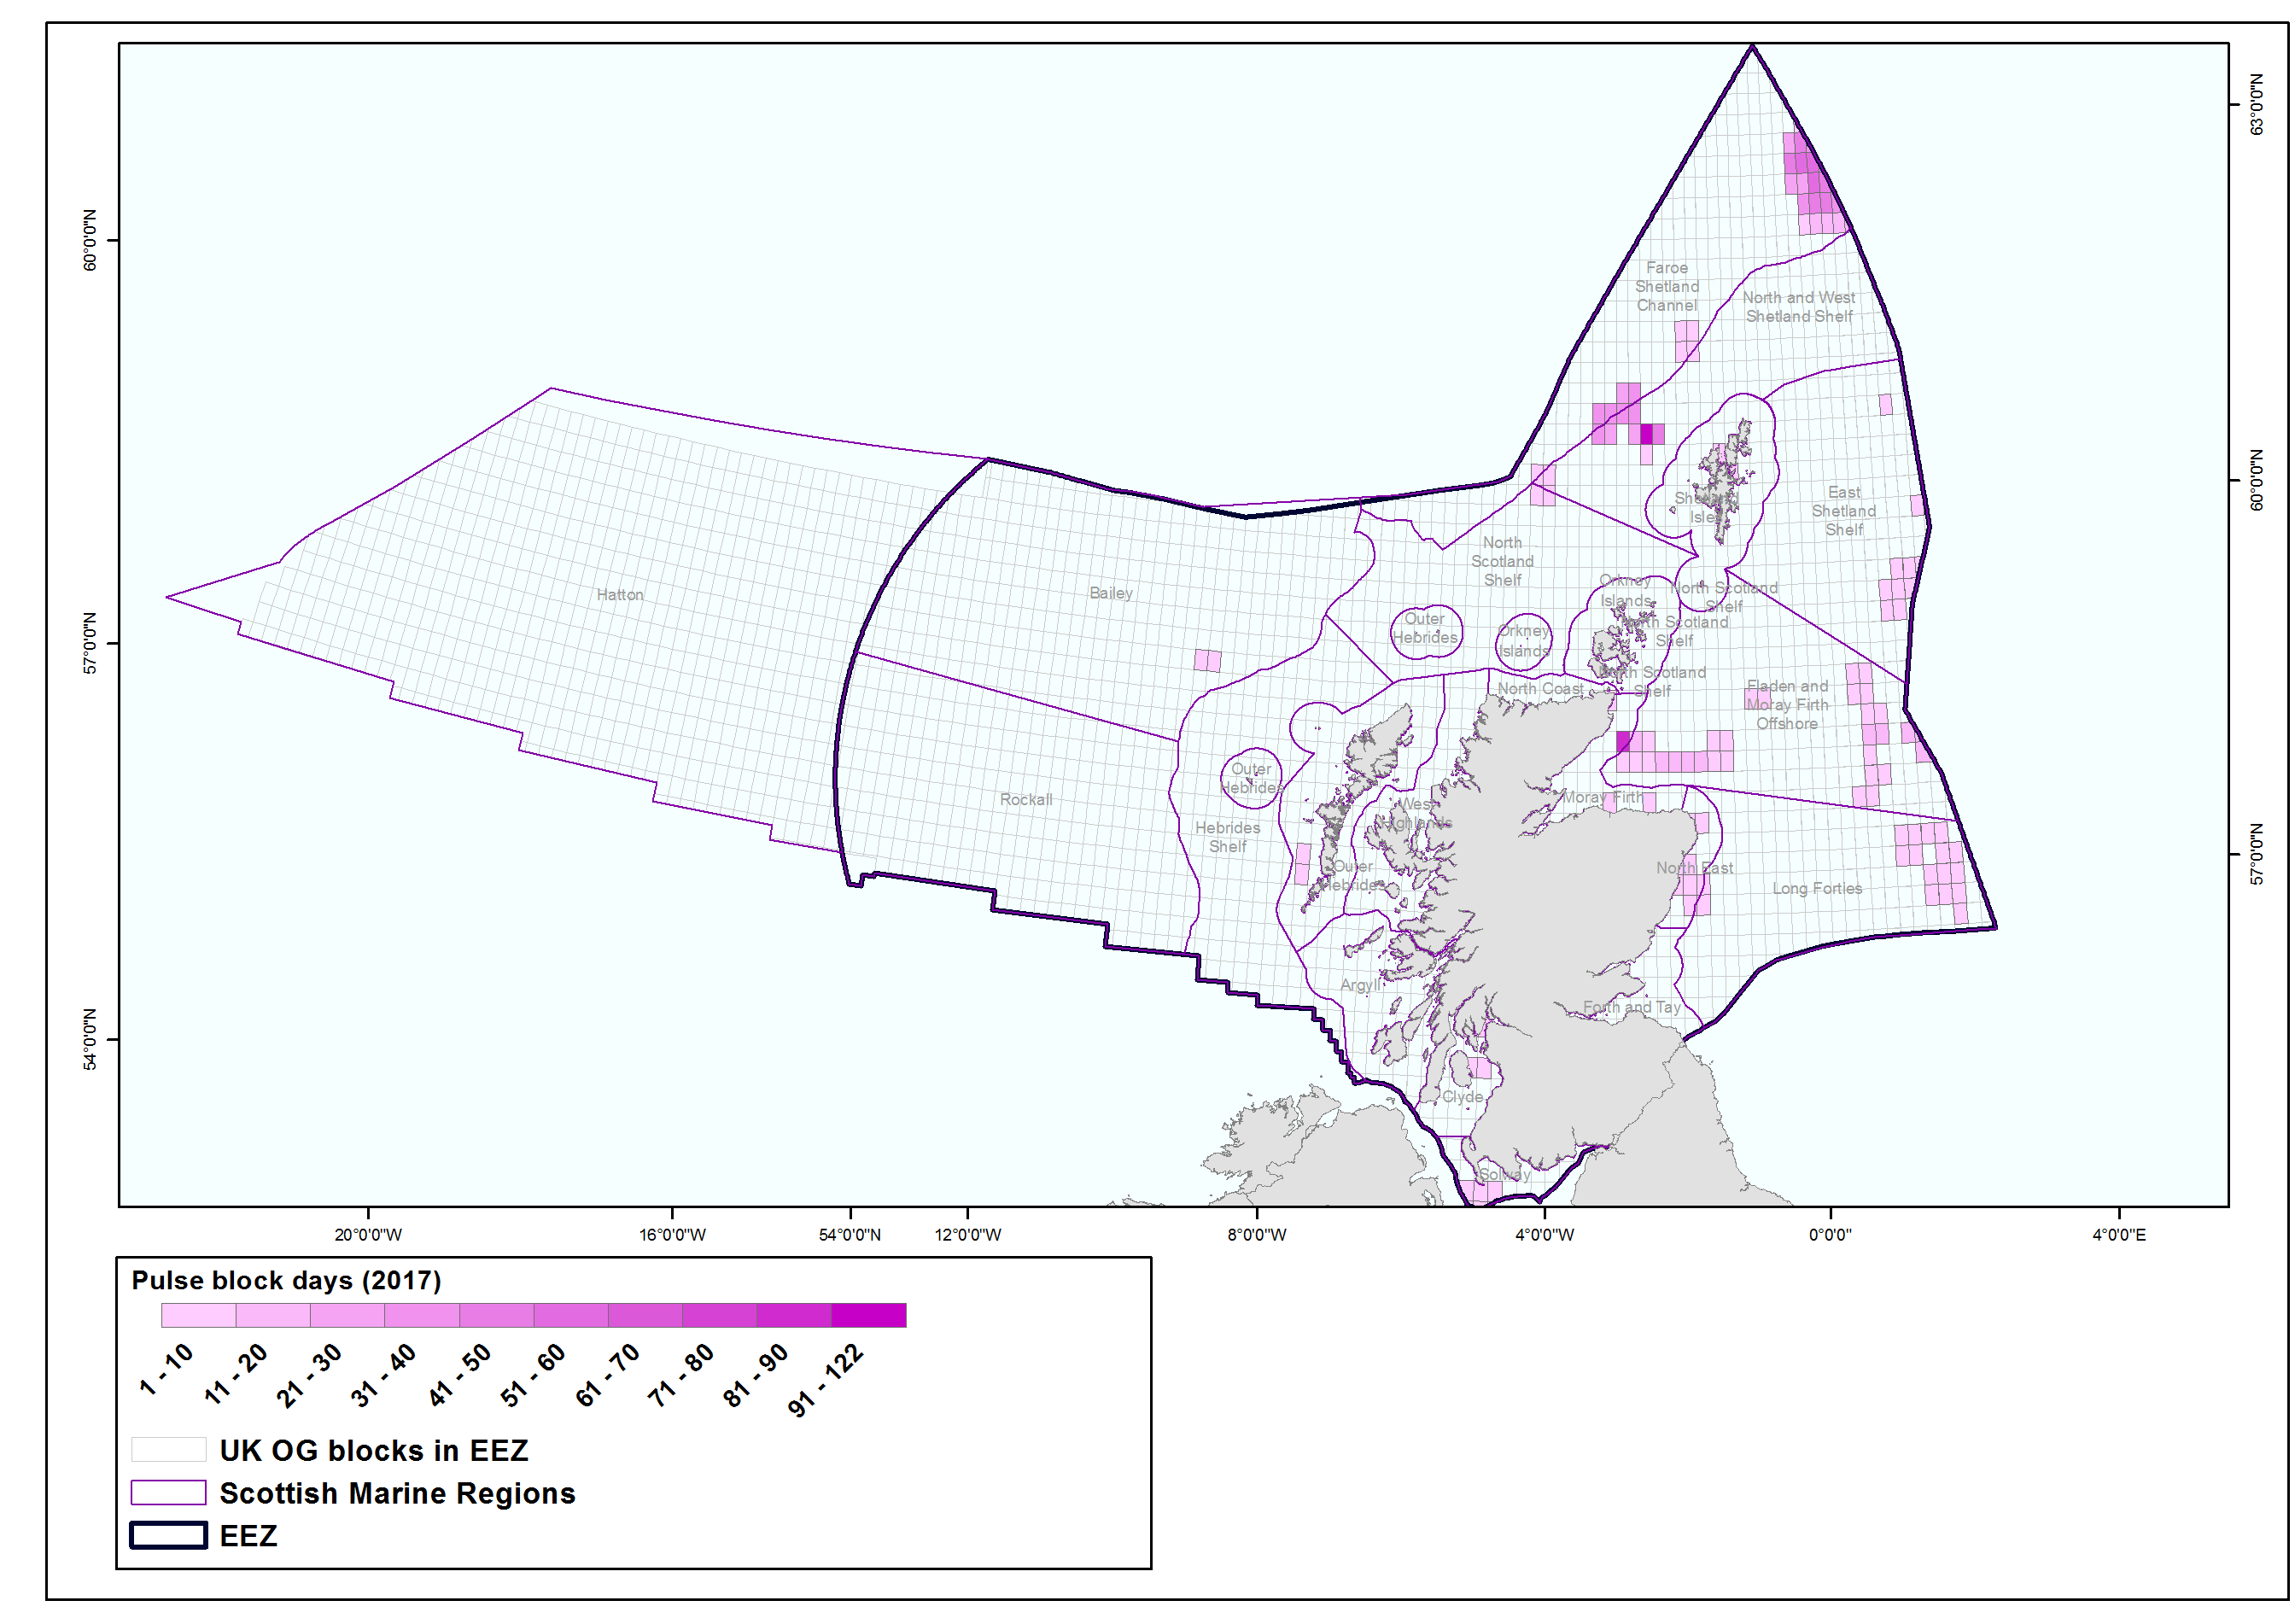
Figure b: Distribution of pulse block days in the Scottish marine area in 2017. Source: Marine Noise Registry.
Conclusion
This is the first Scottish assessment of impulsive noise. It provides a baseline for 2015 to 2017. It does not demonstrate a status or trend assessment.
This assessment illustrates that impulsive noise in the marine environment was highly variable both in location and between years. It depends largely on industrial developments and surveys that are taking place each year. There was a large proportion of UKCS blocks (spatial measuring unit) with no impulsive noise events, or a small number of days with impulsive noise. There were, however, clusters of activity in every year with a small number of blocks having had a relatively high number of days with impulsive noise.
Some activities were common in certain areas, e.g. seismic surveys in areas thought to host oil and gas reserves, and pile driving during the construction of offshore wind farms in the North Sea, but these activities are unlikely to be restricted to these areas in future years. In the five years 2019 to 2024, offshore wind farm construction is due to continue. Some of this construction work is likely to use impact pile driving, which will increase the levels of impulsive noise in regions such as the Moray Firth and Forth and Tay.
Knowledge gaps
The coarse spatial scale of reporting of data to the MNR means that it has not been possible to assess spatio-temporal variability in impulsive noise.
There is a substantial knowledge gap surrounding impulsive noise for unlicensed activities. For example, there are some geophysical acoustic surveys which do not require licensing, so there is no regulatory control over whether data are submitted to the MNR.
Whilst the MNR enables an assessment of the occurrence of the impulsive noise pressure, there is uncertainty around the magnitude and extent of disturbance and displacement effects caused by that pressure and any impacts at the affected species population level. Work is underway through the OSPAR Intersessional Correspondence Group on Underwater Noise to establish indicators of the risk of impact of the noise pressure on marine wildlife, and the subsequent establishment of threshold values for that indicator. There is very little regulatory control over reporting of data to the MNR for activities that do not require licensing.
There are some primary caveats associated with data from the MNR. These are available to read in more detail in the JNCC report Caveats and limitations of Marine Noise Registry Outputs (JNCC, 2018).
Status and trend assessment
The assessment carried out is of the occurrence of the pressure from impulsive noise. Since thresholds have not been determined for the effect of this pressure to marine species, a traffic light assessment has not been carried out.
This Legend block contains the key for the status and trend assessment, the confidence assessment and the assessment regions (SMRs and OMRs or other regions used). More information on the various regions used in SMA2020 is available on the Assessment processes and methods page.
Status and trend assessment
|
Status assessment
(for Clean and safe, Healthy and biologically diverse assessments)
|
Trend assessment
(for Clean and safe, Healthy and biologically diverse and Productive assessments)
|
||
|---|---|---|---|
 |
Many concerns |
No / little change |
|
 |
Some concerns |
Increasing |
|
 |
Few or no concerns |
Decreasing |
|
 |
Few or no concerns, but some local concerns |
No trend discernible |
|
 |
Few or no concerns, but many local concerns |
All trends | |
 |
Some concerns, but many local concerns |
||
 |
Lack of evidence / robust assessment criteria |
||
| Lack of regional evidence / robust assessment criteria, but no or few concerns for some local areas | |||
 |
Lack of regional evidence / robust assessment criteria, but some concerns for some local areas | ||
| Lack of regional evidence / robust assessment criteria, but many concerns for some local areas | |||
Confidence assessment
|
Symbol |
Confidence rating |
|---|---|
|
Low |
|
|
Medium |
|
|
High |

Assessment regions
 and the Scottish Offshore Marine Regions (OMRs, O1 – O10)")
Key: S1, Forth and Tay; S2, North East; S3, Moray Firth; S4 Orkney Islands, S5, Shetland Isles; S6, North Coast; S7, West Highlands; S8, Outer Hebrides; S9, Argyll; S10, Clyde; S11, Solway; O1, Long Forties, O2, Fladen and Moray Firth Offshore; O3, East Shetland Shelf; O4, North and West Shetland Shelf; O5, Faroe-Shetland Channel; O6, North Scotland Shelf; O7, Hebrides Shelf; O8, Bailey; O9, Rockall; O10, Hatton.
 Regions. These have been used as the assessment areas for hazardous substances.")
, Regions.")