
Background
Heavy metals have the potential to impact on an organism's activity, growth, metabolism, reproduction and overall chance of survival. Mercury (Hg), cadmium (Cd) and lead (Pb) are on OSPAR’s list for priority action and are priority substances in the Water Framework Directive (European Commission, 2001) because of their high toxicity in the marine environment and, for mercury and cadmium, their potential to accumulate up the food chain.
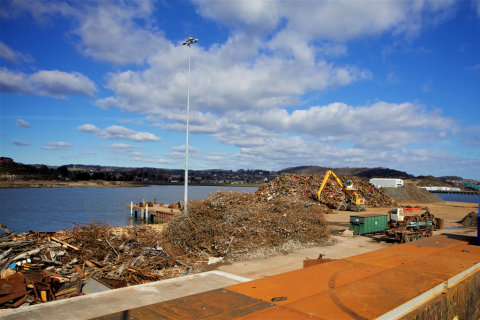
Metals are released into the marine environment from both anthropogenic and natural inputs. They are derived from a number of sources including natural sources (e.g. volcanoes, forest fires, geological processes), industrial processes (e.g. smelting, fossil fuel combustion, mining, metal recycling (Figure 1)), agricultural processes (e.g. fertilisers), and can be transported bound to fine particles in the atmosphere and in water. The main anthropogenic inputs of mercury are from fossil fuel combustion, metal production and cement production.
Due to their persistence, their potential to accumulate and their toxicity, monitoring of heavy metals (Cd, Hg and Pb) inputs into the marine environment is part of the OSPAR Riverine Inputs and Direct Discharge (RID) programme. To fulfil these commitments, monitoring is undertaken by the Scottish Environment Protection Agency (SEPA) of inputs of these three metals from riverine sources, as well as direct inputs (sewage and trade effluent), into the marine environment (Figure 1).
This assessment presents data on the input of these metals into each Scottish Marine Region (SMR) from 2007 - 2017.

Mercury is one of the most toxic metals to marine life and can be transformed by biochemical and biological reactions into more toxic organic compounds (e.g. methyl mercury). Both neuro- and nephrotoxicity have been associated with acute methylmercury poisoning incidents in humans, and neurotoxicity, particularly in the developing fetus, has been associated with lower level chronic exposures (Mergler et al., 2007; Scheuhammer, Meyer, Sandheinrich & Murray, 2007; Sheehan et al., 2014).
Inputs of Cd to the marine environment include natural sources, such as from volcanic activity. Anthropogenic inputs include non-ferrous metal mining and smelting, batteries and the use of phosphate fertilizers.
Inputs of lead to the environment include non-ferrous metal mining and smelting, batteries and shooting/fishing.
The assessment methodology covers three aquatic sources of lead, cadmium and mercury. Sewage inputs are annual inputs from sewage treatment work effluents directly into the marine environment. Trade effluent inputs are total annual inputs from industrial effluent directly to the marine environment. Riverine inputs are the total annual inputs from the rivers that drain into each marine region, they include upstream sewage and trade effluents.
In Scotland, metal concentrations are measured by SEPA to fulfil the requirements of the OSPAR Riverine Inputs and Direct Discharges (RID) monitoring programme. Samples are collected from above the tidal limit of major rivers on a monthly basis. These data are combined with gauged flow data to derive a total annual input for each metal. Where gauged flow data are not available, flow is modelled using an areal weight approach or using the Low Flows Enterprise model (Young, Grew & Holmes, 2003).
Monitoring of metals at these sites has been reviewed and altered twice over the assessment period (2010 and 2015), with some sites being monitored at reduced levels after review (1 in 3 year monitoring from annual monitoring) where results are well below the Environmental Quality Standard (EQS). Therefore, for the years where data are not available, concentrations are extrapolated from the last year where data are available as per OSPAR RID principles (OSPAR, 2014). Where results are below the analytical limit of detection (LOD), half the LOD is assigned as the value.
A similar approach is taken with direct sewage and trade effluent discharges to the marine environment where concentration and concurrent flow data are used to calculate an annual input.
Data are available from 1990 – 2017. However, the dataset is less complete before 2007 for direct sewage and trade discharges. Therefore, the assessment only considers data from 2007-2017.
Atmospheric deposition is modelled as part of the European Monitoring and Evaluation Programme (EMEP). These data are reported on a regional sea scale (Greater North Sea and Celtic Seas in Scotland). Therefore, it is not possible to include these data in this assessment at the SMR scale.
Riverine data are collected for major rivers as per OSPAR RID guidelines, which define that 80% of a country's riverine flows should be captured by monitoring. In terms of the SMRs, this means that for some of the regions that cover the West Coast and the Islands there are no river data available. The source apportionment results should therefore be interpreted within this context.
Results
There is no status assessment for metal inputs into the marine environment as there are no regionally set assessment thresholds.
The highest total inputs for all three metals were generally found in the regions that drain the largest urban areas. These included the Clyde, Forth and Tay, North East and Moray regions (Figure 1). Total inputs in more sparsely populated regions were often an order of magnitude lower e.g. North Coast, Outer Hebrides and Orkney Islands. A more detailed breakdown of these results, with source apportionment, is presented in the extended results.
Riverine Input Trend Assessment
At most sites there were no significant trends in metals, with inputs from aquatic sources being relatively stable over the period 2007 - 2017. These results reflect assessments at larger scales e.g. Marine Strategy Framework Directive (MSFD) assessment 2018 (UKMMAS, 2019) and OSPAR Intermediate Assessment 2017 (OSPAR, 2017).
There were a small number of significant trends, both increasing and decreasing, in some of the SMRs. In general, significant trends are observed in SMRs with the lowest metal inputs.
For cadmium, there was a significant decreasing trend in Argyll and a significant increasing trend in the Orkney Islands. The trend in Argyll is non-linear and driven by higher inputs in 2007 and 2008 from a sewage source. The increasing trend in the Orkney Islands SMR is linear (Figure 2) and related to a trade effluent source (extended results).
. Note different scales on the Y axis to show trend.")
For lead, only the North Coast had a significant decreasing trend (Figure 3), which is related to decreasing river inputs (extended results).

For mercury inputs to the marine environment, there were three SMRs with statistically significant increasing trends: West Highlands, Moray Firth and the North East region. Figure 4 shows that these trends are linear.

In the SMRs where there are no significant trends, there are sometimes years that have higher metal inputs than others, even after flow normalisation (corrected to river flow) e.g. 2014 in the Moray Firth and West Highlands. The riverine input calculation includes all upstream sources of metals, so the likely sources of these higher metal inputs are not clear from this analysis.
It has not been possible to assess atmospheric inputs of metals to each SMR due to the scale of the assessment methodology. Results from the MSFD assessment show that for all three metals, atmospheric inputs represent the greatest input to the Greater North Sea (GNS) region. This is particularly the case for mercury, with around 15 times more mercury coming from atmospheric deposition than riverine sources. The MSFD assessment shows that, in general, trends from atmospheric sources have stabilised since a decline in the 1990s.
Source Apportionment
The total input per SMR can be apportioned into riverine, sewage and trade sources. Figures a, b and c detail the source apportionment for cadmium, lead and mercury respectively for each region. In regions where data are available, the riverine input dominates out of the three sources. A few exceptions to this are some years in the Clyde, Forth and Tay and North East where sewage inputs contribute a relatively high mercury input compared to other years and regions.
In the regions where no riverine data exists, sewage inputs tend to dominate for all metals with the exception of the Orkney Islands, where trade effluent is the main source.
In addition, it has not been possible to get atmospheric deposition data for each SMR, which has been shown to be a more significant source of metals than riverine inputs and direct discharges sources in other assessments, e.g. MSFD assessment 2018 and OSPAR Intermediate Assessment 2017.


Confidence in results
Confidence in these results is medium-low for a number of different reasons. Monitoring of metals at these sites has been reviewed and altered twice over the assessment period (2010 and 2015), with some sites monitored at a reduced level following review (a 1 in 3 year monitoring regime rather than annual monitoring). Data from missing years were extrapolated from the previous year's data, which is likely to smooth any between year variability in metal concentrations.
Likewise, flow data were not available for some sites, which required the use of modelling to fill gaps. There was a large number of samples with concentrations below the limit of detection (LOD) (61% of river samples for cadmium, 33% of river samples for lead and 82% of river samples for mercury across the dataset). In these instances, concentrations were estimated by halving the LOD, which may lead to potential overestimation or underestimation of actual concentrations and inputs.
The review of the monitoring network that led to reduced monitoring frequency was based on a risk assessment, with monitoring frequency dropped at sites with low metal concentrations. In addition, the SEPA laboratory conforms to ISO 17025, is UKAS accredited and participates in the AQUACHECK proficiency testing scheme. There is therefore high confidence in the quality of the sample analysis.
For these reasons the confidence in the assessment is medium-low.
Change since 2011
Scotland’s Marine Atlas (Baxter et al., 2011) assessed regional inputs in copper, zinc and lead from 1990 - 2008, and total inputs of a number of other metals including arsenic, chromium, nickel, cadmium and mercury from 2005 - 2009. This assessment assesses the hazardous metals cadmium, lead and mercury as per OSPAR and MSFD. The Marine Atlas (Baxter et al., 2011) showed an initial decline in lead inputs, following the restriction on lead in fuel in 1988, and then a stabilisation of inputs across most regions since 2000.
This new assessment demonstrates continued stability with some inter-annual fluctuations and one area with decreasing trend (North Coast). Cadmium and mercury inputs in this assessment cannot be compared to the 2011 assessment where inputs were aggregated nationally.
Conclusion
Aside from year to year fluctuations, metal inputs to the SMRs were relatively stable over the period assessed (2007 - 2017). These results fit with results from assessments at larger scales e.g. OSPAR Intermediate Assessment (2017) and MSFD assessment (2018).
There were a small number of significant increasing and decreasing trends in some of the SMRs across all three metals. These appear to be related to localised issues with no single source type driving all of the trends.
This assessment must be considered within the context of relatively high uncertainties around the input calculations. In addition, there are data gaps for some years, including riverine concentration data, and therefore data were extrapolated for the purpose of the assessment. Atmospheric deposition data were not available at the SMR geographic scale. Confidence in this assessment is therefore medium-low.
Knowledge gaps
Metal input information was only available from riverine sources where data were collected by SEPA. This aims to represent 80% of major river flows. Whilst this strives to capture the majority of riverine input entering the marine environment, there are no riverine data in some SMRs.
In addition, it was not possible to ascertain atmospheric deposition data at the SMR scale as the EMEP models present data at the regional sea scale (Greater North Sea and Celtic Seas in Scotland). This presents a major gap as the OSPAR and MSFD assessments have shown atmospheric deposition to be the largest source of some of these metals.
A large proportion of river results were below the limit of detection for all three metals assessed (61% of cadmium samples, 33% of lead samples and 82% of mercury samples). If more certainty is required in understanding riverine metal inputs where riverine concentrations are low, greater analytical sensitivity is required.
Status and trend assessment
The other indicators that contribute to the overall hazardous substances assessment have been conducted at the scale of the four Scottish biogeographic regions. As the metal inputs assessment has been undertaken at the SMR scale, separate traffic light assessments have been produced.
|
Region assessed |
Status with confidence |
Trend with confidence |
|---|---|---|
|
Argyll |
 |
Cadmium
|
|
Clyde |
|
|
|
Forth and Tay |
|
|
|
Moray Firth |
|
Mercury
|
|
North Coast |
|
Lead
|
|
North East |
|
Mercury
|
|
Orkney Islands |
|
Cadmium
|
|
Outer Hebrides |
|
|
|
Shetland Isles |
|
|
|
Solway |
|
|
|
Western Islands |
|
Mercury
|
This Legend block contains the key for the status and trend assessment, the confidence assessment and the assessment regions (SMRs and OMRs or other regions used). More information on the various regions used in SMA2020 is available on the Assessment processes and methods page.
Status and trend assessment
|
Status assessment
(for Clean and safe, Healthy and biologically diverse assessments)
|
Trend assessment
(for Clean and safe, Healthy and biologically diverse and Productive assessments)
|
||
|---|---|---|---|
 |
Many concerns |
No / little change |
|
 |
Some concerns |
Increasing |
|
 |
Few or no concerns |
Decreasing |
|
 |
Few or no concerns, but some local concerns |
No trend discernible |
|
 |
Few or no concerns, but many local concerns |
All trends | |
 |
Some concerns, but many local concerns |
||
| |
Lack of evidence / robust assessment criteria |
||
| Lack of regional evidence / robust assessment criteria, but no or few concerns for some local areas | |||
 |
Lack of regional evidence / robust assessment criteria, but some concerns for some local areas | ||
| Lack of regional evidence / robust assessment criteria, but many concerns for some local areas | |||
Confidence assessment
|
Symbol |
Confidence rating |
|---|---|
|
Low |
|
|
Medium |
|
|
High |

Assessment regions
 and the Scottish Offshore Marine Regions (OMRs, O1 – O10)")
Key: S1, Forth and Tay; S2, North East; S3, Moray Firth; S4 Orkney Islands, S5, Shetland Isles; S6, North Coast; S7, West Highlands; S8, Outer Hebrides; S9, Argyll; S10, Clyde; S11, Solway; O1, Long Forties, O2, Fladen and Moray Firth Offshore; O3, East Shetland Shelf; O4, North and West Shetland Shelf; O5, Faroe-Shetland Channel; O6, North Scotland Shelf; O7, Hebrides Shelf; O8, Bailey; O9, Rockall; O10, Hatton.
 Regions. These have been used as the assessment areas for hazardous substances.")
, Regions.")