

Background
Assessment of fish communities in transitional waters (estuaries and reduced salinity sea lochs) is undertaken to determine the environmental quality of transitional water bodies supporting the fish communities. The fish community is one of several ecological elements assessed to provide an overall quality status of a water body. The Transitional water Fish Classification Index (TFCI) tool measures multiple aspects of the fish community structure and hence is an assessment of the ecological status (or health) of that community. The Water Framework Directive (WFD) programme includes monitoring at six representative estuaries, or transitional sea lochs (Figure 1): Clyde Estuary, Gareloch, Garnock Estuary (Clyde Scottish Marine Region (SMR)), Loch Eil (West Highlands SMR), Cromarty Firth (Moray Firth SMR) and Forth Estuary (Forth and Tay SMR).

The fish communities are sampled periodically using a multi-method sampling approach with different fishing gear. The aim is to sample different components of the fish community, including large and small fish, both in shallow or deeper water, and in inner and outer parts of the water body. The gear includes 2.5 m beam trawls, 1.5 m mini-beam trawls, littoral or sublittoral fyke nets and beach seine nets (Figure 2).
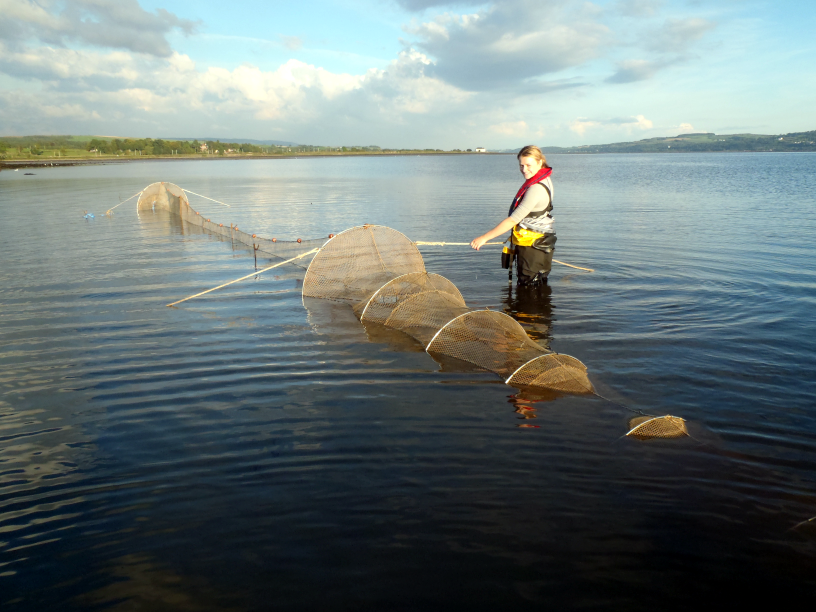
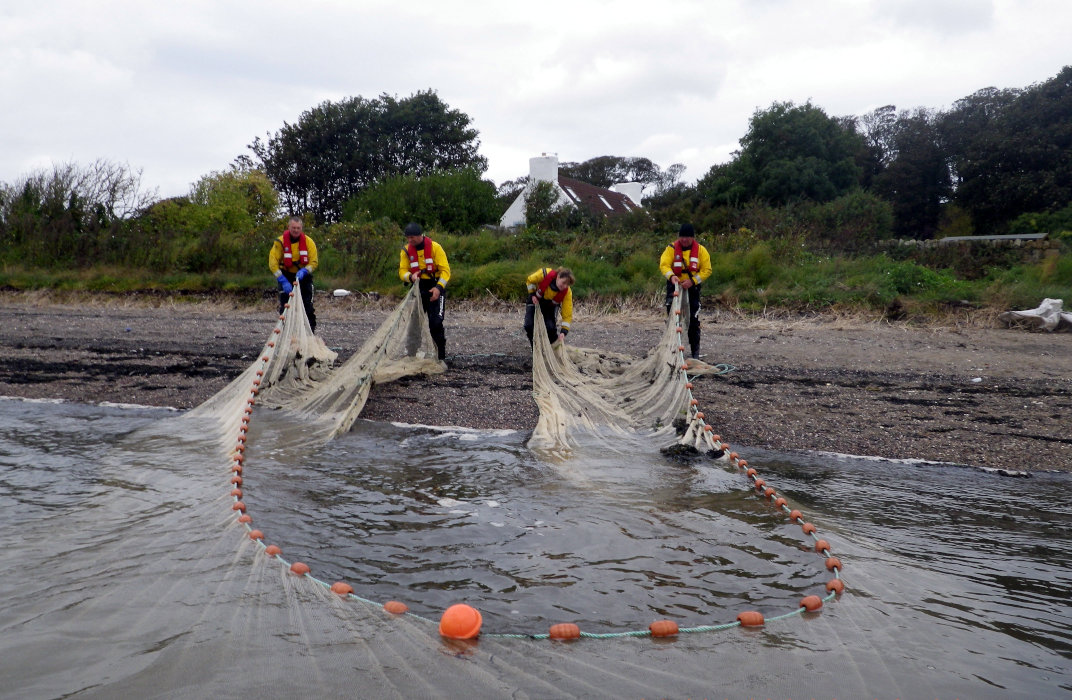
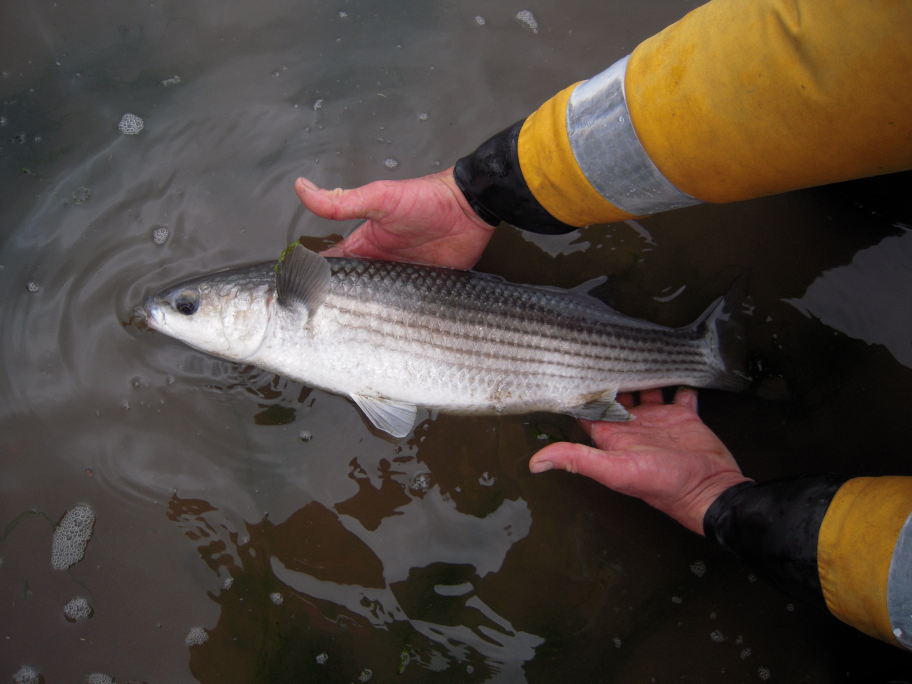
Figure 2: Setting fyke net (top), hauling beach seine net (middle) and releasing a grey mullet from a seine catch (bottom) © SEPA.
The TFCI uses measures of the diversity and abundance of the fish community composition to provide a classification of its quality status. The fish community is compared with predicted reference conditions, which describe the expected fish community structure where there is minimal disturbance by human activities (UKTAG, 2014). The TFCI provides an Environmental Quality Ratio (EQR) score, which places the water body within a quality classification such as High, Good, Moderate, Poor, or Bad.
Transitional water processes are driven by variations of freshwater influx, tidal movements and sedimentation. The TFCI responds to anthropogenic pressures such as port activities, dredging, reclamation, cooling water abstraction, and pollution from urban, industry, agriculture and aquaculture.
Transitional water processes are driven by variations of freshwater influx, tidal movements and sedimentation. The TFCI responds to anthropogenic pressures such as port activities, dredging, reclamation, cooling water abstraction, and pollution from urban, industry, agriculture and aquaculture. The TFCI was developed for WFD classification using fishes as an indicator of the quality status of transitional waters (Coates et al., 2004, 2007, UKTAG, 2014). The TFCI considers four community characteristics that are represented by ten separate metrics (Table a).
|
Community characteristic
|
No.
|
Metric
|
|
Species diversity and composition
|
1
|
Species composition
|
|
2
|
Presence of indicator species
|
|
|
Species abundance
|
3
|
Species relative abundance
|
|
4
|
Number of taxa that make up 90% of the abundance
|
|
|
Nursery function
|
5
|
Number of estuarine resident taxa
|
|
6
|
Number of estuarine-dependent marine taxa
|
|
|
7
|
Functional guild composition
|
|
|
Trophic integrity
|
8
|
Number of benthic invertebrate feeding taxa
|
|
9
|
Number of piscivorous taxa
|
|
|
10
|
Feeding guild composition
|
Using monitoring data, each metric is assessed or scored according to the degree of departure from a reference condition; these scores are then combined into a single, integrated multi-metric index. All metrics have equal weighting in terms of their contribution to the overall result. To meet the requirements of the WFD, the final index values are re-scaled to give an Ecological Quality Ratio (EQR), which ranges between 0 and 1. The EQR is divided into five class bands: High, Good, Moderate, Poor, and Bad which depend upon the level of impact on the fish community (Table b).
|
Class |
EQR range |
Definition |
|
High
|
0.81 – 1.0
|
Near natural, minimally disturbed, reference.
|
|
Good
|
0.58 – < 0.81
|
Slight deviation from reference.
|
|
Moderate
|
0.4 - < 0.58
|
Moderate deviation from reference.
|
|
Poor
|
0.2 - < 0.4
|
Major alteration leading to substantial deviation from reference.
|
|
Bad
|
0.0 - < 0.2
|
Severe alteration leading to large portions of community absent compared to reference.
|
The development of the TFCI followed a multi-metric approach, which has been successfully applied to transitional waters (estuaries) both globally and in Europe in the context of the WFD (e.g. Miller et al., 1988; Deegan et al., 1997; Gibson et al., 2000; Hughes et al., 2002; Borja et al., 2004; Harrison & Whitfield, 2004; 2006; Breine et al., 2007; Coates et al., 2007).
The selection of metrics was devised following a review of existing estuarine multi-metric fish indices and further discussion by the UK Fish Task Team (Coates et al., 2004). The candidate metrics are based upon either presence/absence data, relative (%) abundance data or number of taxa present. A full description of the metrics and development of the TFCI can be found in Coates et al., 2007.
The use of appropriate reference conditions (in tables below) is essential for a meaningful WFD assessment of the fish community as they provide the baseline against which fish metrics can be evaluated. Reference conditions must take into account zoogeographic differences, the inherent morphological variation between transitional water types and sampling methodologies.
Two ecoregions for European transitional and coastal waters are recognised under WFD with the UK: Atlantic Ocean and North Sea. In terms of morphology, the WFD requires that transitional waters are also assigned to a typology using factors such as ecoregion, salinity, tidal range, depth, current velocity, wave exposure, residence time, water temperature, mixing characteristics, turbidity, substratum composition and shape. The purpose of assigning transitional waters to a physical type is to enable the establishment of appropriate reference conditions and to make a valid assessment of the ecological status of each system. The UK Technical Advisory Group (UKTAG) for WFD identified six types of transitional water within the UK and Republic of Ireland based on mixing characteristics, salinity, mean tidal range, wave exposure, depth and substratum (Table c).
|
Type
|
Mixing
|
Salinity
|
Tidal range
|
Exposure
|
Depth
|
Substratum
|
|
TW1
|
Partly mixed/
stratified
|
Mesohaline or
polyhaline
|
Macrotidal
|
Sheltered
|
Intertidal/
shallow
sub-tidal
|
Sand and mud
|
|
TW2
|
Partly mixed/
stratified
|
Mesohaline or
polyhaline
|
Strongly mesotidal
|
Sheltered
|
Intertidal/
shallow
sub-tidal
|
Sand and mud
|
|
TW3
|
Fully mixed
|
Predominantly
polyhaline
|
Macrotidal
|
Sheltered
|
Extensive
intertidal
areas
|
|
|
TW4
|
Fully mixed
|
Polyhaline or
euhaline
|
Mesotidal
|
Sheltered
|
Extensive
intertidal
areas
|
Sand or mud
|
|
TW5
(sea lochs)
|
|
Polyhaline
|
Mesotidal
|
Sheltered
|
|
|
|
TW6
(lagoons)
|
Partly mixed/
stratified
|
Oligohaline -
polyhaline
|
N/A
|
Sheltered
|
Shallow
|
Predominately mud
|
There are four transitional waters body types present in Scotland; types TW2, TW3, TW5 and TW6. Transitional water lagoons, type TW6, are widespread but are generally inaccessible to fish and are excluded from WFD assessments for fish. Of the others, on the east coast (North Sea Ecoregion) only type TW2 occurs. On the west coast (Atlantic Ecoregion) types TW2, TW3, and TW5 are present.
Reference conditions and metric scoring thresholds for the TFCI use a combination of historical records, best available data, and expert judgement. Metric reference conditions for each region /water body type are needed to ensure an effective classification.
Reference conditions have been developed for Scottish west coast TW2 (Tables d & e) and TW5 (Tables f & g) using a combination of Scottish historical records, and recent data from Scotland and (for TW2) data from Northern Ireland which is geographically similar. The Scottish west coast data are dominated by records from the Clyde Estuary, which includes large relatively deep water areas which skews the number of reference species upwards (compared to Northern Ireland) and includes northerly species (e.g. Zoarces viviparus) which are scarcer in Ireland (or western England). Augmentation of the Scottish west coast TW2 data with additional records from the adjacent area of Northern Ireland helps diminish the bias towards the Clyde Estuary but maintains the northerly focus of the data.
|
Scientific name
|
Metric 1
|
Metric 2
|
Metric 3
(% abundance)
|
|
Acipenser sturio
|
|
X
|
|
|
Agonus cataphractus
|
X
|
|
1.08
|
|
Alosa alosa
|
|
X
|
|
|
Alosa fallax
|
|
X
|
|
|
Anguilla anguilla
|
X
|
X
|
0.51
|
|
Chelon labrosus
|
X
|
|
0.52
|
|
Ciliata mustela
|
X
|
|
1.83
|
|
Clupea harengus
|
X
|
|
6.30
|
|
Gadus morhua
|
X
|
|
0.69
|
|
Gasterosteus aculeatus
|
X
|
|
3.48
|
|
Hippoglossoides platessoides
|
|
|
0.22
|
|
Lampetra fluviatilis
|
|
X
|
|
|
Limanda limanda
|
X
|
|
5.69
|
|
Liza ramada
|
|
|
0.63
|
|
Merlangius merlangus
|
X
|
|
0.35
|
|
Myoxocephalus scorpius
|
X
|
|
1.35
|
|
Osmerus eperlanus
|
|
X
|
|
|
Petromyzon marinus
|
|
X
|
|
|
Pholis gunnellus
|
X
|
|
0.22
|
|
Phoxinus phoxinus
|
X
|
|
0.24
|
|
Platichthys flesus
|
X
|
|
33.91
|
|
Pleuronectes platessa
|
X
|
|
6.39
|
|
Pollachius pollachius
|
X
|
|
4.33
|
|
Pollachius virens
|
|
|
1.36
|
|
Pomatoschistus microps
|
X
|
|
9.92
|
|
Pomatoschistus minutus
|
X
|
|
12.31
|
|
Salmo salar
|
X
|
X
|
|
|
Salmo trutta
|
X
|
X
|
0.50
|
|
Solea solea
|
X
|
|
0.37
|
|
Spinachia spinachia
|
X
|
|
|
|
Sprattus sprattus
|
X
|
|
4.68
|
|
Syngnathus rostellatus
|
X
|
|
0.30
|
|
Taurulus bubalis
|
X
|
|
0.77
|
|
Trisopterus minutus
|
X
|
|
|
|
Zoarces viviparus
|
X
|
|
0.94
|
|
Total
|
26
|
9
|
26
|
|
No
|
Metric
|
Reference
|
|
4
|
Number of taxa that make up 90% of the abundance
|
5.9
|
|
5
|
Number of estuarine resident taxa
|
9.6
|
|
6
|
Number of estuarine-dependent marine taxa
|
9.3
|
|
7
|
Functional guild composition
|
6.0
|
|
8
|
Number of benthic invertebrate feeding taxa
|
14.2
|
|
9
|
Number of piscivorous taxa
|
6.6
|
|
10
|
Feeding guild composition
|
4.0
|
|
Scientific Name
|
Metric 1
|
Metric 2
|
Metric 3
(% abundance)
|
|
Acipenser sturio
|
|
X
|
|
|
Agonus cataphractus
|
X
|
|
|
|
Alosa alosa
|
|
X
|
|
|
Alosa fallax
|
|
X
|
|
|
Anguilla anguilla
|
|
X
|
|
|
Aspitrigla cuculus
|
|
|
0.52
|
|
Atherina presbyter
|
|
|
0.50
|
|
Callionymus lyra
|
X
|
|
5.91
|
|
Callionymus maculatus
|
X
|
|
1.62
|
|
Clupea harengus
|
X
|
|
2.40
|
|
Eutrigla gurnardus
|
X
|
|
2.47
|
|
Gadus morhua
|
X
|
|
2.75
|
|
Gasterosteus aculeatus
|
X
|
|
3.14
|
|
Gobiusculus flavescens
|
|
|
0.35
|
|
Glyptocephalus cynoglossus
|
X
|
|
0.35
|
|
Hippoglossoides platessoides
|
X
|
|
7.65
|
|
Lampetra fluviatilis
|
|
X
|
|
|
Limanda limanda
|
X
|
|
22.51
|
|
Merlangius merlangus
|
X
|
|
27.07
|
|
Melanogrammus aeglefinus
|
X
|
|
0.39
|
|
Myoxocephalus scorpius
|
X
|
|
0.40
|
|
Osmerus eperlanus
|
|
X
|
|
|
Petromyzon marinus
|
|
X
|
|
|
Pholis gunnellus
|
X
|
|
0.53
|
|
Platichthys flesus
|
X
|
|
0.60
|
|
Pleuronectes platessa
|
X
|
|
4.68
|
|
Pollachius virens
|
X
|
|
1.25
|
|
Pomatoschistus microps
|
|
|
|
|
Pomatoschistus minutus
|
X
|
|
2.38
|
|
Raja clavata
|
X
|
|
0.29
|
|
Salmo salar
|
|
X
|
|
|
Salmo trutta
|
|
X
|
0.47
|
|
Scyliorhinus canicula
|
X
|
|
|
|
Scomber scombrus
|
X
|
|
|
|
Solea solea
|
X
|
|
0.31
|
|
Spinachia spinachia
|
X
|
|
1.74
|
|
Sprattus sprattus
|
X
|
|
|
|
Squalus acanthias
|
X
|
|
3.83
|
|
Taurulus bubalis
|
X
|
|
0.25
|
|
Trisopterus esmarkii
|
X
|
|
0.26
|
|
Trisopterus minutus
|
X
|
|
2.46
|
|
Zoarces viviparus
|
X
|
|
0.41
|
|
Total
|
29
|
9
|
29
|
|
No
|
Metric
|
Reference
|
|
4
|
Number of taxa that make up 90% of the abundance
|
10.3
|
|
5
|
Number of estuarine resident taxa
|
8.25
|
|
6
|
Number of estuarine-dependent marine taxa
|
9.8
|
|
7
|
Functional guild composition
|
6.0
|
|
8
|
Number of benthic invertebrate feeding taxa
|
20.5
|
|
9
|
Number of piscivorous taxa
|
7.5
|
|
10
|
Feeding guild composition
|
4.0
|
Reference conditions for Scottish east coast TW2 estuaries have been developed using Scottish historical records combined with recent data from east Scotland and an adjacent area of North East England, which is geographically similar (Tables h & i). The inclusion of TW2 data from North East England helps reduce a potential bias towards Forth Estuary records. Scottish TW3 transitional waters are restricted to the Solway Estuary and a few nearby smaller estuaries on the coast of Dumfries and Galloway. Development of specific Scottish reference conditions for TW3 has not been completed due to paucity of data and monitoring of Scottish TW3 waters is not carried out.
|
Scientific name
|
Metric 1
|
Metric 2
|
Metric 3
(% abundance)
|
|
Acipenser sturio
|
|
X
|
|
|
Agonus cataphractus
|
X
|
|
1.30
|
|
Alosa alosa
|
|
X
|
|
|
Alosa fallax
|
|
X
|
|
|
Ammodytes tobianus
|
X
|
|
6.54
|
|
Anguilla anguilla
|
X
|
X
|
1.04
|
|
Ciliata mustela
|
X
|
|
2.82
|
|
Clupea harengus
|
X
|
|
3.22
|
|
Gadus morhua
|
X
|
|
7.95
|
|
Gasterosteus aculeatus
|
X
|
|
7.15
|
|
Lampetra fluviatilis
|
|
X
|
|
|
Limanda limanda
|
X
|
|
|
|
Merlangius merlangus
|
X
|
|
7.00
|
|
Myoxocephalus scorpius
|
X
|
|
2.67
|
|
Osmerus eperlanus
|
|
X
|
2.84
|
|
Petromyzon marinus
|
|
X
|
|
|
Phoxinus phoxinus
|
|
|
1.14
|
|
Platichthys flesus
|
X
|
|
18.31
|
|
Pleuronectes platessa
|
X
|
|
7.33
|
|
Pollachius pollachius
|
X
|
|
1.22
|
|
Pollachius virens
|
X
|
|
2.13
|
|
Pomatoschistus microps
|
X
|
|
|
|
Pomatoschistus minutus
|
X
|
|
1.00
|
|
Salmo salar
|
X
|
X
|
|
|
Salmo trutta
|
X
|
X
|
1.76
|
|
Spinachia spinachia
|
|
|
0.43
|
|
Sprattus sprattus
|
X
|
|
18.73
|
|
Syngnathus acus
|
X
|
|
|
|
Syngnathus rostellatus
|
X
|
|
1.32
|
|
Taurulus bubalis
|
|
|
0.49
|
|
Zoarces viviparus
|
X
|
|
1.45
|
|
Total
|
22
|
9
|
22
|
|
No
|
Metric
|
Reference
|
|
4
|
Number of taxa that make up 90% of the abundance
|
8.5
|
|
5
|
Number of estuarine resident taxa
|
8.6
|
|
6
|
Number of estuarine-dependent marine taxa
|
7.3
|
|
7
|
Functional guild composition
|
6.0
|
|
8
|
Number of benthic invertebrate feeding taxa
|
9.1
|
|
9
|
Number of piscivorous taxa
|
6.6
|
|
10
|
Feeding guild composition
|
4.0
|
There are numerous pressures on transitional water (and inshore) fish communities but as detailed pressure data are not available for most areas it is it is difficult to directly relate pressures to TFCI assessment results or use pressure data as proxy assessments.
The pressures on transitional and inshore fish communities include:
- Barriers to mobile species movement e.g. for migratory salmonids, lampreys, eels);
- De-oxygenation e.g., salmonid mortalities due to summer oxygen sags in upper estuaries during warm weather and low flows, or mass mortalities of sandeels in shallow inshore bays due to localised plankton blooms;
- Emergent regime changes e.g. mortalities from power station cooling water abstraction;
- Genetic modification & translocation of indigenous species e.g., impact of accidental release of farmed salmonids on wild salmon populations;
- Introduction or spread of non-indigenous species & translocations e.g., competition of Pacific-type/red salmon entering estuaries and rivers in North East Scotland;
- Water quality;
- Organic enrichment;
- Physical change to another seabed type e.g., via dredge disposal;
- Physical removal extraction of substratum, dredging, land reclamation;
- Removal of non-target species (lethal);
- Removal of target species e.g., plaice, dab, sole removed inshore or elsewhere - impacts juvenile populations inshore;
- Siltation changes;
- Sub-surface abrasion/penetration;
- Synthetic compound contamination e.g. pesticides, antifoulants, pharmaceuticals;
- Temperature changes e.g. localised power stations thermal discharges;
- Underwater noise e.g. piling noise disruption to migrating salmonids in industrialised estuaries.
Inshore fish in transitional waters comprise species with different roles in the community such as residents, migrants passing upstream or downstream, seasonal visitors, or species using estuaries as a nursery. Each of these groups is exposed in different ways to anthropogenic pressures. Waste disposal such as sewerage discharges may cause organic enrichment and consequently reduce oxygen levels (via biological oxygen demand) in upper estuarine waters, especially during summer periods with warmer waters and lower flows. This inhibits the passage of migratory fish or causes fish mortalities. Similarly, localised enrichment may contribute to plankton blooms in shallow coastal waters causing mass mortalities of fish such as sandeels. Industrial discharges with toxic compounds (heavy metals, pesticides, anti-foulants, and pharmaceuticals) may induce sub-lethal stress in many fish species. Dredging activities, whether abstraction or disposal, or beach replenishment activities, may impact benthic species via smothering or loss of their food resource of benthic invertebrates. Inshore fishing activities remove both target and non-target fish species and impact the seabed invertebrate communities on which demersal fish feed. Energy production can have a significant impact on inshore fish communities where cooling water abstraction may remove large numbers of small or juvenile fish. Cooling water discharges may elevate local temperatures with consequent oxygen reductions. Infrastructure in the form of embankments and land reclamation may result in significant habitat loss for shallow water fish species and alter local water flow characteristics. Aquaculture poses a potential pressure on inshore fish communities via the escape of modified strains of fish, or the elevation of levels of sea lice from caged fish, both of which may then affect wild populations. The recent arrival of the non-native Pacific pink salmon in Scottish inshore waters also represents a potential threat to the native Atlantic salmon populations.
The transitional water fish communities in industrialised estuaries, such as the Clyde or Forth, may be subject to cumulative pressures acting on the habitat or species. However, direct evidence of the impact of specific pressures is difficult to determine. The transitional waters where this assessment is undertaken are highly dynamic areas and it is unknown how the different pressures cumulate and affect the species being assessed. Moreover, although the WFD method is a semi quantitative standardised assessment method of the fish community within specific transitional waters, many of the fish are not permanent residents of the water body. The fish community comprises different functional guilds – some are residents but others are seasonal visitors only, or use the inshore waters as nursery ground and move offshore as adults, and some (e.g. salmonids, lampreys, eels) undertake extensive migrations, spending only a short part of their lives inshore. These latter fish guilds may be subject to significant trans boundary pressures out with the inshore area. Although the overall multi-metric assessment tool does not highlight trans boundary impacts, they may be indicated by looking at those metrics which are related to the functional guilds. Although this assessment method could theoretically pick up rare or occasional visitors to the transitional waters (if their presence coincided with the sampling times), this is unlikely in practice as sampling frequency is limited. Sampling of some groups e.g. migratory lampreys and eels (as elvers) is probably under-represented as they migrate in spring whilst WFD sampling is focussed in autumn. Sampling intensity is probably too low to find aliens, such as the Pacific salmon, and different approaches are needed to properly assess these.
The sampling and assessment methods for transitional water fish communities were developed by the UK Technical Advisory Group (UKTAG) via the Environment Agency (Colclough et al. 2004). A guide to these procedures has been produced by the UKTAG and is available on the UKTAG webpage: https://www.wfduk.org/resources/transitional-waters-fish. The Transitional Fish Classification Index has been inter-calibrated, in part, with similar assessment tools for transitional water fish used elsewhere in Europe (European Commission, 2013). SEPA maintains its competency for analysing fish communities by participating in the Fish Component of the North East Atlantic Marine Biological Analytical Quality Control Scheme, which involves ring-test circulations of fish specimens for validation of identifications.
The data sets for the current assessment comprise the most recent species abundance counts from each of the six surveillance water bodies. The relevant data sets are from the Gare Loch and Garnock Estuary in 2013, the Cromarty Firth and Loch Eil in 2015, the Clyde Estuary in 2016, and the Forth Estuary in 2017/18.
The assessment is based on the diversity and abundance of the whole fish community within the transitional water. Sampling is focused in the autumn and involves a multi-method approach involving fyke netting, beach seining, 1.5 m mini-beam trawls and 2.5 m beam trawls (Figures 1, a). Between 30 and 50 samples are collected throughout the whole water body to sample all parts of the fish community. The community data is analysed via a multi-metric index, which assesses species diversity and composition, as well as the functional roles and feeding strategies of the fish species.
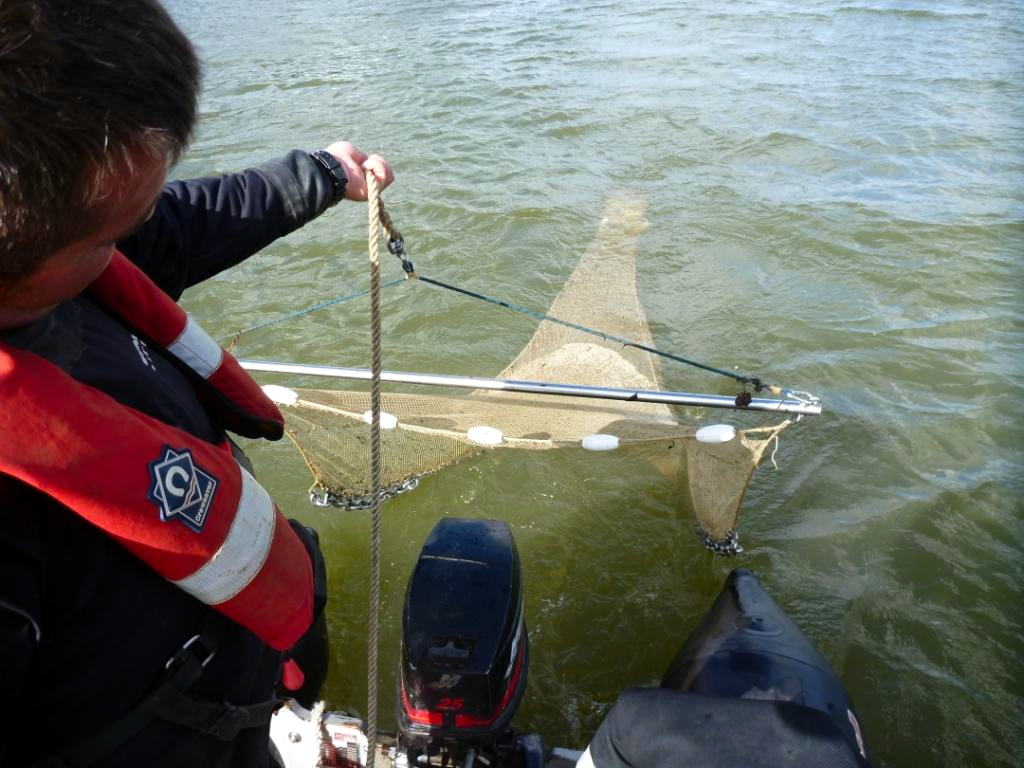
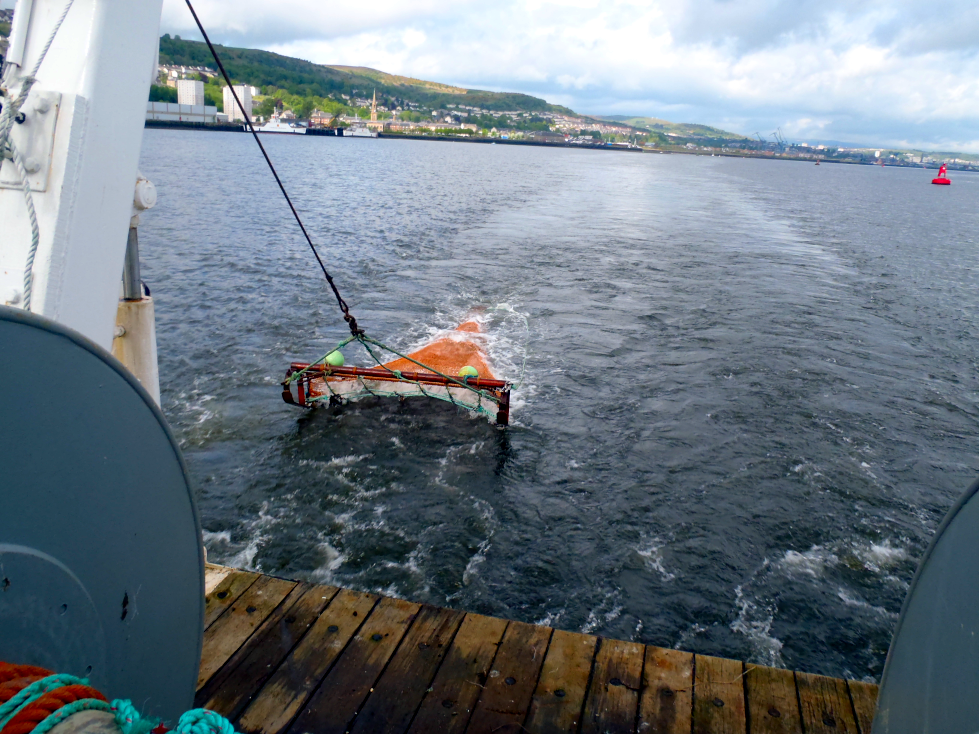
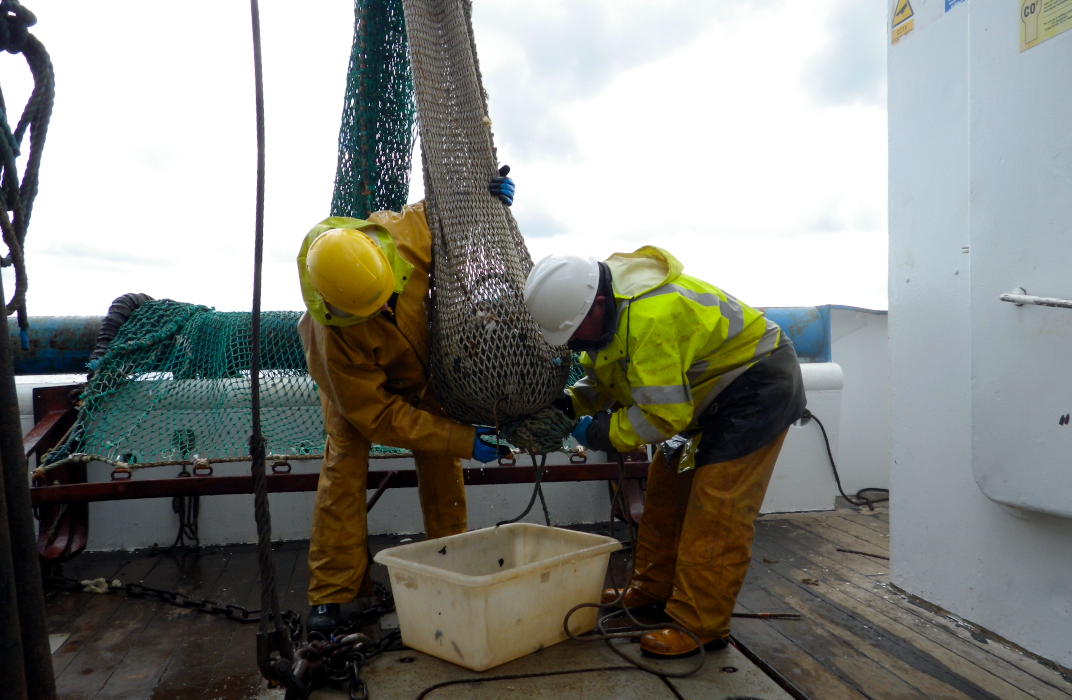
Figure a: Deploying the 1.5 m mini-beam trawl (top) and 2.5 m beam trawl (middle and bottom). © SEPA.
To carry out a WFD biological assessment, each biological quality element (BQE, defined in the WFD) is required to give a statistically robust definition of the ‘health’ of that element in the sampled water body. The ‘health’ of a BQE is assessed by comparing the measured conditions (observed value) against that described for reference conditions (minimally disturbed). This is reported as an Ecological Quality Ratio (EQR). An EQR with a value towards 1 represents reference conditions and a value towards 0 represents a severe impact. The EQR is divided into five ecological status classes, High, Good, Moderate, Poor and Bad that are defined by the changes in the biological community in response to disturbance (Figure b).
Alongside the EQR score and class status, any assessment must consider the certainty of the assessment (i.e. confidence in the assigned class).
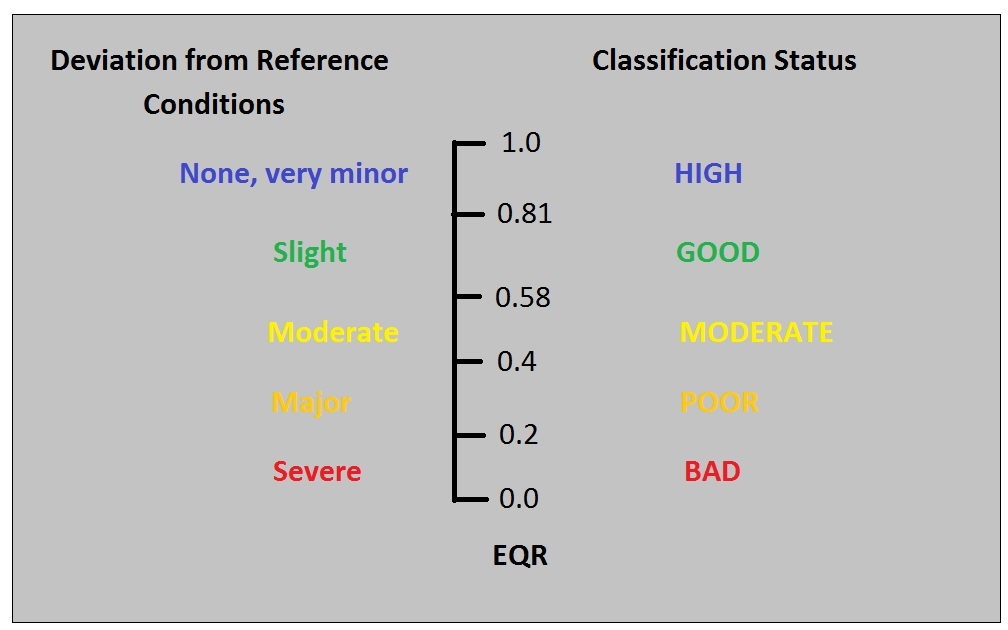
Figure b: Illustration of the Ecological Quality Ratio (EQR) and how it relates to deviation from Reference Conditions during a classification. The class band widths relate to biological changes as a result of ecological disturbance,
Results from the six surveillance transitional waters classified for transitional water fish are extrapolated to provide a proxy WFD assessment for an additional 12 nearby transitional waters. This manifests itself on East coast also covering Eden, Lossie and Tay Estuaries, Dornoch, Moray, and Beauly Firths, and Montrose Basin, all TW2. On West coast: Lochs Etive and Linnhe (North), both TW5 and Ayr, Girvan, and Stinchar Estuaries, all TW2. However, the inshore fish communities in coastal waters (i.e. non-transitional) are not assessed under WFD and there are insufficient pressure data in these areas to provide proxy assessments.
The WFD assessment is based on a standardised semi-quantitative method undertaken across specific transitional waters. Some expert judgement was used to derive reference conditions for Scottish transitional water fish. As the transitional water inshore fish community involves groups of highly mobile fish species, which may spend part of their lives elsewhere, e.g. inland in freshwaters, offshore in UK marine waters, or offshore out with UK marine waters, then the community may be subject to significant trans-boundary pressures in these other areas.
|
Scottish Marine Region
|
WFD Transitional water body
(N.B.: Scale is whole estuary or whole transitional sea loch and the WFD fish tool is only deployed in transitional waters)
|
|
Moray Firth
|
Cromarty Firth
|
|
Forth and Tay
|
Forth Estuary
|
|
West Highlands
|
Loch Eil
|
|
Clyde
|
Clyde Estuary, Gare Loch and Garnock Estuary
|
Results
Fish communities in six representative transitional water bodies have been assessed using the WFD TFCI tool between 2010 and 2018. These water bodies sit within four Scottish Marine Regions. Although fish survey data from transitional water fish communities have been collected for the Forth and Clyde Estuaries for decades this is mostly using single method sampling and does not comply with the WFD approach so cannot be used for retrospective assessments. Proper WFD assessments using the multi-method sampling approach commenced in 2010 and by the end of 2018 each of the six surveillance waters had undergone at least two rounds of assessment. For logistical reasons some assessments were carried out over a two-year period. Moreover, while guidance from UKTAG suggests annual sampling and assessment should be carried out, in Scottish waters the sampling has only happened every third year. This under-sampling reduces confidence in the results.
The fish communities of all six monitored transitional waters are currently classed as Good quality status. Since 2010 the Environmental Quality Ratios (EQRs) were mostly in the Good range (0.58 - 0.81) but achieved High status (>0.81) in the Clyde Estuary in 2010 and the Forth Estuary in 2014 (Table 1).
With only two assessments for most of the water bodies there are no clear trends in the assessment data with most EQRs sitting in the Good range and only two assessments achieving High status. The drop from High to Good status in the Forth Estuary between 2014 and 2017/18 is believed to be due to insufficient sampling in 2017/18 but there is no obvious explanation for the different assessments in the Clyde Estuary between 2010/11 and 2012/13.
No assessment of Inshore Fish was presented in the 2011 Atlas (Baxter et al., 2011) so a comparison cannot be undertaken.
|
Transitional water and Scottish Marine Region
|
Typology
|
Year
|
EQR
|
Class
|
|
Cromarty Firth (Moray Firth SMR)
|
TW2
|
2012
|
0.725
|
Good
|
|
2015
|
0.75
|
Good
|
||
|
Forth Estuary (Forth and Tay SMR)
|
TW2
|
2014
|
0.825
|
High
|
|
2017/18
|
0.725
|
Good
|
||
|
Loch Eil (West Highland SMR)
|
TW5
|
2012
|
0.725
|
Good
|
|
2015
|
0.775
|
Good
|
||
|
Gare Loch (Clyde SMR)
|
TW5
|
2010
|
0.65
|
Good
|
|
2013
|
0.725
|
Good
|
||
|
Clyde Estuary (Clyde SMR)
|
TW2
|
2010/11
|
0.85
|
High
|
|
2012/13
|
0.75
|
Good
|
||
|
2016
|
0.75
|
Good
|
||
|
Garnock Estuary (Clyde SMR)
|
TW2
|
2010
|
0.625
|
Good
|
|
2013
|
0.65
|
Good
|
Conclusion
Based on results from only six water bodies monitored since 2013, including industrialised estuaries of the Clyde and Forth, the inshore fish communities in transitional waters are in good ecological quality. There is insufficient information available on fish communities from other inshore coastal waters. The indicator does not provide an adequate assessment of the status of indicator (migratory) fish species which use inshore waters but are subject to pressures elsewhere.
Inshore fish are subjected to various anthropogenic pressures including industrial and sewerage discharges, dredging, water abstraction, land reclamation, fishing activities and the impacts of aquaculture operations. As many inshore species spend parts of their lives elsewhere these may be subject to additional pressures in these other areas with a consequent effect on the inshore fish community.
As the assessment status of Good indicates only a slight deviation from reference conclusions then it could be concluded the assessment tool shows the pressures on the fish community are only having a slight effect on the ecological quality (i.e. the composition and abundance) of the fish community. However, as the assessment tool uses a broad brush multi-metric approach, the overall assessment, expressed as a single classification for the fish community, may mask some anthropogenic effects within particular groups or species of fish.
Knowledge gaps
The WFD assessment of fish communities is limited to six transitional waters only. Other inshore fish communities in coastal areas are not assessed. There is no information for other Scottish Marine Regions such as Shetland Isles, Orkney Islands, North East, North Coast, Outer Hebrides, West Highlands which represent a significant portion of the Scottish inshore waters. Inshore fish communities include migratory fish, e.g., salmonids, lampreys, eels, which are subject to pressures out with the region for which there is only limited knowledge.
The six transitional waters have been selected for surveillance as, based on their physical characteristics, they are regarded as representative of other transitional water bodies in Scotland. However, there is little or no information on the fish communities in these other transitional water bodies. Hence it is not possible to gauge their status with any certainty.
Similarly, there is little information on fish communities in fully marine areas (i.e. with salinity > 30 psu) and the inshore fish here have not been assessed. Assessments are only available for water bodies within Moray Firth, Forth and Tay, West Highland, and Clyde Scottish Marine Regions. We have no information for other Scottish Marine Regions such as Shetland Isles, Orkney Islands, North East, North Coast, Outer Hebrides, and West Highlands which represent a significant portion of the Scottish inshore waters.
Pressures out with the region for which there is only limited knowledge could include natural or anthropogenic pressures in nearby or very distant waters. Salmon, for example, may be affected by issues in their spawning grounds upstream in fresh water or in their feeding grounds off Greenland. Similarly, eels could be affected as they grow up in riverine habitats and also impacted as breeding adults in the distant Sargasso Sea.
The potential effects of climate change in inshore fish is not well not well understood but such wide-scale pressures could impact both resident and migratory species.
Status and trend assessment
|
Region assessed |
Status with confidence |
Trend with confidence |
Comments |
| All Scotland |
|
|
Lack of regional evidence/robust assessment criteria but no or few concerns in some local areas. |
|
Clyde |
|
|
Lack of evidence/robust assessment criteria for the overall region. No or few concerns in some local areas. |
|
Argyll |
|
|
Lack of evidence/robust assessment criteria for the overall region. No or few concerns in some local areas. |
|
Moray Firth |
|
|
Lack of evidence/robust assessment criteria for the overall region. No or few concerns in some local areas. |
|
Forth and Tay |
|
|
Lack of evidence/robust assessment criteria for the overall region. No or few concerns in some local areas. |
This Legend block contains the key for the status and trend assessment, the confidence assessment and the assessment regions (SMRs and OMRs or other regions used). More information on the various regions used in SMA2020 is available on the Assessment processes and methods page.
Status and trend assessment
|
Status assessment
(for Clean and safe, Healthy and biologically diverse assessments)
|
Trend assessment
(for Clean and safe, Healthy and biologically diverse and Productive assessments)
|
||
|---|---|---|---|
 |
Many concerns |
No / little change |
|
 |
Some concerns |
Increasing |
|
 |
Few or no concerns |
Decreasing |
|
 |
Few or no concerns, but some local concerns |
No trend discernible |
|
 |
Few or no concerns, but many local concerns |
All trends | |
 |
Some concerns, but many local concerns |
||
 |
Lack of evidence / robust assessment criteria |
||
| Lack of regional evidence / robust assessment criteria, but no or few concerns for some local areas | |||
 |
Lack of regional evidence / robust assessment criteria, but some concerns for some local areas | ||
| Lack of regional evidence / robust assessment criteria, but many concerns for some local areas | |||
Confidence assessment
|
Symbol |
Confidence rating |
|---|---|
|
Low |
|
|
Medium |
|
|
High |

Assessment regions
 and the Scottish Offshore Marine Regions (OMRs, O1 – O10)")
Key: S1, Forth and Tay; S2, North East; S3, Moray Firth; S4 Orkney Islands, S5, Shetland Isles; S6, North Coast; S7, West Highlands; S8, Outer Hebrides; S9, Argyll; S10, Clyde; S11, Solway; O1, Long Forties, O2, Fladen and Moray Firth Offshore; O3, East Shetland Shelf; O4, North and West Shetland Shelf; O5, Faroe-Shetland Channel; O6, North Scotland Shelf; O7, Hebrides Shelf; O8, Bailey; O9, Rockall; O10, Hatton.
 Regions. These have been used as the assessment areas for hazardous substances.")
, Regions.")