
Background
The Scottish Environment Protection Agency (SEPA) regulates the disposal of radioactive waste from licensed nuclear sites. Also it permits the keeping and use of radioactive substances and the accumulation and disposal of radioactive waste from non-nuclear industrial sites.
SEPA is required to ensure that the amount of radiation that an individual is exposed to from the authorised disposal of radioactive waste does not exceed 1.000 millisievert per year (mSv/y), which is a measurement of dose. SEPA’s environmental monitoring programme allows a retrospective assessment to be undertaken to ensure that the conditions and discharge limits in an operator’s licence continue to provide the required protection of the public and the environment.
The retrospective assessments are produced on an annual basis in the Radioactivity in Food and the Environment (RIFE) report series, which are publicly available via the SEPA website. For this assessment, a summary of the dose impact to exposed groups in Scotland has been reproduced for the five year period covering 2013 to 2017. The assessment breakdown is available in the RIFE report of each year and the reader is directed to review this report for the methodology and underlying data.
Further information and international and domestic guidance on the Environmental Monitoring Programme and Habits Programme SEPA undertake to gather data is available on the SEPA website: https://www.sepa.org.uk/environment/radioactive-substances/environmental-monitoring-and-assessment/.
The data sets used in the RIFE production series are:
- Site specific radioactive discharge data (as reported to SEPA by the operator);
- Marine, terrestrial and gaseous monitoring data for radioactive substances (held by SEPA);
- Radiological habits survey data (data on consumption rates of specific foods (in kg/y) and occupation of specific areas (in h/y) (held by SEPA).
These datasets contain information that is sensitive in relation to names of suppliers, physical locations of specific farms etc. and is not publicly available. A suitable summary of the data is reproduced for the RIFE report series. Publicly available reports are held on the SEPA website.
The RIFE assessment methodology is detailed in the RIFE report. It is a peer-reviewed process that considers the input data in terms of validity. It has inclusion rules for how to handle results at the limit of detection (in terms of when a value is regarded as a positive or a zero depending on the presence of the radionuclide in other samples in the region or within a potential discharge profile). This is explained in more detailed in the RIFE report appendices.
The nature of the assessment is the total effective dose to the representative group, which is a whole body exposure assessment for marine, terrestrial and gaseous pathways to those groups identified in the radiological habits survey. These results can be compared against the modelling results for the maximum permitted discharge (either under the Radioactive Substances Act 1993 (for offshore oil & gas discharges) or the replacement legislation the Environmental Authorisations (Scotland) Regulations 2018 (covering both nuclear and non-nuclear onshore discharges).
At the time of the prospective dose assessment, the dose from all sources of radioactivity exposure (excluding natural and medical) to the representative group must not exceed 1.000 millisievert per year however there are also dose constraints for each single source of 0.3 millisieverts per year and from each site of 0.5 millisieverts per year. The dose to non-human species is prospectively assessed when an operator applies for a permit or variation to an existing permit (i.e. assessed on a maximum discharge limit before the discharge actually takes place). Non-human species dose assessment is a developing area, however SEPA apply the latest standards and international guidelines to these assessments to ensure that the environment is appropriately protected.
In the event that the retrospective assessments are outwith the modelled parameters, then additional monitoring data would be collected and bespoke dose assessments to both human and non-human species would be undertaken. The retrospective assessments are a check that the prospective assessments are fit for purpose and provide a suitable precautionary measure prior to a discharge occurring.
The RIFE assessment follows a basic process of:
- Environmental concentration of radionuclide (Bq/kg – Becquerel per kilogram) x Consumption Rate of food type ( kg/y – kilogram per year) x Dose Coefficient (Sv/Bq - Sievert per Becquerel) – to give a dose per unit intake for each reference group per radionuclide;
- It also considers the impact of ‘shine’ which is the energy given off during radioactive decay, for example the radiation dose rate on a particular beach converted to Sieverts per hour multiplied by the exposed group occupancy of hours per year to give a contribution in Sieverts per year;
- The combined effect for all consumption and exposure pathways for each radionuclide is added up to give a total dose per year per reference group.
The RIFE reports cover the nuclear licensed sites in Scotland as well as the impact of the Sellafield nuclear site located in Cumbria, England. The general localities are:
- Effects from Sellafield (derived aquatic pathways only) measured across Dumfries and Galloway
- Dounreay: Caithness & Sutherland
- Chapelcross: Dumfrieshire
- Hunterston: Ayrshire
- Torness: Lothians
- Her Majesty's Naval Base (HMNB) Clyde (Faslane): Argyll and Bute
- Holy Loch: Argyll and Bute (this site is monitored due to former activities at this location)
- Rosyth: Fife (Firth of Forth)
The data from RIFE has been used to demonstrate the progress made by the UK against the OSPAR radioactive substances strategy (this is explained elsewhere).
Monitoring the impact of authorised discharges
SEPA undertakes a comprehensive monitoring programme for environmental radioactivity across Scotland to assess the impacts of authorised discharges of radioactive waste. The programme is designed to provide the data required to undertake a retrospective assessment of the dose to the most exposed member(s) of the public. This individual(s) is termed the representative person and is defined as somebody who, because of their consumption and activity habits, is likely to be more exposed to radioactivity than other individuals or groups of people. SEPA arranges for samples and measurements to be taken every year, to assess the radiation dose to the public. The programme focuses on areas where concentrations of man-made radioactivity might be higher, paying special attention to the areas around the following nuclear sites:
- Chapelcross, Dumfries
- Hunterston, Ayrshire
- HMNB Clyde, Faslane and Coulport, Argyll and Bute
- Dounreay & Vulcan, Caithness
- Rosyth, Fife
- Torness, Lothian & Borders
The monitoring programme consists of the sampling and analysis of seawater, sediments, seaweed, fish and shellfish. Radioactivity in sediments and seawater is used as an indicator whereas other samples are used in the assessment of exposure via consumption.
Monitoring is also carried out along the Dumfries and Galloway coastline and in the Solway Firth, to assess the effects of radioactive waste discharges from Sellafield into the Irish Sea. In addition surveys are undertaken at each of these sites every five years to identify the food consumption habits, time spent in the area and lifestyles to assess people’s exposure.
Further information and international and domestic guidance on the Environmental Monitoring Programme and Habits Programme SEPA undertake to gather data is available on the SEPA website: https://www.sepa.org.uk/environment/radioactive-substances/environmental-monitoring-and-assessment/.
Results
The results presented in the RIFE reports (available on the SEPA website) show that the doses to the most exposed members of the public from exposure to permitted discharges of radioactive waste from the nuclear industry across Scotland are well below the public dose limit (1.000 mSv/y) in all regions. The people most affected in terms of exposure to radiation from waste discharges in or that affect Scotland were those on the Dumfries and Galloway coast who consumed large quantities of seafood.
Results of monitoring & dose assessments
Data collected over the period from 2013 to 2017 shows a largely stable trend in dose estimates
|
|
Total dose
To be compared to dose limit of 1.000 millisievert per year
|
||||
|---|---|---|---|---|---|
|
Site considered
|
2013
|
2014
|
2015
|
2016
|
2017
|
|
Effects from Sellafield (derived aquatic pathways only) measured across Dumfries and Galloway
|
0.044
|
0.045
|
0.037
|
0.044
|
0.035
|
|
Dounreay
|
0.012
|
0.012
|
0.010
|
0.058
|
0.010
|
|
Chapelcross
|
0.024
|
0.014
|
0.022
|
0.026
|
0.035
|
|
Hunterston
|
0.021
|
0.021
|
0.025
|
0.021
|
0.023
|
|
Torness
|
0.020
|
0.020
|
0.020
|
0.021
|
0.021
|
|
HMNB Clyde (Faslane)
|
<0.005
|
<0.005
|
<0.005
|
0.009
|
<0.005
|
|
Holy Loch*
|
<0.005
|
0.011
|
0.012
|
0.013
|
0.009
|
|
Rosyth
|
<0.005
|
<0.005
|
0.006
|
0.017
|
0.026
|
* Holy Loch: This site is monitored due to former activities at this location.
The results of the marine and terrestrial monitoring programmes are reported annually, together with an assessment of the impact of the discharges to the most exposed groups, in the Radioactivity in Food and the Environment (RIFE) reports (see link above). The low dose values reported in Table 1 are not indicative of a trend due to the calculation steps involved for treating environmental monitoring results at the limit of detection as either positive or zero as explained in the RIFE methodology. The data demonstrate that the doses are largely stable however, can be affected by a change in input values, such as a higher limit of detection in a single sample or a change in habits data highlighting higher consumption than previously reported. The data will vary each year due to many factors, such as sample availability, reduction in the sample mass and changes to local habits (reduced consumption). The doses to the reference groups are calculated to be significantly less than the legal dose limit of 1.000 mSv/y.
Data collected over the period from 2013 to 2017 shows a largely stable trend in dose estimates. Slight variations appear from year to year, however these are likely to be the effect of changes in regional habits (e.g. a change in the consumption rates of specific food groups) or the impact of sample availability on the limit of detection of a particular radionuclide (e.g. where a smaller sample size has resulted in a larger limit of detection on analysis). Figure 1 depicts the total radiation doses in Scotland for 2017.
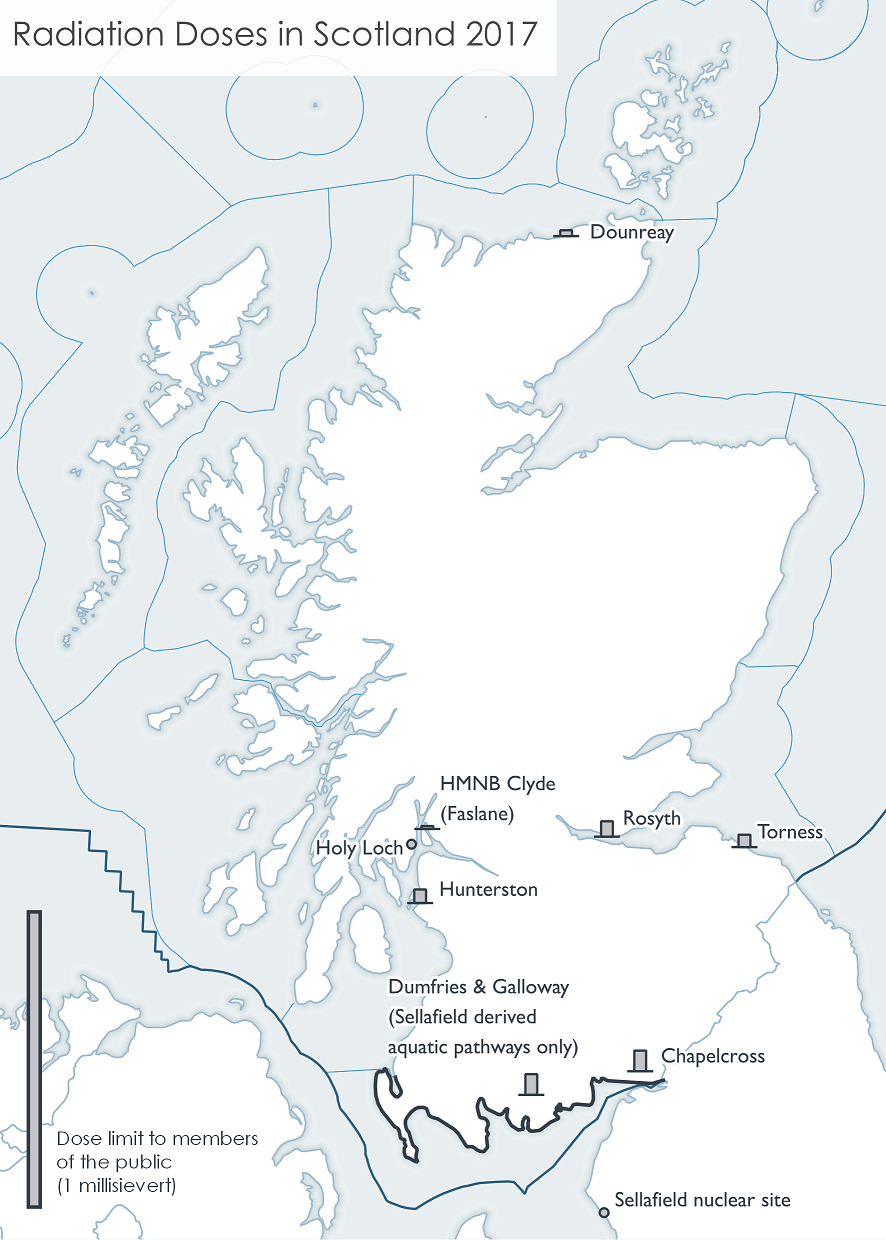
Figure 1: Total doses in Scotland due to radioactive waste discharges and direct radiation, 2017. Source: Radioactivity in Food and the Environment Report 2018 (RIFE-24). A small background monitoring programme is undertaken in Shetland and reported in the RIFE report but there are no data to include on this map.
An example of discharges, monitoring locations and concentration trend analysis is provided in Figure a.
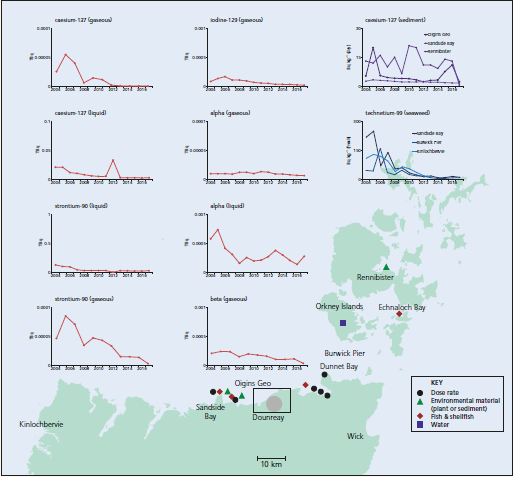
Figure a: Monitoring locations, discharges of gaseous and liquid radioactive wastes and monitoring of the environment in the north of Scotland, 2017 (not including farms or air sampling locations). Source: Radioactivity in Food and the Environment Report 2018 (RIFE-24)
OSPAR & UK Strategy for Radioactive Discharges
The OSPAR Radioactive Substances Strategy was agreed by Ministers in 1998. Its strategic objective is to prevent pollution of the OSPAR maritime area (North-East Atlantic Ocean) from ionising radiation. The ultimate aim of the Strategy is to reduce discharges of radioactive substances to such a degree that environmental radioactivity concentrations in the marine environment above historic levels are near background concentrations for naturally-occurring radioactive substances and close to zero for man-made substances.
The OSPAR Strategy is implemented through the UK Strategy for Radioactive Discharges 2009, which provides a strategic framework for reducing discharges from the nuclear industry. This strategy was reviewed in 2018 and concluded that the UK was making good progress to achieving the outcomes of the 2009 strategy, and that the UK is contributing towards meeting the objectives of the OSPAR Strategy.
Conclusion
Data collected over the period from 2013 to 2017 shows a largely stable trend in dose estimates. Small variations from year to year and normally the result in a sample type change which can raise the limit of detection for a particular analyte. Overall, the results of monitoring and assessment demonstrate that the controls placed upon operators by SEPA ensure that members of the public and the environment are adequately protected (i.e. doses are significantly less than the legal dose limit of 1.000 mSv/y).
Radioactive substances will continue to be monitored each year at the same locations or as modified as required and identified in the radiological habits survey programme.
Given the nature of radioactive substances control and the SEPA oversight, these data are unsuitable for use without knowledge of the underlying assessment process and datasets. It is unlikely that any individual would seek to utilise the data for marine planning.
Knowledge gaps
Currently the RIFE report assesses radioactivity in food and the environment, with a focus on human health. Developments are currently underway to better understand the impacts of radioactivity on non-human species. In addition, work is ongoing to improve radioactivity exposure assessments from discharges of naturally occurring radioactive material from the oil and gas industry.
Status and trend assessment
|
Region assessed
|
Status with confidence
|
Trend with confidence
|
Comments
|
|---|---|---|---|
|
Clyde
Hunterston HMNB Clyde (Faslane) Holy Loch |
 |
|
For all sites under assessment the doses calculated (and hence underlying environmental concentration data) are below the legal dose limit (1.000 mSv/y) and are relatively stable year to year.
|
|
Forth and Tay
Torness Rosyth |
|
|
For all sites under assessment the doses calculated (and hence underlying environmental concentration data) are below the legal dose limit (1.000 mSv/y) and are relatively stable year to year.
|
|
North Coast
Dounreay |
|
|
For all sites under assessment the doses calculated (and hence underlying environmental concentration data) are below the legal dose limit (1.000 mSv/y) and are relatively stable year to year.
|
|
Solway
Effects from Sellafield (derived aquatic pathways only) measured across Dumfries and Galloway Chapelcross |
|
|
For all sites under assessment the doses calculated (and hence underlying environmental concentration data) are below the legal dose limit (1.000 mSv/y) and are relatively stable year to year.
|
This Legend block contains the key for the status and trend assessment, the confidence assessment and the assessment regions (SMRs and OMRs or other regions used). More information on the various regions used in SMA2020 is available on the Assessment processes and methods page.
Status and trend assessment
|
Status assessment
(for Clean and safe, Healthy and biologically diverse assessments)
|
Trend assessment
(for Clean and safe, Healthy and biologically diverse and Productive assessments)
|
||
|---|---|---|---|
 |
Many concerns |
No / little change |
|
 |
Some concerns |
Increasing |
|
| |
Few or no concerns |
Decreasing |
|
 |
Few or no concerns, but some local concerns |
No trend discernible |
|
 |
Few or no concerns, but many local concerns |
All trends | |
 |
Some concerns, but many local concerns |
||
 |
Lack of evidence / robust assessment criteria |
||
| Lack of regional evidence / robust assessment criteria, but no or few concerns for some local areas | |||
 |
Lack of regional evidence / robust assessment criteria, but some concerns for some local areas | ||
| Lack of regional evidence / robust assessment criteria, but many concerns for some local areas | |||
Confidence assessment
|
Symbol |
Confidence rating |
|---|---|
|
Low |
|
|
Medium |
|
|
High |

Assessment regions
 and the Scottish Offshore Marine Regions (OMRs, O1 – O10)")
Key: S1, Forth and Tay; S2, North East; S3, Moray Firth; S4 Orkney Islands, S5, Shetland Isles; S6, North Coast; S7, West Highlands; S8, Outer Hebrides; S9, Argyll; S10, Clyde; S11, Solway; O1, Long Forties, O2, Fladen and Moray Firth Offshore; O3, East Shetland Shelf; O4, North and West Shetland Shelf; O5, Faroe-Shetland Channel; O6, North Scotland Shelf; O7, Hebrides Shelf; O8, Bailey; O9, Rockall; O10, Hatton.
 Regions. These have been used as the assessment areas for hazardous substances.")
, Regions.")