

Background
Ocean salinity is the salt concentration of sea water. Salinity is controlled by the balance between evaporation (fresh water out) and precipitation or run-off from land (fresh water in).
Changes in salinities in Scottish waters are largely driven by global circulation patterns, changes in the balance between precipitation and evaporation, and locally by freshwater input from rivers. The salinity can affect the marine ecosystem in many ways, for example, through its contribution to seawater density, it can exert a direct effect on metabolic processes and influence the strength and location of currents.
Salinity data collection is generally well covered for the North Sea regions, but limited in temporal cover of the annual cycle. Sampling on the Scottish west coast is also very sparse spatially, and limited to a select few stations. At several key locations, sustained observations extend back to the 1960s.
The climatological average salinity in the North Sea from the International Bottom Trawl Survey (IBTS) dataset shows clear differences between the northern and southern North Sea. In the north, the saltier (and warmer) water masses from the Atlantic inflow can be found, whilst further south there is a much greater influence of coastal fresh water inputs, and therefore salinities are lower (Figure 1).
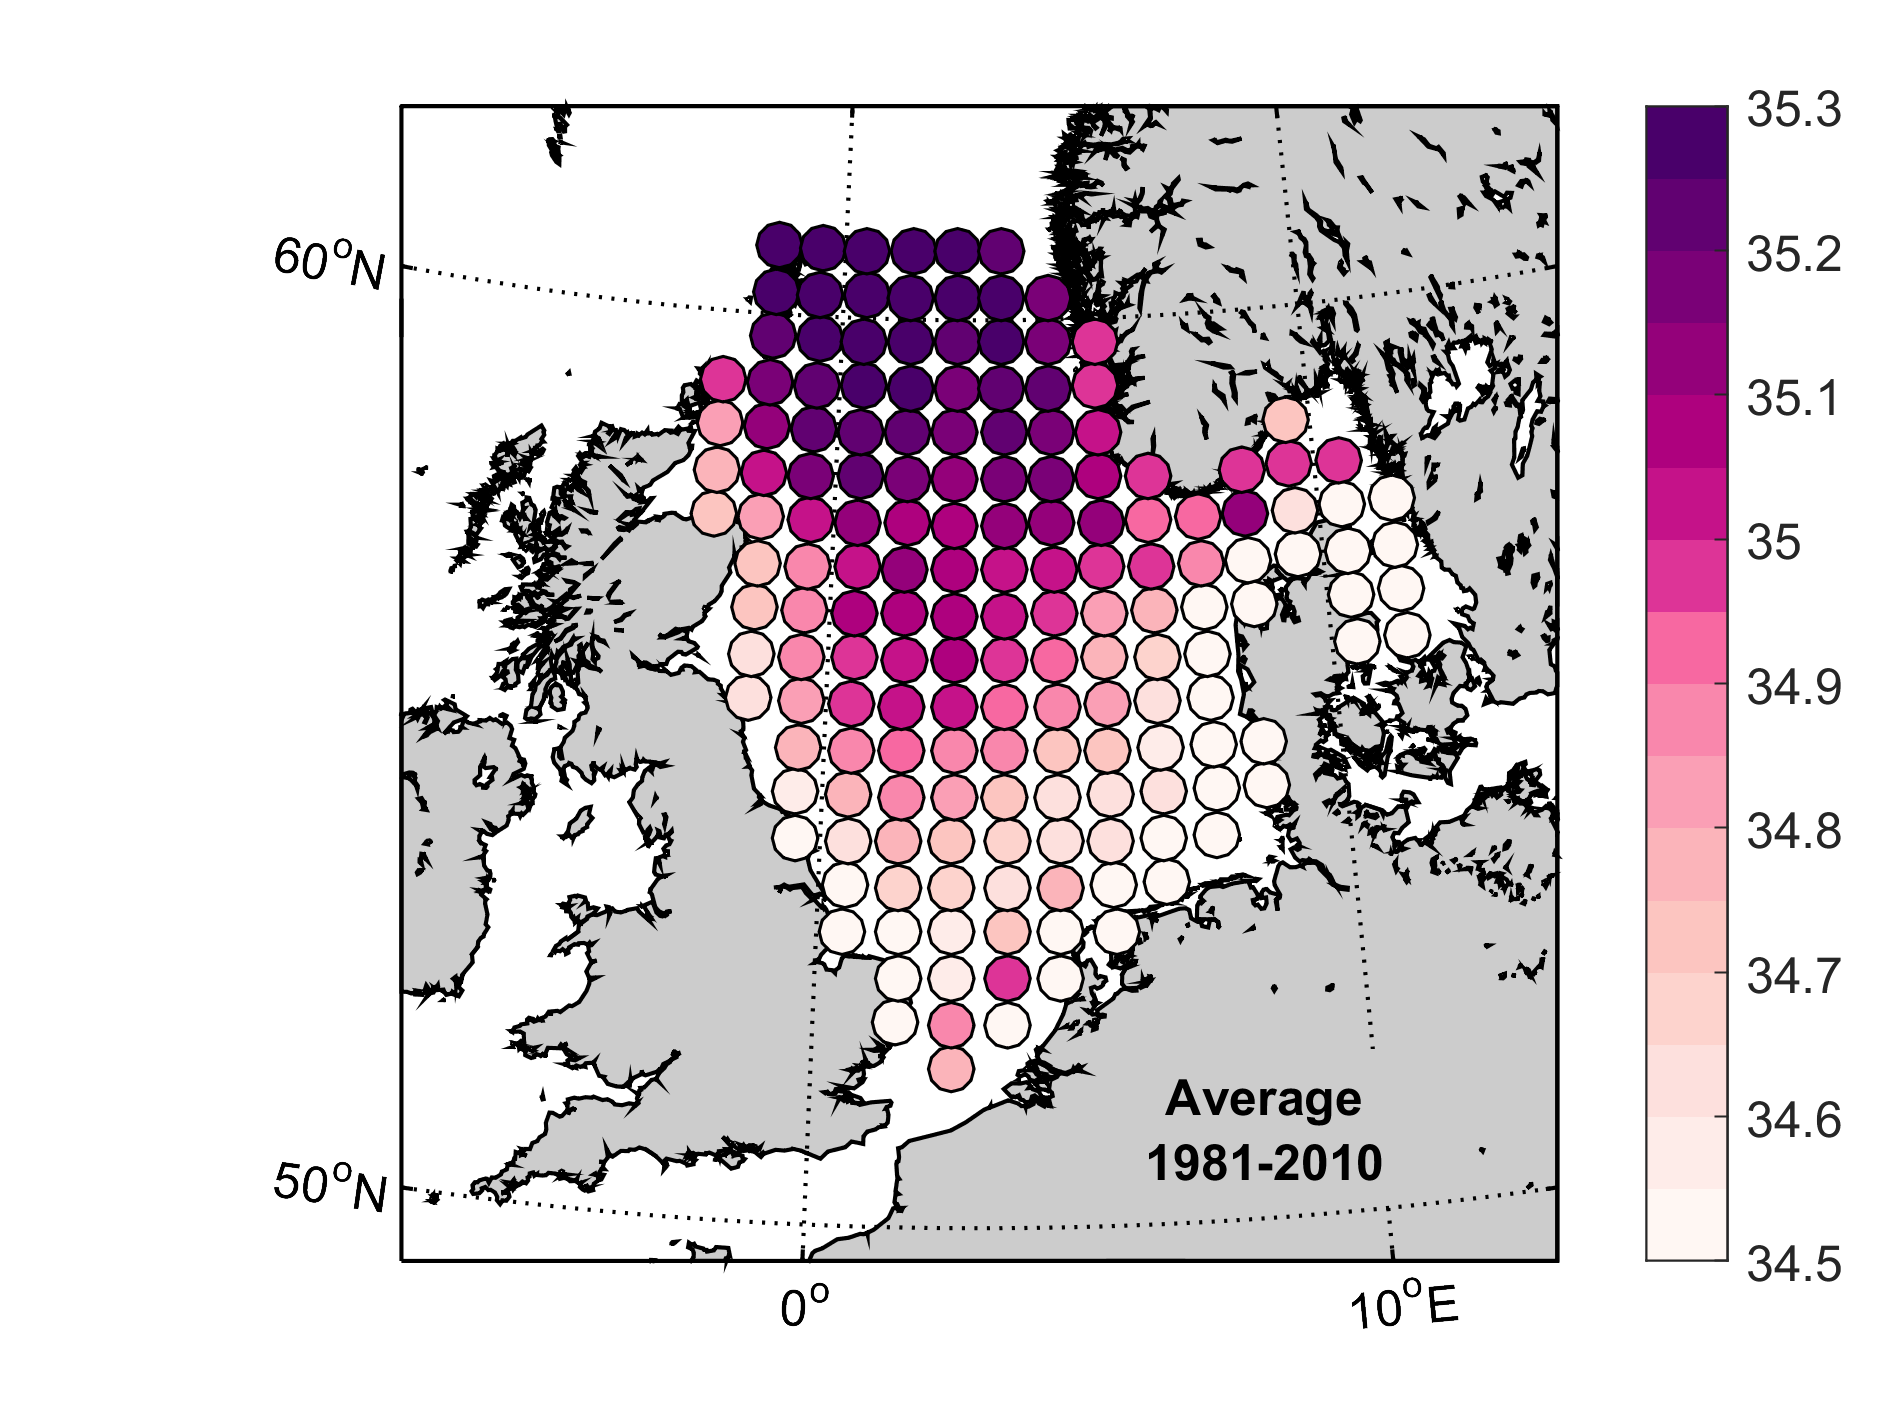
Figure 1: Mean near-bed salinity from International Bottom Trawl Survey (IBTS) winter-time surveys in the North Sea during the 1981 to 2010 climatological base period.
Salinity has been traditionally measured at sea by collecting discreet samples or profiling the full water column with oceanographic equipment. More recently, numerical computer simulations of ocean dynamics and properties, and remote sensing technologies are also starting to provide information on salinity. However, as these are still relatively novel, their application is not included here.
Knowledge of spatial and temporal changes in salinity relies on in situ observations collected from ocean-going research vessels or from volunteers based at key coastal locations. This means knowledge of the spatial patterns relating to Offshore Marine Regions (OMRs) and Scottish Marine Regions (SMRs) is limited. Here, the assessment of salinity in Scottish waters relies on three observational programmes: coastal salinities from the Scottish Coastal Observatory programme, oceanic water mass salinities from the MSS Offshore Monitoring Programme, near-bed salinity distributions from the IBTS Quarter 1 surveys.
More details on the data collection and processing of this information can be found in the Scottish Ocean Climate Status Report (Hughes et al., 2018) and the International Council for the Exploration of the Sea (ICES) Report on Ocean Climate (González-Pola et al., 2018).
To easily compare the observed changes between regions, the observations in each region can be placed in the context of the variability of the region. This means taking the observed value, removing the average of the relevant period, and dividing by the standard deviation in that period. These are called normalised anomalies. The relevant period, also referred to as the climatological period or base period, differs for each dataset.
Information on the observed salinity values and their range from these observational time series can be found in the Scottish Coastal Observatory (Bresnan et al., 2016) and Scottish Ocean Climate Status (Hughes et al., 2018) reports.
Because the data collection of salinity is insufficient to resolve the patterns on the scale of SMRs and OMRs, the assessment relies on information from three data collection programmes. In the extended results, information from a large oceanographic database (ODaT) is also included.
The Scottish Coastal Observatory (Figure a) collects salinity samples for laboratory analysis at four locations around the Scottish coast: Stonehaven, Scapa, Scalloway and Loch Ewe. More information on SCObs can be found in Bresnan et al., (2016).
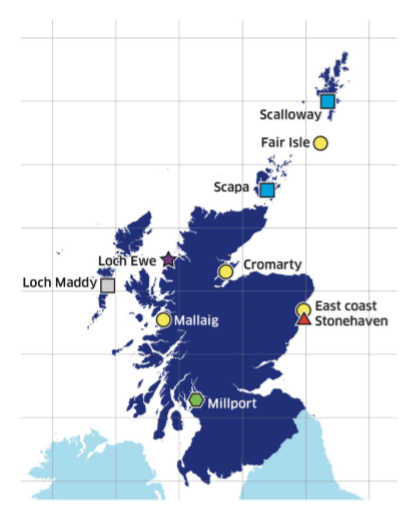
Figure a: Map of monitoring stations in the Scottish Coastal Observatory. The different symbols represent the different combination of parameters measured: yellow circle = temperature only; green hexagon = temperature and phytoplankton; grey square = temperature, salinity, phytoplankton; blue square = temperature, salinity, nutrients, algal toxins, phytoplankton; purple star = salinity, secchi depth, nutrients, pigments, algal toxins, phytoplankton, zooplankton; red triangle = temperature, salinity, secchi depth, nutrients, carbonate chemistry, pigments, phytoplankton, zooplankton. (Bresnan et al., 2016).
The Offshore Monitoring Programme at Marine Scotland Science (MSS) takes salinity measurements at key locations in the UK offshore region, with four key water masses analysed, which reflect the circulation of water around Scotland (Table a and Figure b).
|
Water mass
|
Representative of
|
Description
|
|---|---|---|
|
North Atlantic Water (NAW)
|
Atlantic Water North of Scotland
|
Represents conditions in the warm Atlantic Water that flows along the continental shelf to the North of Scotland.
|
|
Modified North Atlantic Water (MNAW)
|
Atlantic Water around Faroe
|
Represents conditions in Atlantic Waters flowing around Faroes.
|
|
Fair Isle Current (FIC)
|
Scottish Coastal Waters
|
Represents the flow of water into the North Sea, mixed water originating from both offshore and coastal waters.
|
|
Cooled Atlantic Water (CAW)
|
Central North Sea
|
Deeper water in the North Sea, where only the surface waters are warmed up in the summer, and the deeper bottom layers remain with similar properties to the winter before. Late autumn and winter winds will cause mixing of the surface waters to those below.
|
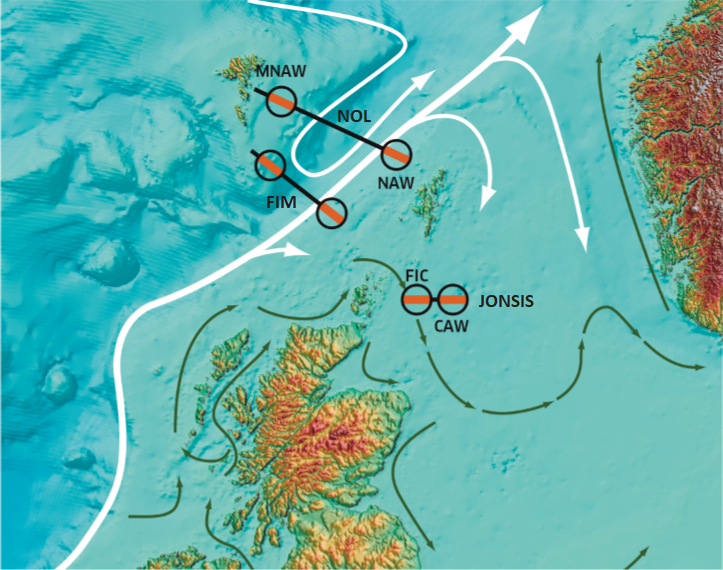
Figure b: Circulation diagram of surface waters around Scotland, showing the position of Marine Scotland Standard Monitoring Sections in the Northern North Sea (NNS) (JONSIS section) and Faroe-Shetland Channel (FSC) (Fair Isle-Munken and Nolso-Flugga sections). Black circles with red highlighting show water mass definition regions. (Hughes et al., 2018)
The IBTS measures near-bed temperatures and salinities in the North Sea during winter time (first quarter of the year, Q1). The time series extends from 1970 to present.
Hughes et al. (2018) investigated salinity variability by SMR using output from the Ocean Data Tool (ODaT) project. This project created a database of historical in situ observations. The underlying historical data were sourced from the World Ocean Database (Boyer et al., 2018) and processed using Hydrobase (Lozier et al., 1995). Information was only available for SMRs from the ODaT project. The ODaT data were provided by Dr Sam Jones (SAMS).
Results
Salinity time series in the offshore regions (Faroe-Shetland Channel and Fladen & Moray Firth Offshore OMRs) show variability consistent with conditions in the adjacent North Atlantic Ocean. After a relatively fresh period in the late 1970s, the Atlantic water masses became significantly saltier in the 2000s, and have recently become fresher again (Figure 2).

These changes are due to changes in the extent and strength of the sub-polar gyre circulation (in the Labrador Sea, Irminger Sea and Iceland Basin) which influences the properties of the Atlantic water masses. When the sub-polar gyre is weak/contracted, the source properties of Atlantic water in our region are more influenced by more saline and warmer waters. All four time series show very similar variability, with exception of the Fair Isle Current where anomalies are less extreme, as the mixing of coastal waters also strongly contributes to the properties of this water mass. No significant trend is observed when looking at the whole dataset in any of the water masses. Over the climatological period there is a significant increasing trend in all water masses, except in the Fair Isle Current water. For the decadal period there is a significant decreasing trend in salinity for all water masses, except in the Fair Isle Current water, see table 4.2b in Hughes et al. (2018).
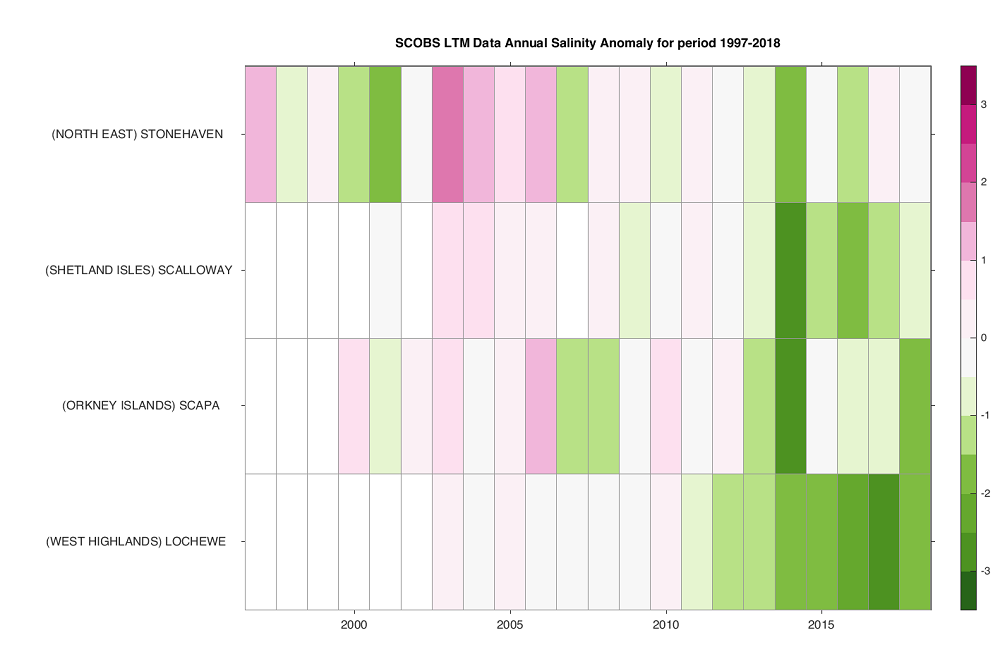
The coastal stations within Scottish Coastal Observatory (SCObs) that collect salinity data (Stonehaven, Scalloway, Scapa and Loch Ewe) have shown a freshening trend in sea surface salinity since 2012 (Figure 3). This is also reflected in the bottom salinity collected from two of those stations – Stonehaven and Loch Ewe (not shown). This is generally in line with the variability observed in the offshore regions, although the coastal time series have more year-to-year variability. Sustained coastal salinity observations are only available from the West Highland (Loch Ewe), Orkney (Scapa), Shetland (Scalloway) and North East (Stonehaven) SMRs. Data collection has started at St Abbs, which will add observations for the Forth and Tay region, but this time series is currently too short for inclusion.
Spatial patterns in the North Sea near-bed salinities are more complex as different processes drive the salinity variability in the northern and southern North Sea. In the northern North Sea, salinity is influenced by the inflow of Atlantic water, whilst in the southern North Sea the freshwater run-off from the UK and Northern Europe, as well as the variability of the Atlantic origin waters contribute to the changes observed. The strong year-to-year and decadal variability makes a long-term linear trend in salinity in the North Sea less useful. The coastal areas generally don’t have a statistically significant trend, and show large changes in trend spatially. These regions have high inter-annual variability due to the impact of freshwater run-off. When looking at variability at key fishing grounds (Figure 4), salinities are generally low (fresh) in the late 1970s/early 1980s (the Great Salinity Anomaly) and since 2014. Increasing salinities are seen through the 1990s with sustained high salinities (especially in regions strongly influenced by Atlantic waters) in the mid-to-late 2000s.
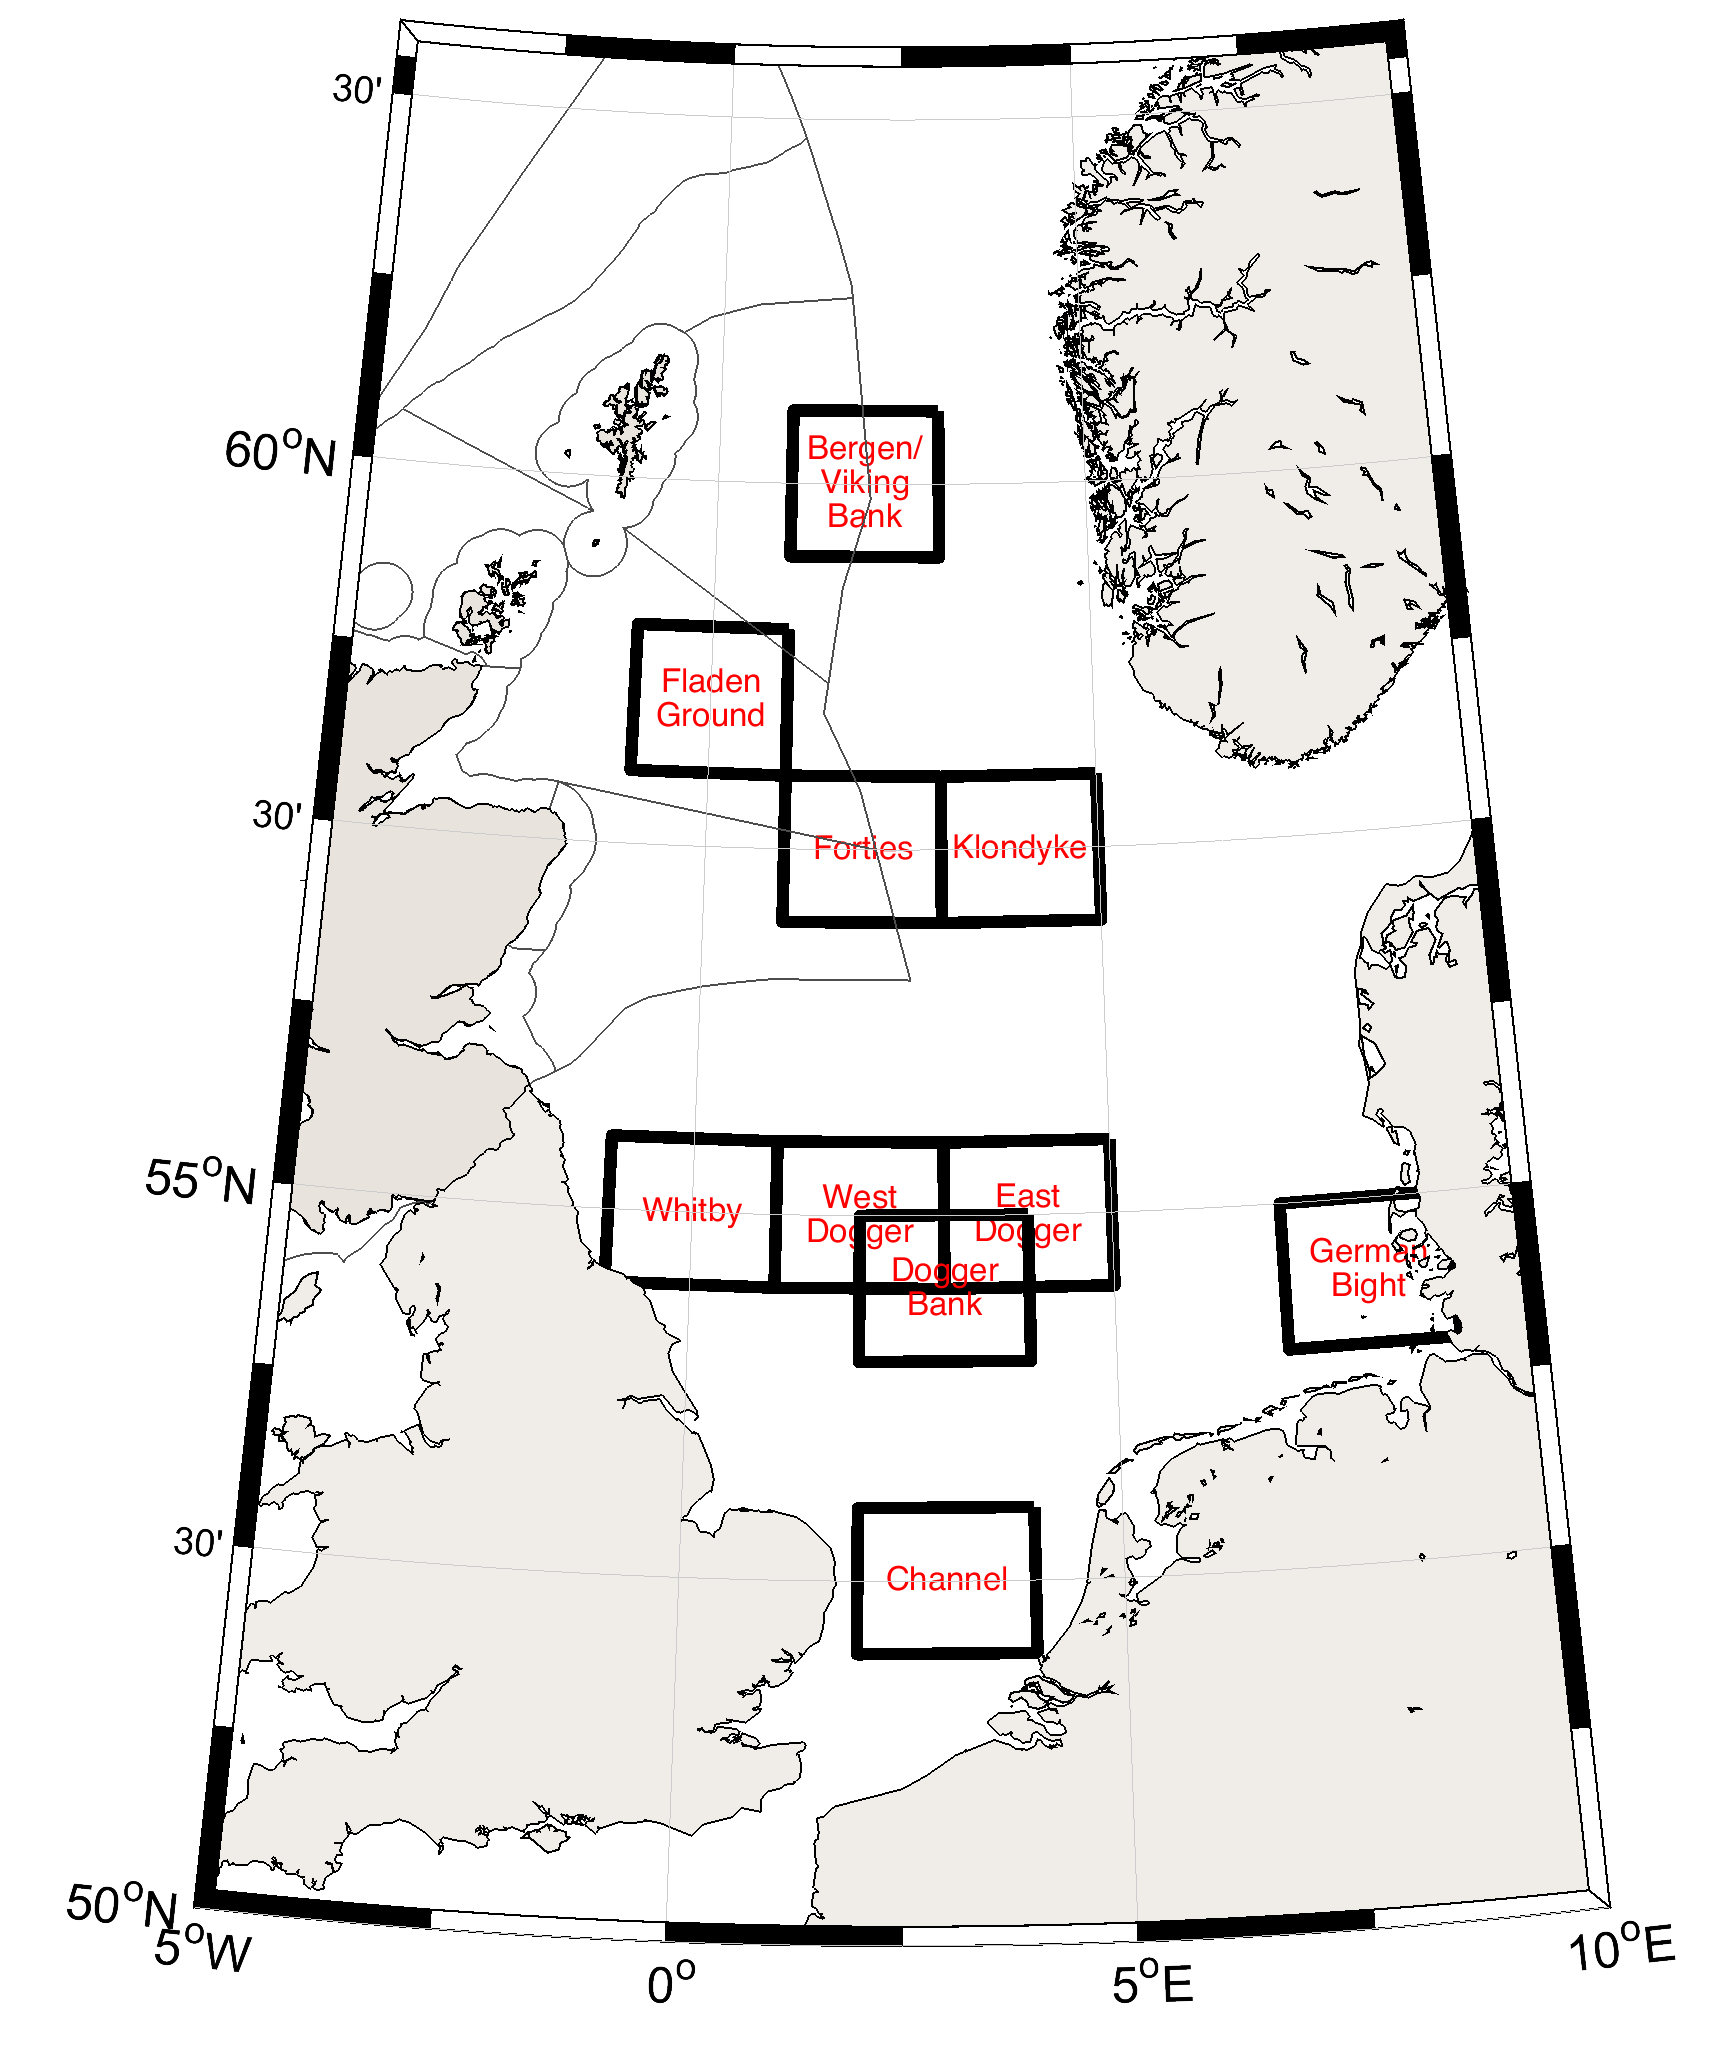

Figure 4: Normalised winter seabed salinity anomalies (right) at key fishing grounds (left) in the North Sea from the ICES IBTS Quarter 1 data for the period 1970–2019. Colour intervals are 0.5 standard deviation units; pinks = positive/saltier; greens = negative/fresher.
The Ocean Data Tool (ODaT) salinity dataset shows variability over the time series in SMRs, but also a general freshening trend in most of the SMRs since 2013.
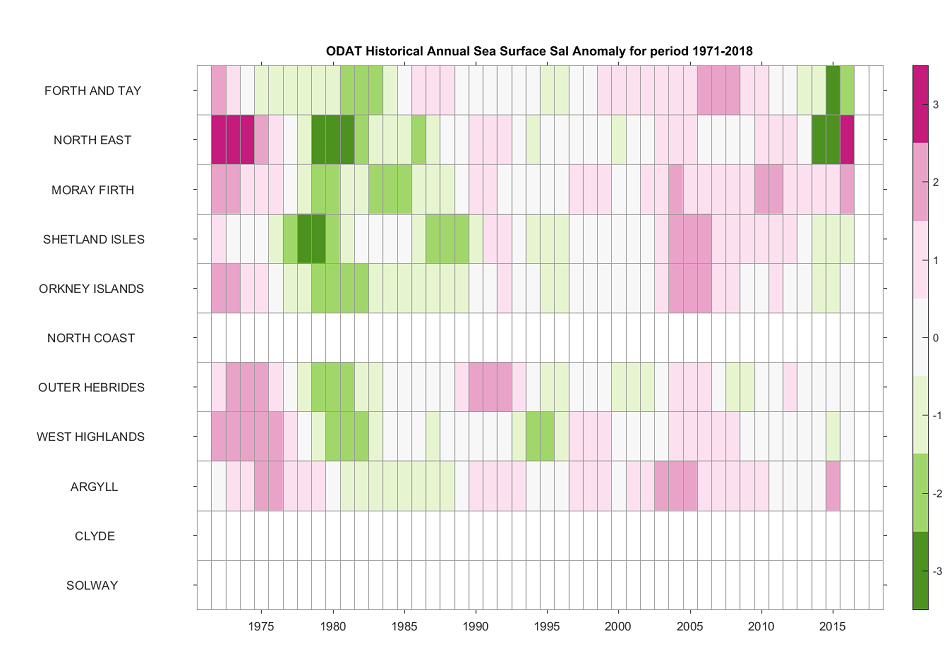
Normalised anomalies of annual average sea surface salinity (relative to 1981–2010 base period) from the ODaT dataset, by SMR. The anomalies are normalised with respect to the standard deviation of each time-series (e.g. a value of +2 indicates 2 s.d. above normal). Colour intervals are 0.5; pinks = positive/saltier; greens = negative/fresher. For this dataset, not enough data are available in the Solway, Clyde or North Coast regions.
The salinity ranges from the ODaT dataset observed in the different regions varies, being heavily influenced by their geographical situation. The Shetland Isles have the highest average surface salinity at 35.23, resulting from the high saline waters of the North Atlantic flowing along the edge of the Scottish Continental Shelf, coupled with very little freshwater input. The lowest average surface salinity is in the Clyde at 33.13, which is a region with large freshwater input flowing into the region, as well as being on the pathway for the advected northward flow of freshwater from the Celtic Seas (values from table 3.2c in Hughes et al. (2018)). On the east coast the large freshwater outflow from the River Tay flows into the Forth and Tay region, giving this region the lowest average surface salinity on this coast of Scotland, at 34.2.
Although the seasonal pattern of salinity is not as obvious as that for temperature, there is still a discernible seasonal cycle, which varies between regions. From the SCObs dataset we see that salinities recorded on the west and north coast reach a maximum over the summer months, and a minimum over the autumn and winter months, whilst at Stonehaven, on the east coast, minimum salinity occurs in spring and maximum salinity in the early autumn. This demonstrates the difference between primarily freshwater influence on the west and north coast driving variability, compared to the Atlantic influence on the east coast.
The patterns observed in the coastal datasets are a reflection of the observations in the offshore and oceanic water masses, although no significant trend was calculated from the full dataset average, or from the decadal average, for any of the water masses.
Conclusion
After a period with above average salinities in the northern North Sea in the mid-2000s to 2010, salinities have recently decreased. This is due to a freshening of the Atlantic water masses due to changes in the sub-polar gyre impacting the source water properties. These salinity changes are also seen at coastal locations, although to a lesser extent as the year-to-year variability is much higher here due to freshwater run-off.
Knowledge gaps
Salinity observations are generally sparse in both space and time, particularly compared to temperature. This affects the confidence that can be associated with determining long-term trends and spatial variability. Data gaps in Scottish waters are particularly focused on the west coast regions and most coastal areas. These gaps can be filled by initiatives such as the profiling float programme (Argo), using under-way measurement systems on ferries and voluntary observing systems, and by integrating computer simulations and new measurement techniques from autonomous technologies and remote sensing.