
Sections
Key message
Background
Atlantic salmon live in fresh water as juveniles before migrating to sea to undertake long migrations to their oceanic feeding grounds in the North Atlantic. As adults they return to the rivers in which they grew up where they then spawn and begin the next generation. Scotland’s native trout populations are more varied and after initial growth in rivers can either remain there or migrate to sea before returning to spawn. Those trout that go to sea are known as sea trout.
Although the coastal areas are used by both Atlantic salmon and sea trout assessment on stocks focusses on the spawning stocks in rivers which will produce the next generation. For Atlantic salmon stock status is assessed by comparing the overall number of spawners to an internationally agreed conservation limit. Assessments are also made at smaller scales, primarily rivers to provide the evidence supporting the management of coastal and inland salmon fishing.
The trends in the estimated number of spawners and the number, age and size of Atlantic salmon returning to the Scottish coasts are also examined.
Assessment of sea trout stocks is more difficult with no equivalent international consensus on methods. The only data available to examine sea trout stocks are the national catch data. Therefore trends in catches over the past 20 years are examined.
Due to their large geographic ranges Atlantic salmon and sea trout are subject to a number of pressures and disentangling the causes of changes in stocks is extremely challenging.
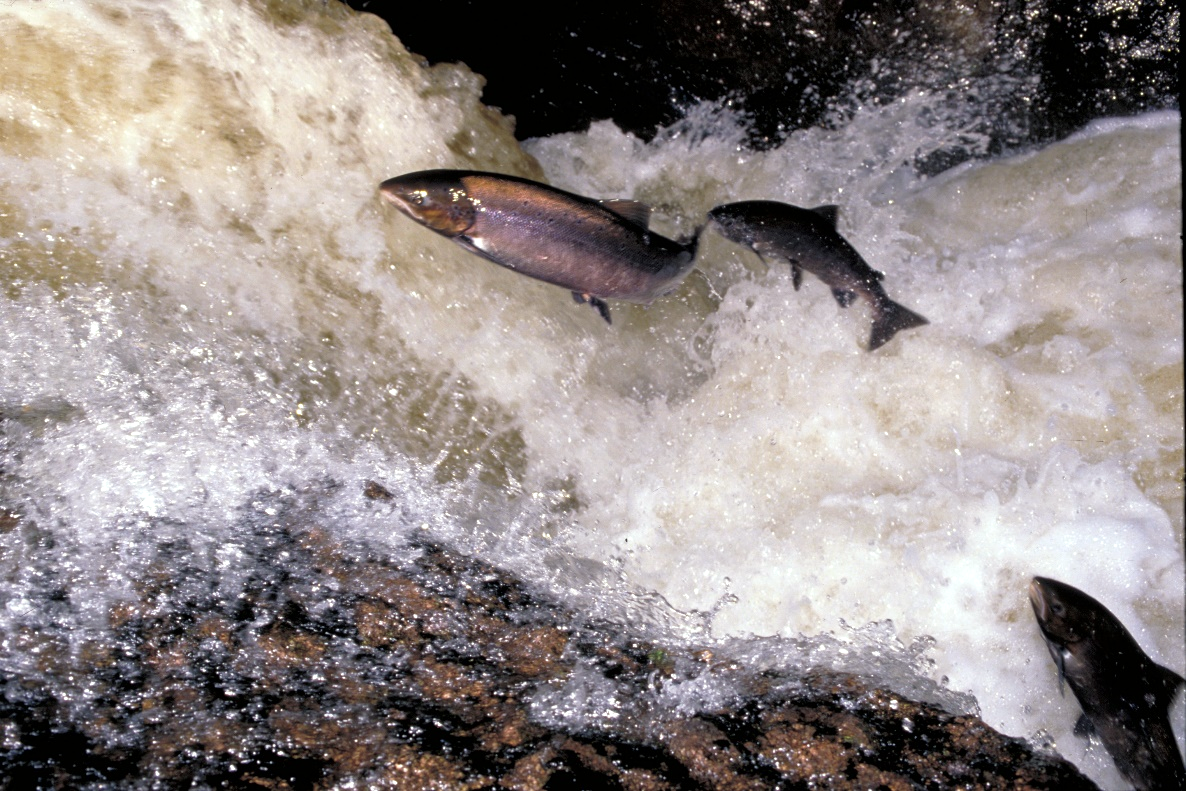

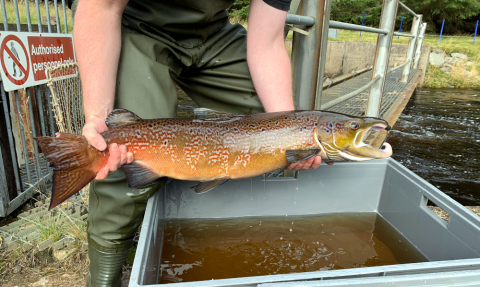
Figure 1: Atlantic salmon (Salmo salar) on their return migration (top) and a Sea trout (Salmo trutta) caught in the rod fishery (bottom).
Salmon
The overall status of Scotland’s salmon stock is undertaken by the ICES Working Group on North Atlantic Salmon (of which Marine Scotland Science (MSS) is a member). The ICES Working Group provides advice to regulate fishing on the high sea, at the Faroes and West Greenland. Details of the methods used by the ICES Working Group are available in its report Working Group on North Atlantic Salmon (WGNAS) (ICES, 2019 a).
The overall assessment is reviewed by members of the ICES Working Group and presented to NASCO (North Atlantic Salmon Conservation Organisation). The methods used to assess individual river stocks have been discussed at the Working Group and are at the beginning of a process of being put forward for formal peer review. Information on the methods used for the river stock assessments are available on the Scottish Government website. These assessments are the best available estimates of salmon stock levels, and reflect changes experienced by salmon in the marine environment.
The assessments rely on:
- Catch data (collected by MSS).
- Counter data (MSS and Scottish and Southern Electricity).
- Flow data (Scottish Environment Protection Agency).
- Size and ages of returning adult salmon (MSS, Tweed Foundation).
As in England, Wales, Ireland and Norway, each stock is assessed by setting an egg requirement for the stock and estimating whether or not this requirement is met. As recommended by the North Atlantic Salmon Conservation Organisation (NASCO) the egg requirement is set to maintain the sustainability of a stock, rather than maximise juvenile output or other alternate measures used by local managers. Numbers of eggs are used as the basis for assessment to account for changes through the season and over the years in biological characteristics such as size of the fish or sex ratio of the stock. Assessments are undertaken for each river, except in those areas where fishery catch cannot be assigned to individual rivers. In such cases, rivers are combined to form assessment groups. The process for each assessable area is summarised below as five steps. These steps are carried out for each of the most recent five years.
Step 1: Converting reported rod catches to numbers of returning salmon
In Scotland there are a small number of rivers with fish counters on their lower reaches which can be used to measure numbers of returning adult salmon directly (Figure a). Hence, for any given month at these sites, there are measures of both counts and catches of salmon. It is then possible to produce an equation (mathematical model) that best estimates the total number of fish for any given catch of salmon.
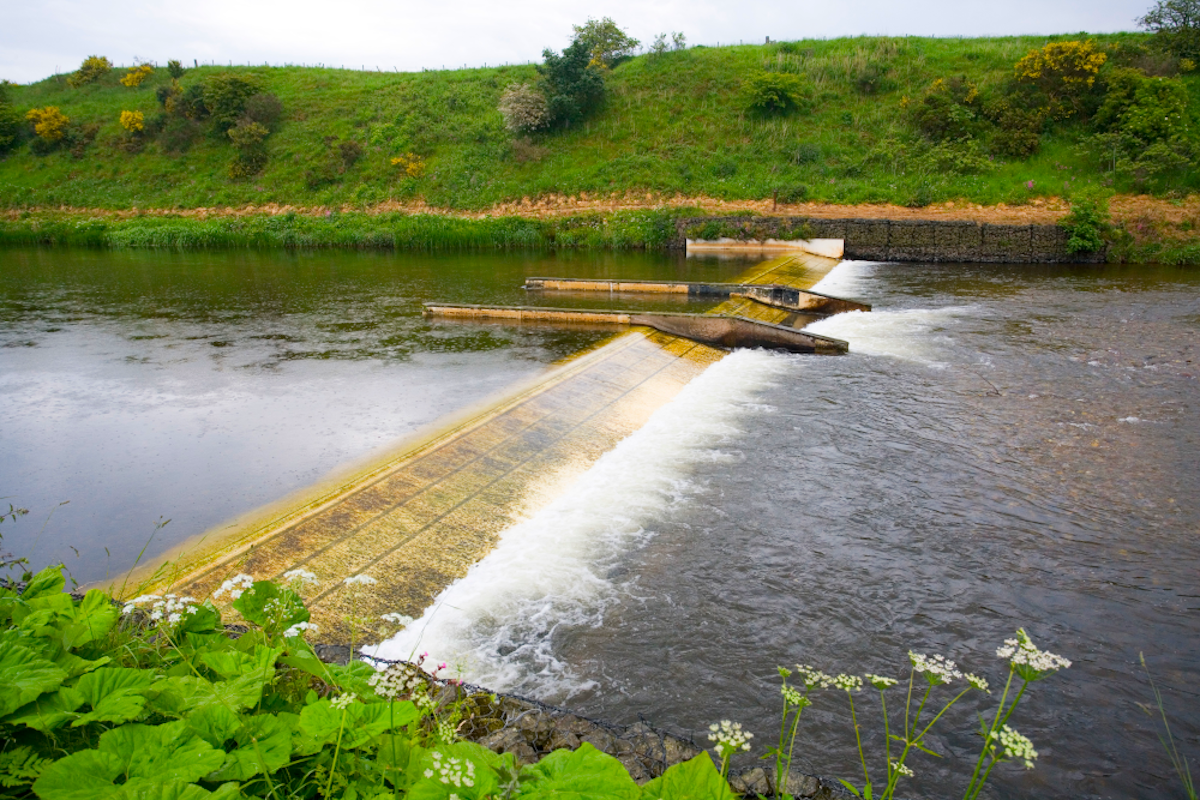
Figure a: Fish counter at Logie on the river North Esk
In common with methods used in other countries, catches of salmon are used to estimate salmon numbers in areas without counters. The model gives a monthly correction factor which is multiplied with catch numbers to estimate the actual number of salmon. The correction factor:
- accounts for changes between months where, for a given count, catches are lower during the summer than during the spring/autumn;
- uses flow to account for changes in angling conditions with salmon shown to be more catchable in higher flows than in low flow conditions. For example, out of 100 fish entering a river during June it is estimated that 4 would be caught in low flow conditions compared to 7 in normal flows and 11 in high flow conditions.
The pattern of catches within the fishing season is then used to estimate numbers returning outside the fishing season.
Step 2: Converting numbers of returning salmon to numbers of spawning females
The total number of returning salmon is then used to determine the number of spawning females. Information on the ages of the salmon is first required due to differences in the proportion of one-sea winter (1SW) and multi-sea winter (MSW) fish that are female.
Information frm 206,498 salmon collected from 42 rivers throughout Scotland between 1963 and 2016 was used to examine how the percentage of female fish in each age class differs with month, year and location. This figure is combined with the estimated number of returning salmon for each river and year to produce the number of returning adults for each age class. These numbers are converted to the number of females using available information from 10 sites throughout Scotland which found that 49.5% of 1SW and 71.4% of MSW salmon were female.
The number of spawning salmon is calculated as the number of returning salmon minus those killed by the rod fishery (all retained fish + 10% of released fish) and minus 9% to account for other in-river mortality factors (e.g. predation, disease).
Step 3: Converting numbers of spawning females to numbers of eggs
The number of eggs produced by a spawning female salmon is related to its size and age. Information on the sizes and ages of 203,950 salmon collected from 39 sites throughout Scotland between 1963 and 2017 was used to estimate the egg content of individual salmon with respect to month, year and location. These estimates of the egg contents of individual females are combined with the numbers of spawning females for each different age/month combination and summed.
Step 4: Egg requirement
The numbers of eggs required to produce sustainable salmon stocks in different rivers was estimated from 11 rivers where information on stock-recruitment relationships was available. Mathematical models of these data were developed to produce egg requirement estimates for areas without stock-recruitment data using information on its geographic location and productivity. Egg requirements are expressed as the number of eggs required for every square metre wetted area of salmon habitat (in order to achieve the maximum sustainable yield). The wetted area available to salmon for each assessable area was calculated using the most up to date information on the distribution of salmon from historical records and recent consultations with local Fishery Trusts and Boards. The wetted area and egg requirement are multiplied together to produce an overall egg requirement for each river.
Step 5: Number of eggs vs.egg requirement
With perfect information, the conservation status would be determined by whether or not the number of eggs deposited by spawning salmon is greater than the egg requirement. However, calculations are complicated by uncertainties in the estimates of the numbers of eggs produced by returning adults, the egg requirement and the area accessible to salmon. Instead these uncertainties are combined to calculate the percentage chance that the egg requirement has been reached for each of the last five years of data and used to determine the status of each river.
- Good conservation status (Grade 1). At least an average (mean) chance of 80% that the egg requirement has been met over the past 5 years.
- Moderate conservation status (Grade 2). An average chance of 60-80% that the egg requirement has been met over the past 5 years.
- Poor conservation status (Grade 3). An average chance of less than 60% that the egg requirement has been met over the past 5 years.
Assessments can only be related to the marine environment at a whole Scotland level. The sub-Scotland level can only be applied on to the rivers themselves. The migration routes of salmon are not known in great detail but there does not appear to be set migration routes followed by salmon when returning to their natal rivers. For example, fish destined for rivers on the east coast have been caught off the west coast and vice versa. The high level of mixing means that it is not possible to estimate the numbers of salmon using the different Sea Areas/sub regions/Scottish Marine Regions.
Information on the sizes and ages of Atlantic salmon is obtained through sampling of catches of commercial netting stations (e.g. Bacon et al. 2009).
The number of juvenile salmon (smolts) migrating from the river North Esk was estimated by a mark, release and recapture technique. A proportion of the smolts leaving the river are caught in a fish trap on the Kinnaber Mill Lade off the lower reaches of the main river. The fish are tagged and released back into the main river above the off-take for the lade. A proportion of the tagged fish is recaptured in the fish trap. This number is used to estimate trap efficiency and the trap catch is adjusted upwards to estimate the total run of smolts from the river.
Sea trout
As sea trout are only one life history strategy of Salmo trutta it has proved more difficult to produce methods to assess their conservations status (ICES (2019 b)). For example, sea trout can be the progeny of the mating of 2 brown trout and it is not possible to determine if a juvenile trout will go to sea or not before just prior to their migration.
To provide some insight into sea trout stocks, the trends in rod catches over the past 20 year are examined. The rod catch tool developed as part of Scotland’s NASCO Implementation Plan was used on annual sea trout catch data (Crawley (2010)). This method examines the trend in the past 20 years of catches and triggers if the pattern is likely to indicate a decline. To use this method to examine stock status makes a number of assumptions, particularly with respect to the relationship between caches and stocks remaining constant. Although imperfect this method provides the best management advice available until other methods are more fully developed.
Results
Salmon
Although there has been a decline in the estimated number of Atlantic salmon returning to coastal waters from their high seas feeding grounds since at least the early 1970s the estimated number of spawning salmon has remained steady over this period, before declining from 2010 onwards (Figure 2). The difference in trends between the two measures is a result of the decline in the removal of salmon by fisheries (Figure 3). Fewer salmon have been returning to the Scottish coast but as fewer have been removed by fisheries the numbers spawning in rivers has remained relatively constant until roughly 2010. The estimated number of salmon returning in 2018 was 44% of the 2011 estimate.
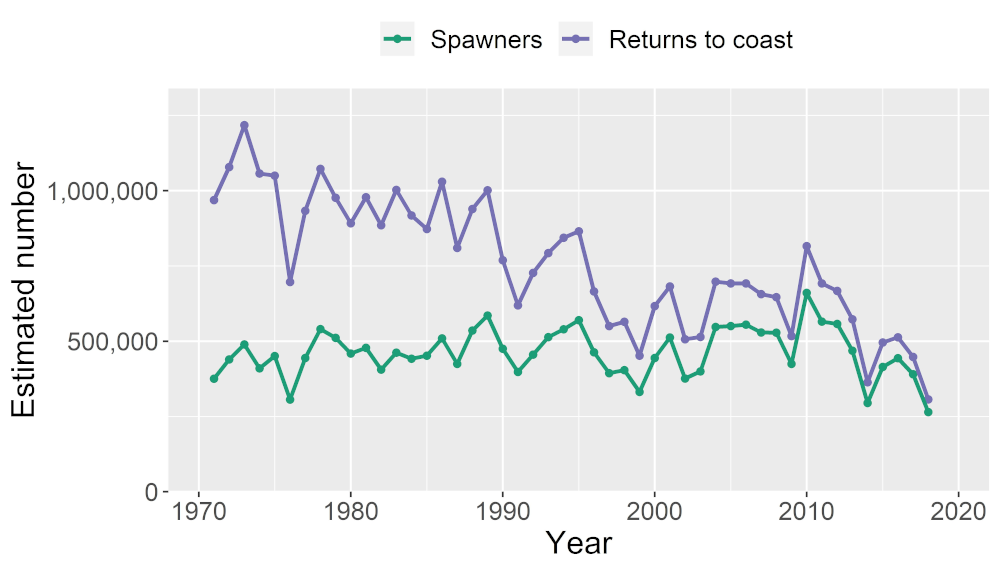
Figure 2: Trends in the estimated number of salmon returning to Scottish coastal waters and the numbers spawning in Scotland’s rivers 1971 - 2018 using data from report to ICES Working Group.
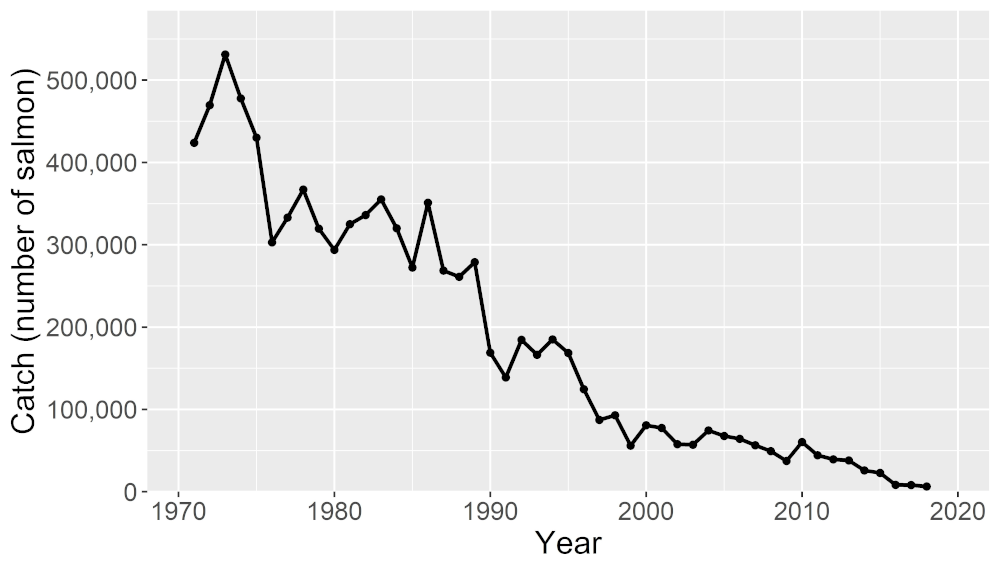
Figure 3: Number of salmon retained in Scottish net and rod fisheries 1971 - 2018.
When viewed on a river by river basis it can be seen that there is a geographic spread in the occurrence of stocks in poor conservation status (Figure 4). There is further information in the extended section.
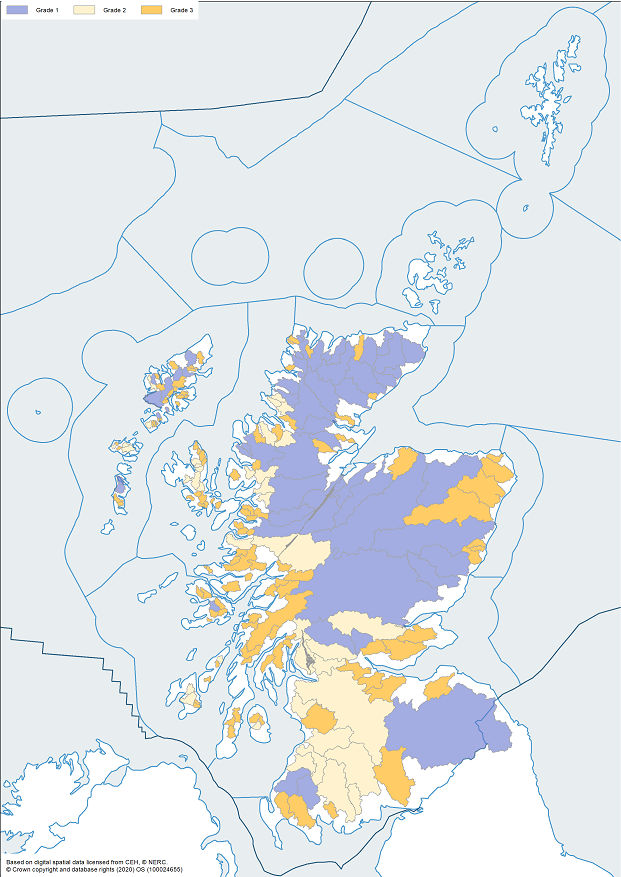
Figure 4: Map showing the Conservation status of the 173 assessment areas in Scotland for the 2019 fishing season. (blue = good conservation status; cream = moderate conservation status; orange = poor conservation status).
Sea trout
Overall rod catches of sea trout in Scotland have shown a long term decline over the period of data collection (1952 - 2018) and are currently at the lowest level recorded (Figure 5). There is further information in the extended section.

Figure 5: Rod catches of sea trout in Scotland from 1952 - 2018. The shaded area highlights the last 20 years which were used to examine trends.
Salmon
Available information suggests that there has been no longer term decline in the estimated number of smolts (young salmon) leaving rivers over this period (Figure b).
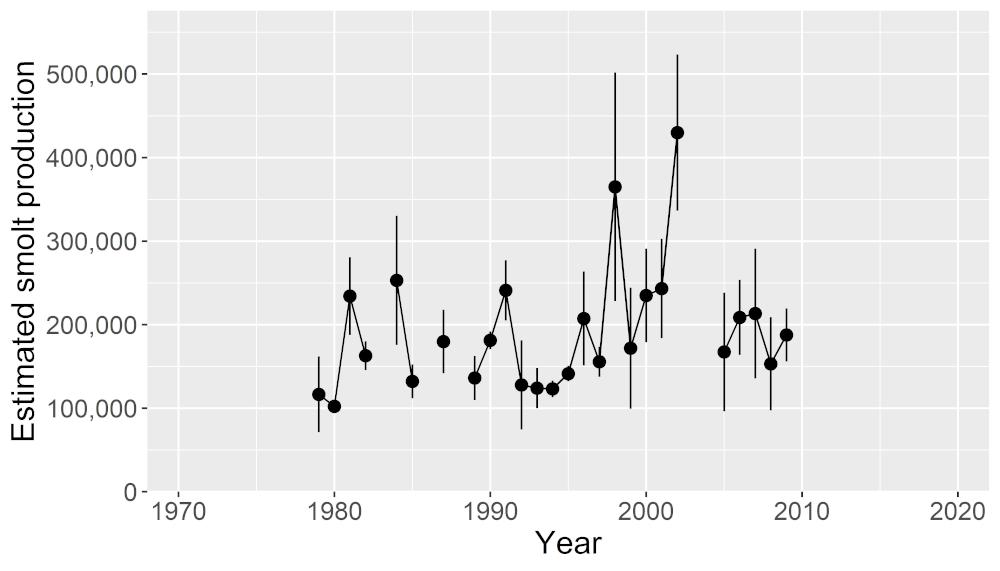
Figure b: Annual Atlantic salmon smolt production estimate for the North Esk during the period 1979-2009. Point estimates and 95% confidence intervals are presented.
For Scotland the number of spawners is currently below the precautionary ICES assessment level (Figure c) and the Scottish stock is classified as suffering reduced reproductive capacity.
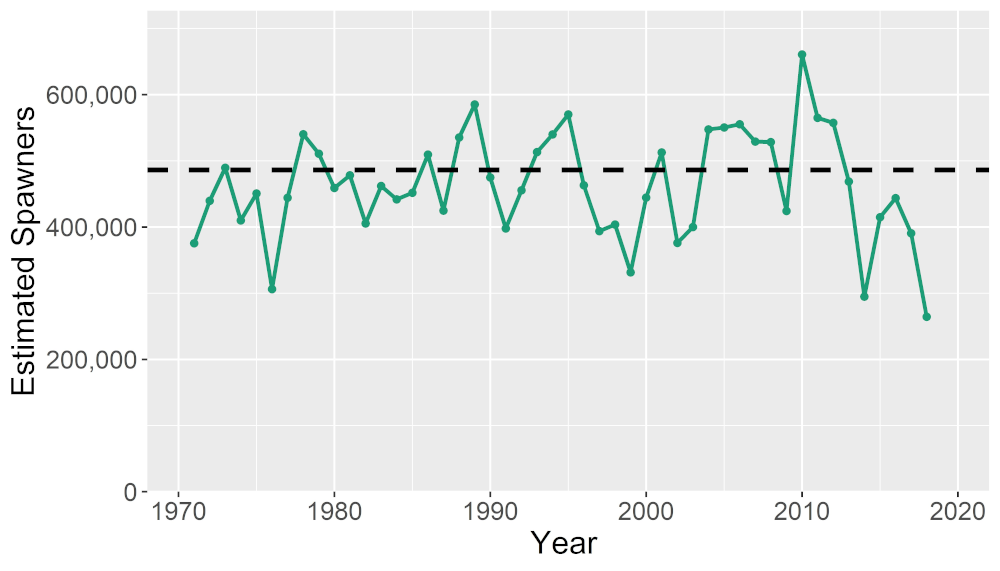
Figure c: Trends in the estimated numbers of salmon spawning in Scotland’s rivers 1971-2018 presented with the Conservation Limit (dashed line set at 486,000). Data from report to ICES Working Group.
Not only are fewer salmon returning to rivers but those that do come back are smaller, with the decline in size beginning in the late 1990’s and being mirrored in various sites in Scotland and internationally (Figure d; Bacon et al. 2009; Bal et al. 2017). Although the exact mechanisms are not understood the decline in the sizes has been linked to changing climatic conditions in the North Atlantic feeding grounds (Todd et al. 2008; Bacon et al.2009). It is the number of eggs produced by spawning salmon rather than only the number of spawners that determines how many salmon will be produced in the next generation. As smaller salmon contain fewer eggs the reduction in the size of returners therefore exacerbates the problems caused by declining numbers of salmon returning to the rivers to spawn (Hanson et al. 2019). For example, on the North Esk in 2018 approximately 125 hen fish were needed to produce the same number of eggs produced by 100 hen fish in 1970.
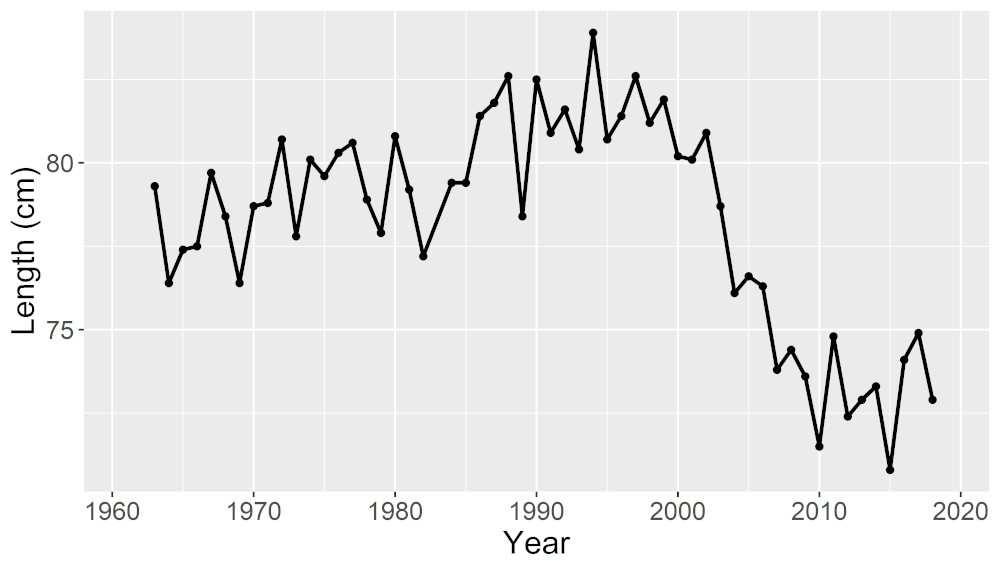
Figure d: Mean length of salmon that have spent 2 winters at sea sampled during July in the North Esk commercial nets 1963-2018.
Sea trout
Four out of 104 fishery districts examined show evidence of declines in rod catches over the past 20 years. Districts showing a decline are spread throughout the country and show no obvious geographic pattern (Figure e).
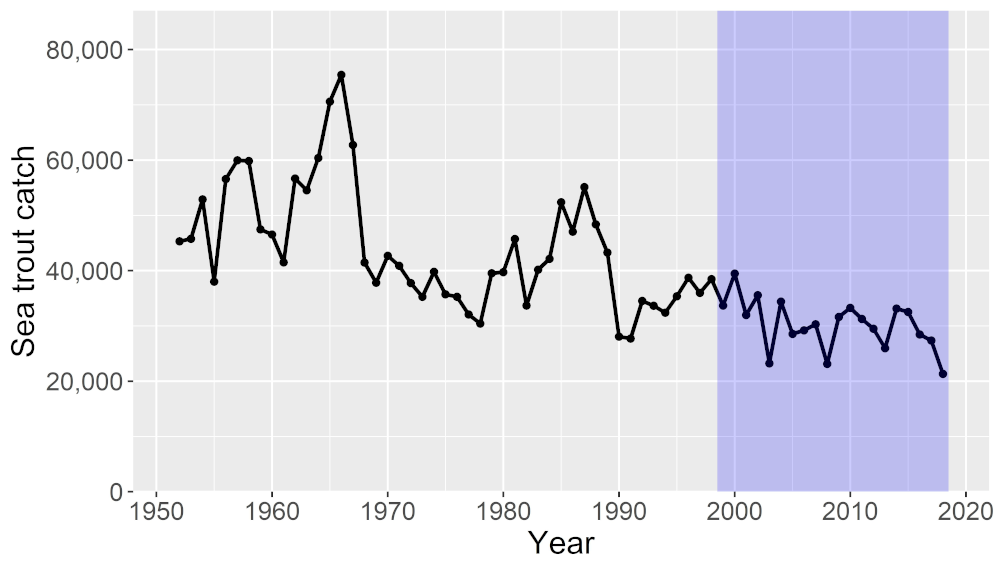
Figure e: Fishery districts where there is evidence of a decline in rod catches over the past 20 years.
Conclusion
The results show that the number of Atlantic salmon returning to Scottish coastal waters has declined over the last 50 years. This is not associated with a reduction in salmon leaving rivers and would appear to be driven by increased at-sea mortality.
Previously declines in coastal returns were compensated for by reductions in commercial net fisheries and by rod fisheries adopting catch and release. However, this buffering capacity has now been fully utilised and post 2011 this decline has had an impact on the estimated number of salmon spawning in Scottish rivers. A reduction in the size of returning salmon, and therefore egg production, has further exacerbated these declines.
The overall stock is below its conservation limit and rivers on the east coast of Scotland tend to do better than rivers elsewhere.
The main driver of changes in Atlantic salmon stocks is occurring in the marine environment, although the observed geographic differences may be the result of local factors.
The best available evidence suggests the overall sea trout stock is at its lowest level since 1952. There is evidence of an overall decline over the past 20 years. Examination on a finer scale shows declines are spread throughout the country.
Wild Atlantic salmon populations are declining across most of their home range (ICES, 2019 a). The decline in salmon populations has occurred despite significant reductions in exploitation. While freshwater factors can be locally important, the lack of evidence of a generalised decline in the freshwater survival or juvenile production (Crozier et al. 2003) suggests that broad scale declines are influenced by a marked increase in the natural mortality of salmon at sea (Chaput, 2012). For many stocks, return rates are now at the lowest levels in the time-series, even after the closure of marine fisheries (ICES, 2019 a). The growth of salmon in the sea has also declined during the same period (Friedland, 1998; Bacon et al. 2009; Bal et al., 2017). Reduced survival and growth are thought to reflect climatic factors and broad-scale changes in ocean ecosystems as well as local factors in freshwater (Olmos, 2019). However, the exact mechanisms behind the declines in survival and growth are poorly understood.
Knowledge gaps
There are a number of gaps that could be filled to increase the salmon assessment's accuracy. However the trends described are supported by independent methods (e.g. counters) and are seen throughout the salmon's range.
The main gaps exist around the exact drivers of changes, which is the subject of a series of Working Groups/Discussions led by ICES. Scottish Government is focussing on high level pressures impacting on salmon.
The assumption that rod catches reflect sea trout stock status is untested, but reflects best available evidence. International efforts are underway to develop methods to assess the status of sea trout stocks.
Status and trend assessment
|
Region |
Status |
Trend |
|
|---|---|---|---|
|
Salmon |
All Scotland |  |
|
|
Sea Trout |
All Scotland | |
This Legend block contains the key for the status and trend assessment, the confidence assessment and the assessment regions (SMRs and OMRs or other regions used). More information on the various regions used in SMA2020 is available on the Assessment processes and methods page.
Status and trend assessment
|
Status assessment
(for Clean and safe, Healthy and biologically diverse assessments)
|
Trend assessment
(for Clean and safe, Healthy and biologically diverse and Productive assessments)
|
||
|---|---|---|---|
 |
Many concerns |
No / little change |
|
 |
Some concerns |
Increasing |
|
 |
Few or no concerns |
Decreasing |
|
 |
Few or no concerns, but some local concerns |
No trend discernible |
|
 |
Few or no concerns, but many local concerns |
All trends | |
 |
Some concerns, but many local concerns |
||
 |
Lack of evidence / robust assessment criteria |
||
| Lack of regional evidence / robust assessment criteria, but no or few concerns for some local areas | |||
 |
Lack of regional evidence / robust assessment criteria, but some concerns for some local areas | ||
| Lack of regional evidence / robust assessment criteria, but many concerns for some local areas | |||
Confidence assessment
|
Symbol |
Confidence rating |
|---|---|
|
Low |
|
|
Medium |
|
|
High |

Assessment regions
 and the Scottish Offshore Marine Regions (OMRs, O1 – O10)")
Key: S1, Forth and Tay; S2, North East; S3, Moray Firth; S4 Orkney Islands, S5, Shetland Isles; S6, North Coast; S7, West Highlands; S8, Outer Hebrides; S9, Argyll; S10, Clyde; S11, Solway; O1, Long Forties, O2, Fladen and Moray Firth Offshore; O3, East Shetland Shelf; O4, North and West Shetland Shelf; O5, Faroe-Shetland Channel; O6, North Scotland Shelf; O7, Hebrides Shelf; O8, Bailey; O9, Rockall; O10, Hatton.
 Regions. These have been used as the assessment areas for hazardous substances.")
, Regions.")