
Background
The amount of litter in the earth’s seas has increased substantially over recent decades and is of international concern. Such litter harms sea-life, has economic consequences, and is a risk to human safety. Of particular concern are persistent plastics, which may float, remain in suspension, sink to the sea-floor, or be ingested by marine life. This litter originates from human activities at sea and on land.
The monitoring of litter on the sea-floor is required under international agreement and domestic legislation. Additionally the United Nations (UN) General Assembly Sustainable Development Goals, which the Scottish Government is incorporating into its National Outcomes, aspire to prevent and significantly reduce marine litter.
Counts of the number of pieces of marine litter, collected during trawls for sea-floor living fish, are available from scientific expeditions carried out by the Scottish Government’s Marine Research Vessel (MRV) Scotia between 2012 and 2018 inclusive. These data are supplemented with similar data from the research vessels of other nations operating within a similar area. The litter data have been statistically analysed to generate information on the density of sea-floor litter in the seas around Scotland.
Marine litter has been defined as: “any persistent, manufactured or processed solid material discarded, disposed of or abandoned in the marine and coastal environment”. The definition goes on to include items used on land and transported to the sea through rivers, sewage, storm-waters and wind (UNEP, 2005).
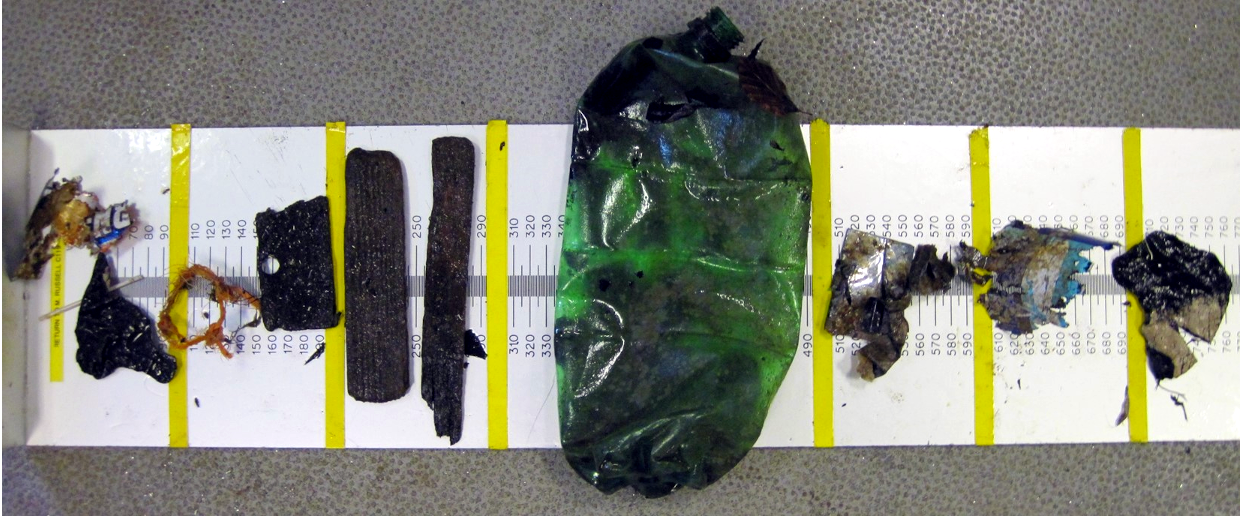
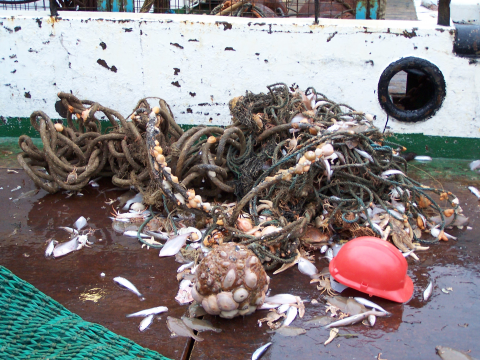
Figure a: Confectionery wrapping, cotton bud stick, plastic bottle, ‘twine’ and plastic film recovered during trawls of MRV Scotia
Marine litter, to which plastics make a substantial contribution, has been observed throughout the marine environment including areas distant from human population centres (reviewed by Galgani, Hanke & Maes, 2015). Initial concerns regarding the presence of plastics in the marine environment were expressed many decades ago (reviewed by Ryan, 2015) and a prohibition on their disposal at sea adopted as part of Annex V of the International Convention for the Prevention of Pollution from Ships 1973, as modified by the Protocol of 1978. This came into force in 1988 and has subsequently been amended to prohibit the disposal of all ‘garbage’. More recent international, regional and national instruments pertinent to marine litter around Scotland include:
- the Convention for the Protection of the Marine Environment of the North-east Atlantic (OSPAR) which requires signatory nations to take action to prevent and eliminate pollution from land-based sources, and
- the UN General Assembly Sustainable Development Goal 14 which requires the prevention and significant reduction of marine debris by 2025.
The United Kingdom is required to monitor sea-floor litter, both as a signatory of OSPAR and, currently, to comply with the European Union Marine Strategy Framework Directive. Monitoring activities are devolved to the Scottish Government.
Description of data
Available sea-floor litter data were downloaded from the International Council for the Exploration of the Sea (ICES) Database of Trawl Surveys (DATRAS) as ‘Litter Exchange Data’ products on 15 April 2020. The downloaded data comprised the North Sea International Bottom Trawl Survey (code ‘NS-IBTS’), the Scottish West Coast Groundfish Survey, (‘SCOWCGFS’) and the Scottish Rockall Survey (‘SCOROC’).
The data comprise counts of observed litter items recovered from the trawling gear of ICES coordinated international scientific survey trawls assessing commercial demersal fish stocks. Potentially relevant data from the Irish Groundfish Survey (‘IE-IGFS’) and beam trawl survey (‘BTS’) were not downloaded, the former because they do not include counts of litter items, and the latter because they are obtained using a different trawling gear. Litter items are additionally categorised into types and linked to the date of trawl, trawl shoot and haul coordinates, distance of trawl, wing-spread of gear, and sampling nation.
Trawls east of -4° longitude, hereafter referred to as ‘east-coast trawls’ and available using survey code ‘NS-IBTS’, are from spatially stratified grids of 1° longitude and 0.5° latitude. Several nations, including Scotland, contribute to this survey and participants annually sample one of several possible localities within pre-allocated grids.
Trawls west of -4° longitude, hereafter referred to as ‘west-coast trawls’ and available using survey codes ‘SCOWCGFS’ and ‘SCOROC’, are from semi-randomised locations within a series of a priori strata. These surveys are undertaken by Scotland. The spatial coverage of the west-coast trawls is not as complete as the east-coast trawls. Further details of the survey designs are available (ICES, 2012, 2017).
Trawls undertaken by MRV Scotia, which nominally occur at depths of between 20 and 500 m, are 30 minutes long and utilise Chalut de Fond Grande Overture Verticale (GOV) 36/47m gear, including an eight metre long cod end lined with 20 mm mesh. Different ground-gear are used for the west-coast (ground-gear ‘D’) and east-coast trawls (ground-gears ‘A’ and ‘B’). Further details of the gear are available (ICES, 2012, 2017). The area swept by each trawl, calculated from the distance of a trawl and wingspread, averaged 64 m2 and included a minimum of 22 m2 and a maximum of 85 m2.
The litter from each trawl was processed in accordance with the ICES recommendations current at the time. Currently, this involves visually checking the fish catch and gear for items of litter which are then placed into baskets. The litter items are then categorised and counted into litter categories as a subtype of one of ‘plastic’, ‘metal’, ‘rubber’, ‘glass/ceramics’, ‘natural products/clothes’, or ‘miscellaneous’ (ICES, 2018).
The plastic category includes the subtypes of ‘bottle’, ‘sheet’, ‘bag’, ‘caps/lids’, ‘fishing line (monofilament)’, ‘fishing line (entangled)’, ‘synthetic rope’, ‘fishing net’, ‘cable ties’, ‘strapping bands’, ‘crates and containers’, ‘plastic diapers’, ‘sanitary towels/ tampon’, and ‘other’ (ICES, 2018). While several pieces of litter are counted as a single item if they are ‘known’ to have originated from a single object (e.g. a broken glass bottle for which the parts fit together), they are counted as separate items even if they are ‘suspected’ of having derived from a single item. An exception to this are entangled litter which are counted as a single item and assigned to the dominant litter subtype (Figure b). Counts include individual pieces of ‘twine’ used to mend the gear and displaced during the trawl.
The absence of litter in a trawl is explicitly noted and, therefore, all trawls regarded as ‘valid’ provide information on the presence, counts and categories of litter. An effort is made to ensure that procedures remain consistent over time and between personnel. On return to base (Marine Scotland Marine Laboratory, Aberdeen) the litter data are quality checked and submitted to ICES for inclusion into DATRAS at the individual litter item level.
The trawl and counting procedures are specified by ICES Marine Litter Working Group guidelines (ICES, 2018). Differences in procedure between nations arising from different implementations of the ICES guidelines occur.
 counted as a single item of ‘synthetic rope’.")
Litter counts are obtained from scientific surveys with the primary purpose of fish stock assessment, rather than being specifically designed to estimate sea-floor litter densities. Trawls are only undertaken at localities where demersal fishing is practical, omitting deep seas, coastlines and rocky areas. The gear is designed to sample demersal fish and will underestimate, at the very least, litter items less than the gear mesh size as these will likely pass through the trawl net. Additionally, the different ground-gears will have different litter capturing capabilities.
Data preparation
The downloaded data were assembled and prepared for analysis within the R statistical environment version 3.5.2 (R Core Team, 2018), accessing geographic information system capabilities with the supplementary R package rgdal version 1.3-9.
Data for 2012 to 2018 inclusive within a modelling area comprising a polygon of minima and maxima longitudes -16° to 7.4° and latitudes 54° and 64° were retained for analysis (Figure c). Data for 2019 and 2020 were excluded because they were not yet sufficiently complete. The modelling area incorporates all MRV Scotia east-coast and west-coast trawl localities, and includes the Scottish Zone which constitutes the primary focus of the analysis (Figure c). The Scottish Zone is defined as the sea adjacent to Scotland (Great Britain, 1998) within an area defined by The Fishery Limits Act 1976 (Great Britain, 1976), as amended by relevant Fishery Limits Orders (Great Britain, 1997, 1999). Data from the east-coast trawls of other nations within the modelling area were also retained.
Further data edits prior to analysis comprised:
- deleting trawls flagged within ICES DATRAS as ‘invalid’;
- deleting scientific surveys, comprising nation and year quarter combinations, failing to record trawls containing no litter;
- the trawls of some non-UK nations for some years utilise a previous litter categorisation scheme. An algorithm identifying these and converting them to the current scheme (ICES, 2018) was used to improve the consistency of litter categories;
- litter counts from different litter categories were aggregated to the relevant trawl;
- the area swept by each trawl was calculated as the product of the distance of each trawl and the wingspread of the GOV gear;
- the midpoint of each trawl was estimated from shoot and haul coordinates and used to characterise the location of the trawl;
- trawl locations were converted from coordinates to isotropic grid references.
The edited data comprises 2,484 trawls within the modelling area of which 1,635 are within the Scottish Zone (Figure c). Within the modelling area, 79% of trawls were undertaken by MRV Scotia. Additional trawls, also using GOV gear, were undertaken by England (13%, 2012 to 2014 and 2016 to 2018), Denmark (5%, 2014 to 2018), France (1%, 2015 and 2017 to 2018), The Netherlands (1%, 2015 and 2016) and Sweden (<1%, 2018).
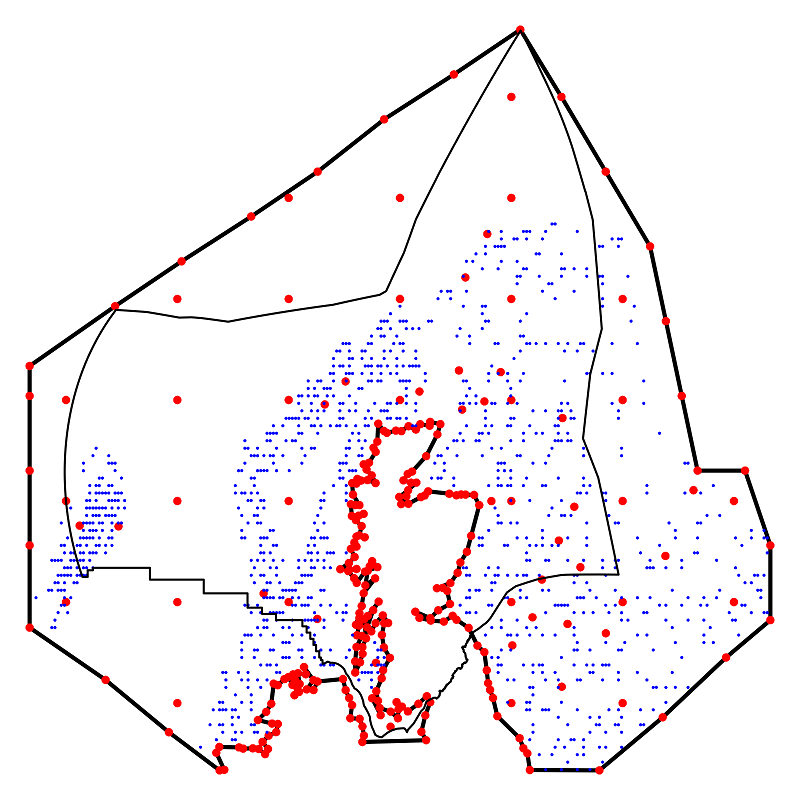
Figure c: Isotropic statistical model set-up.
The modelling area is denoted by a thick continuous boundary line, the Scottish Zone by a thin continuous boundary line, the midpoint of trawls from 2012 to 2018 inclusive by small blue points, and ‘knots’ around which the smooths are based by larger red points.
Descriptive statistics
A table comprising a total of counts and percent relative frequency for each litter category within the Scottish Zone across the years 2012 to 2018 inclusive was prepared.
Inferential statistics
Statistical modelling was used because it generates estimates of sea-floor litter density throughout the Scottish Zone.
The data for nine valid trawls were deleted prior to statistical modelling. These trawls were for nation and year combinations contributing fewer than 10 trawls within the modelling area. The rationale for these deletions is that statistical estimates of nation effects, used to standardise for potential methodological differences in the propensity of nations to detect litter, would have been poor.
The spatial variation in litter densities was modelled using a generalized additive mixed-effect model utilising soap-film smoothers (Wood, Bravington & Hedley, 2008). This approach avoids smoothing litter densities across the land-mass of the north of Great Britain. The modelling area and ‘knots’ are presented (Figure c).
Statistical modelling involved fitting the dependent variables of litter item count for each trawl and the area swept by each trawl, generating a density. Counts were modelled because they represent a richer source of information than presence/absence. Mass was not used because occasional large items composed of dense material dominate, generating less informative and less tractable analyses. Separate models were fitted for each year.
The full statistical model comprised:
 |
where yij = count of items at location i trawled by nation j assuming error distribution Pois(yij); aij = area trawled at location i by nation j; β0 = estimated fixed effect intercept; f = estimated spatial smoother functions f across locations xi; β1 = estimated fixed effect of nation xj relative to MRV Scotia; and uij = random effect of unexplained variation at location i by nation j. Maximum likelihood estimates of β0, β1, f, integrated over random effect ui using the Laplace approximation, were calculated within the R supplementary package gamm4 0.2-5 (Wood, 2017). Model outputs were used to generate annual predicted sea-floor litter densities (km-2) within the Scottish Zone. Modelling precisions were estimated as the inverse of predicted density coefficients of variation, and are relative to the median precision across all years. Additionally, a policy relevant spatial summary plot, averaged over 2016 to 2018 inclusive to reduce the impact of annual variations, was generated. Averages are weighted mean densities, with weights comprising the inverse of the variance of annual densities. The summary plot is for 2016 to 2018 inclusive only because this is the period most relevant to present policy.
Annual mean litter densities and percentile 95% confidence intervals were estimated for the Scottish Zone and those parts of five biogeographic regions (United Kingdom Marine Monitoring and Assessment Strategy, 2010) within the Scottish Zone. These comprise a part of the Northern North Sea, the Atlantic North-West Approaches, the Scottish Continental Shelf, the Minches and Western Scotland, and a part of the Irish Sea. The 95% confidence intervals were estimated using a parametric bootstrap (Efron, 1979) utilising the lpmatrix option of the gamm4 predict function. Biogeographic regions were used in preference to Scottish Marine Regions (Scotland, 2015) because sampling locations are not optimal for coastal areas and it is uncertain to what extent the statistical smoothers are able to adjust to local differences.
Temporal trends from 2012 to 2018 inclusive for the Scottish Zone and each constituent biogeographic region were estimated using a weighted linear mixed models. The model comprised:
 |
where yi = the annual mean predicted density for the relevant region in year i assuming error distribution ~N(0,σi2). The value of σi is the standard deviation of the annual mean predicted density estimated from the previous analysis and is assumed to be known; β0 = estimated fixed effect intercept; β1 = estimated coefficient of linear trend over years xi; ui = estimated random effect of year; εi = unexplained variation of year i estimated from the previous bootstrap analysis. The model was fitted by residual maximum likelihood (Patterson & Thompson, 1971). Plots for the Scottish Zone and each biogeographic region were generated.
Values of p are interpreted as a level of support for ‘no-effect’ and are regarded as ‘statistically significant’, indicating a lack of support for the null hypothesis, if no greater than 0.050.
Results
A total of 1,533 items of litter were recorded from the 1,635 sea-floor trawls in the seas around Scotland between 2012 and 2018 inclusive. Litter was observed in 44% of trawls, which usually contained one (53%) or two (24%) items with a maximum of 18. The majority of litter items (74%) were categorised as plastic (Table 1).
|
Category |
Number |
Percentage |
|
Plastic |
1,135 |
74 |
|
Rubber |
127 |
8 |
|
Natural products & clothes |
92 |
6 |
|
Metals |
90 |
6 |
|
Glass & ceramics |
16 |
1 |
|
Miscellaneous |
73 |
5 |
A spatial map of averaged modelled sea-floor litter densities in the seas between 2016 and 2018 inclusive is presented in Figure 1. The results indicate that:
- the highest densities occur in the North Sea;
- the lowest densities occur off-shore to the west of Scotland.
It is likely that additional spatial changes in density are, to at least some extent, a consequence of the different trawl ground-gears used for sampling and/or statistical modelling artefacts such as edge effects.
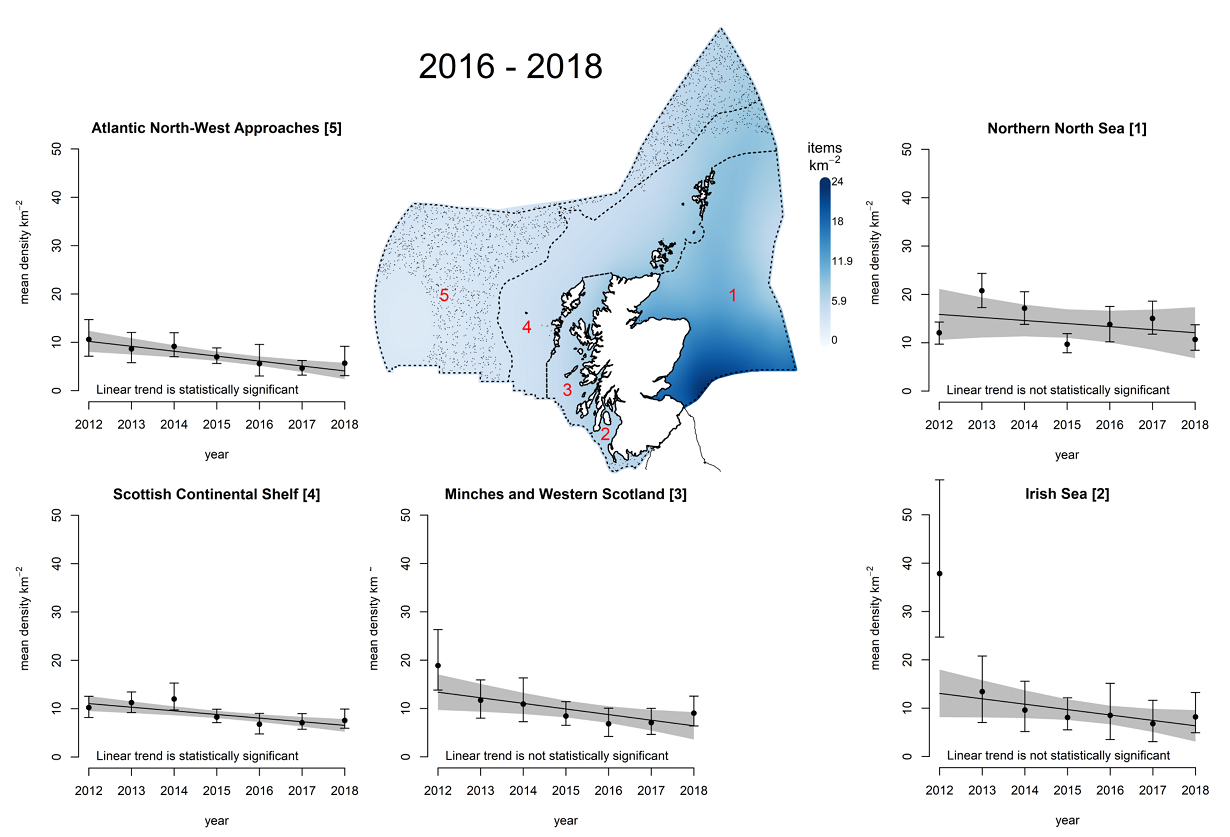
Figure 1: Sea-floor litter densities (items km-2) for the Scottish Zone.
The spatial map shows modelled sea-floor litter densities averaged over 2016 to 2018 inclusive, with biogeographic regions denoted by dotted internal boundaries, and areas distant from survey trawls by stippling. The temporal graphs show changes in modelled average density with 95% confidence intervals for each region from 2012 to 2018, together with a linear trend over time with 95% confidence intervals.
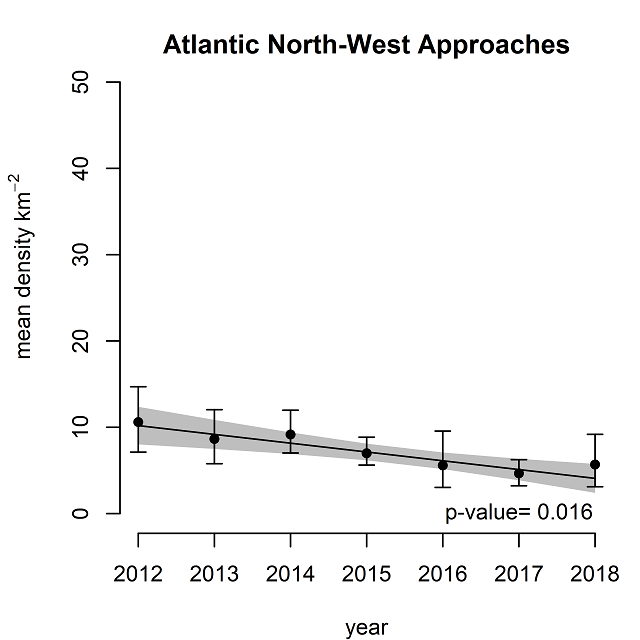
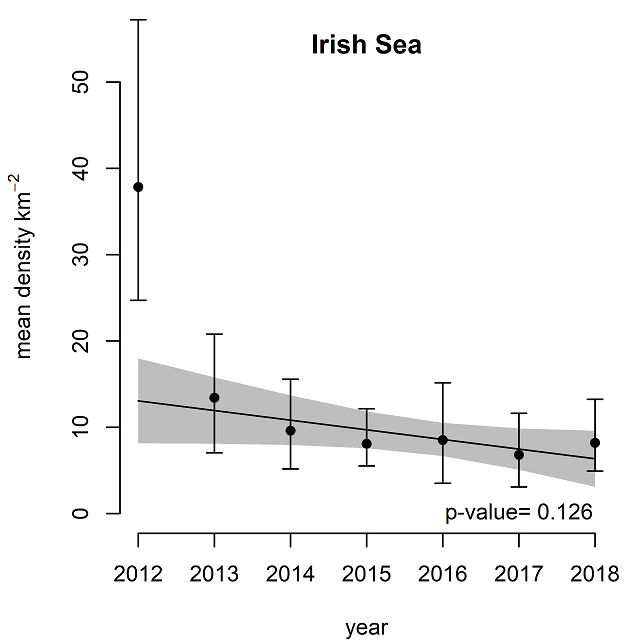
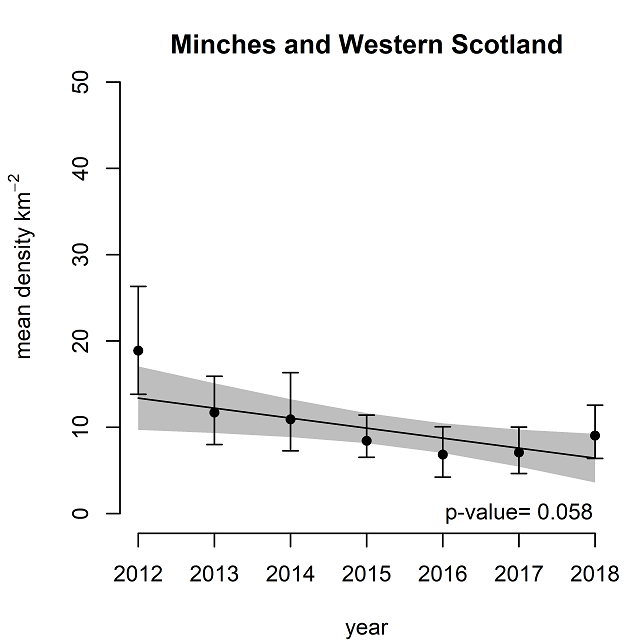
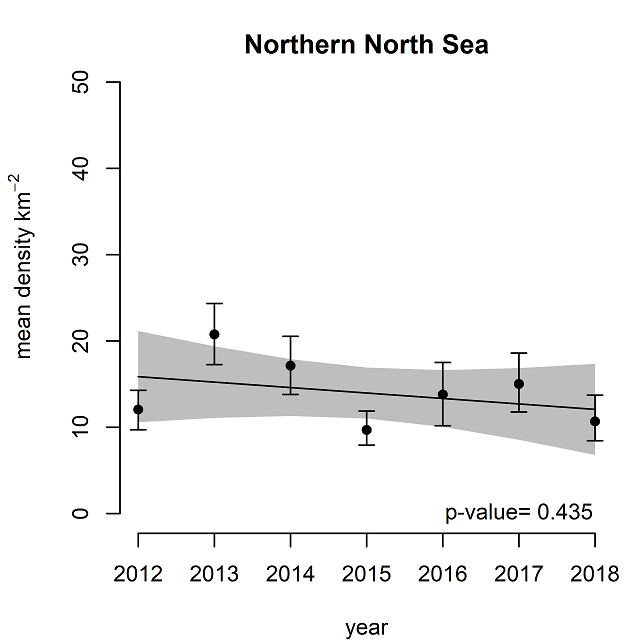
Temporal graphs of annual average modelled sea-floor litter densities, with a measure of uncertainty, for each of five areas in the seas around Scotland are presented (Figure 1). These indicate apparent decreases in sea-floor litter density over time for the Scottish Continental Shelf and Atlantic North-West Approaches. The reasons for these apparent decreases over time are not known. Some possible explanations include decreased litter inputs relative to degradation and removal, fragmentation of litter to sizes less efficiently captured and/or retained by the trawl gear, transport of litter to areas which are not surveyed, and, given the short time-frame, an artefact of sampling and/or analysis.
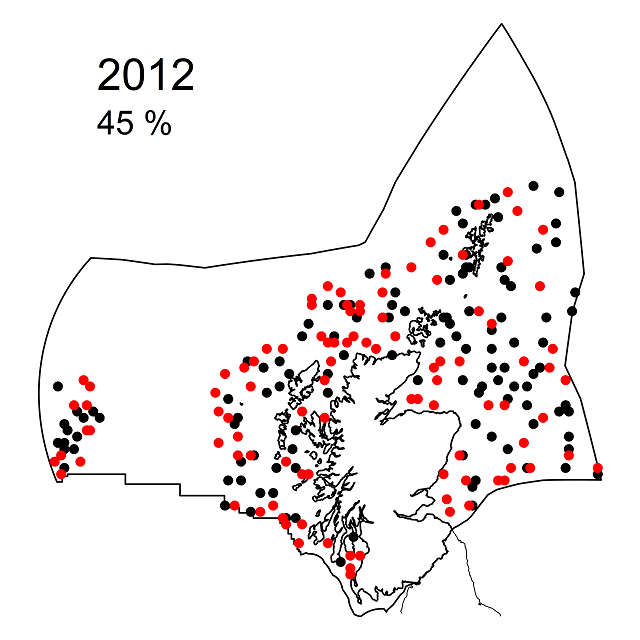
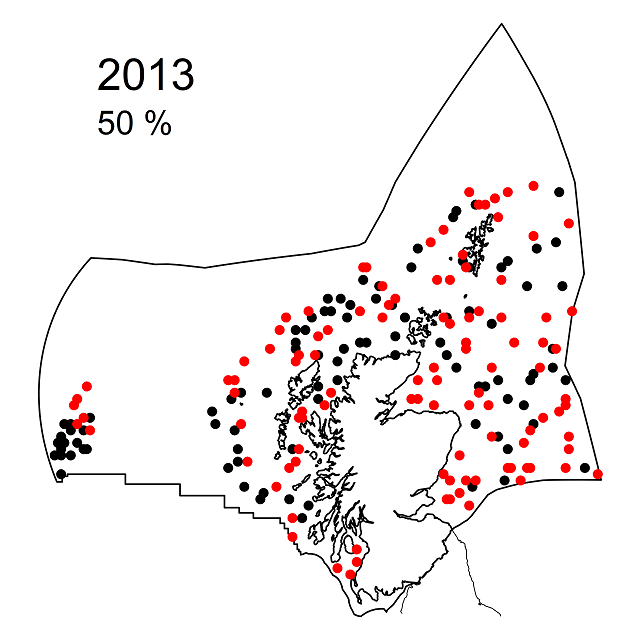
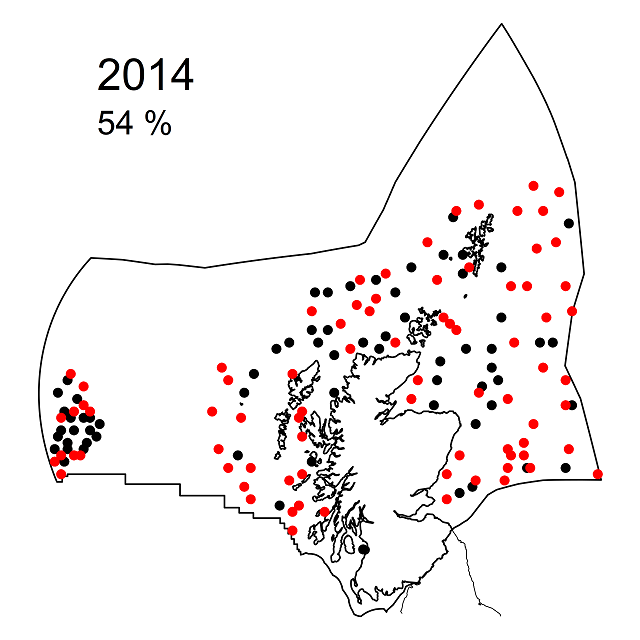
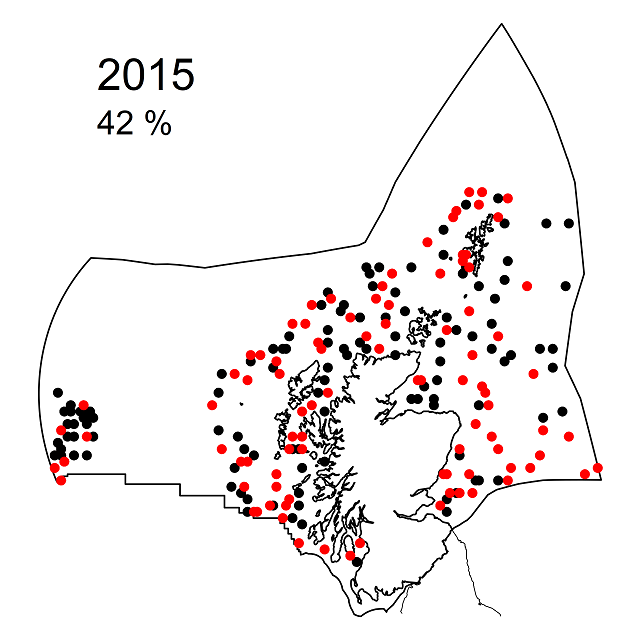
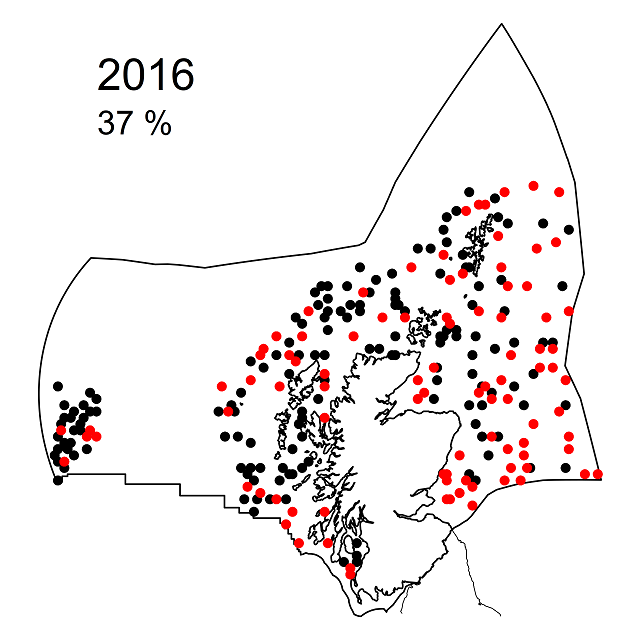
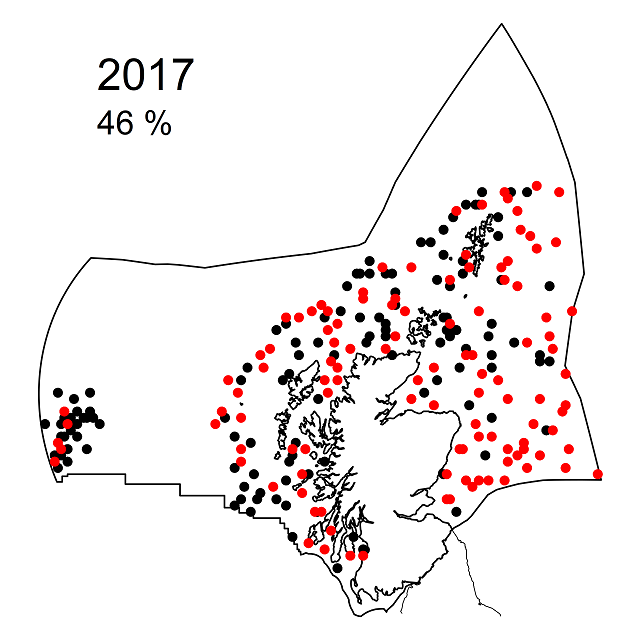
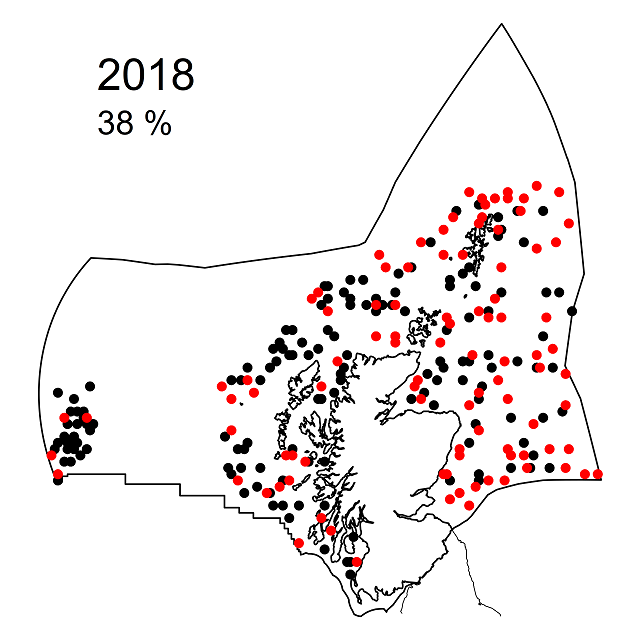
At least one piece of litter was observed in 44% of sea-floor trawls throughout the Scottish Zone from 2012 to 2018 inclusive. Annual values ranged from a minimum of 37% in 2016 to a maximum of 54% in 2014. Sea-floor litter is widely distributed and it is not possible to discern spatial or temporal changes from this summary data (Figure d).
 |
 |
 |
 |
 |
 |
 |
|
Figure d: Observed presence (red dots) or absence (black dots) of litter in Scottish Zone (outer boundary) sea-floor trawls for the years 2012 to 2018. Percentage values are the relative frequency of trawls containing at least one piece of litter. |
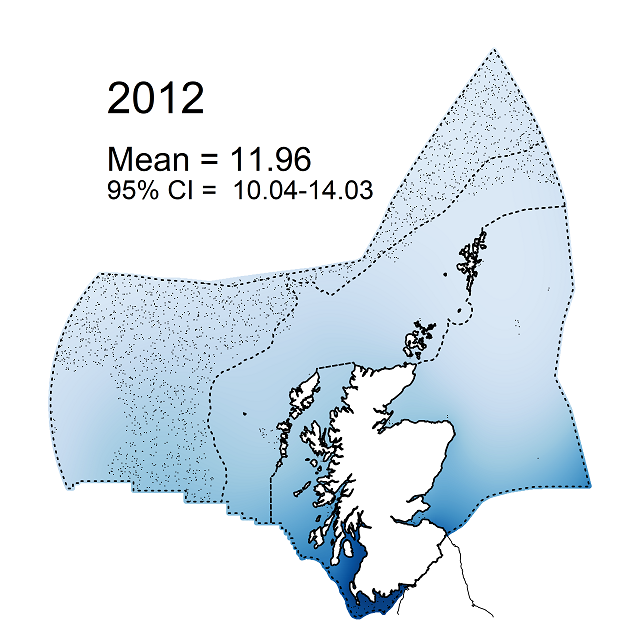
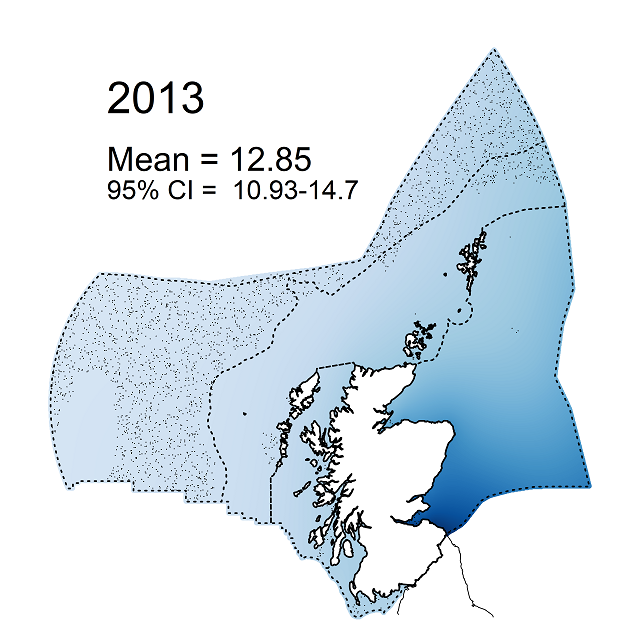
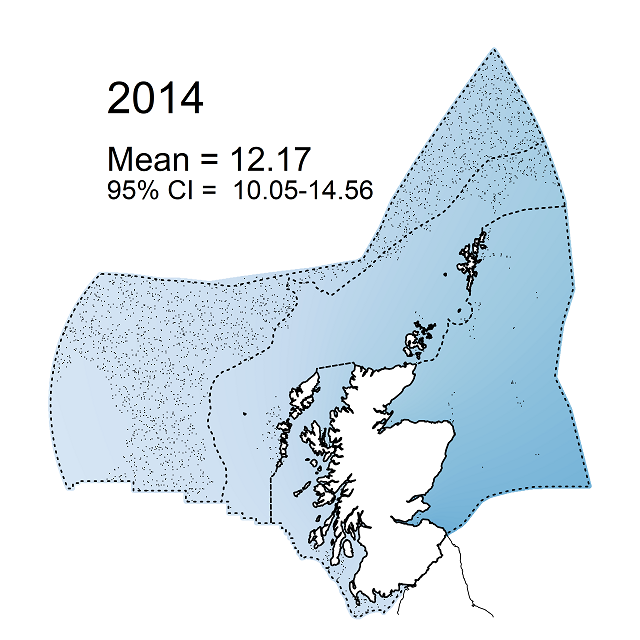
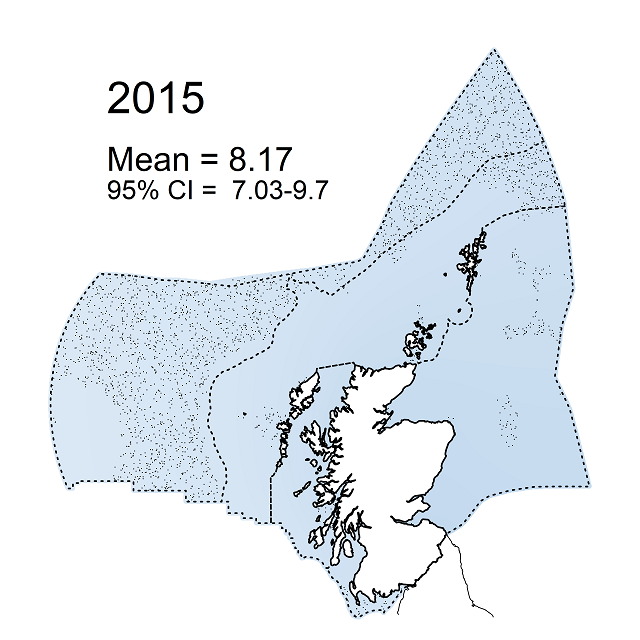
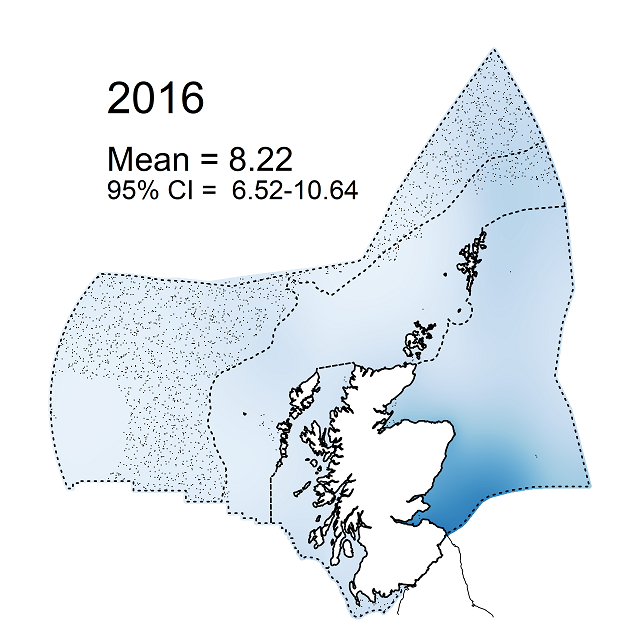
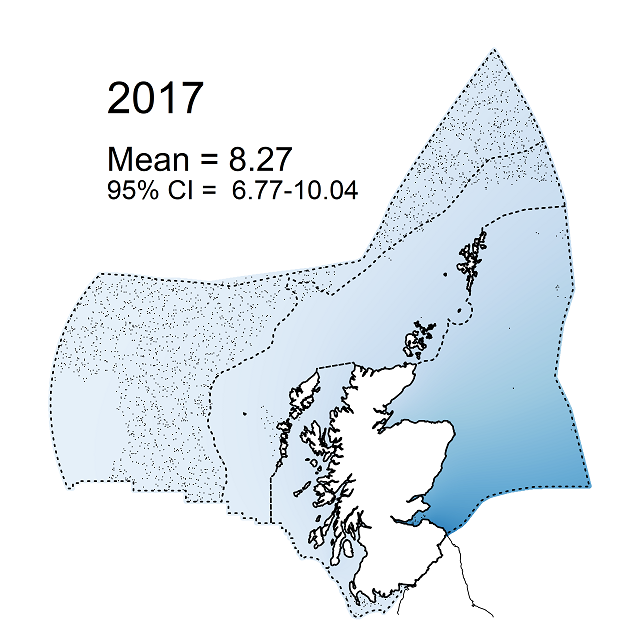
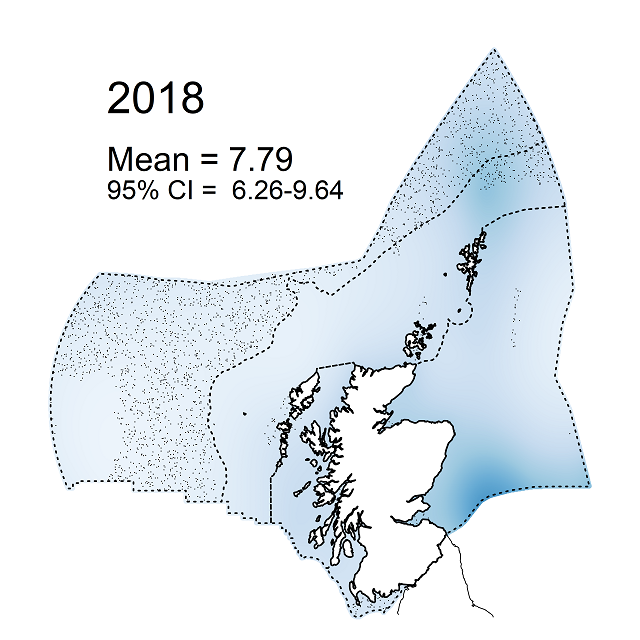
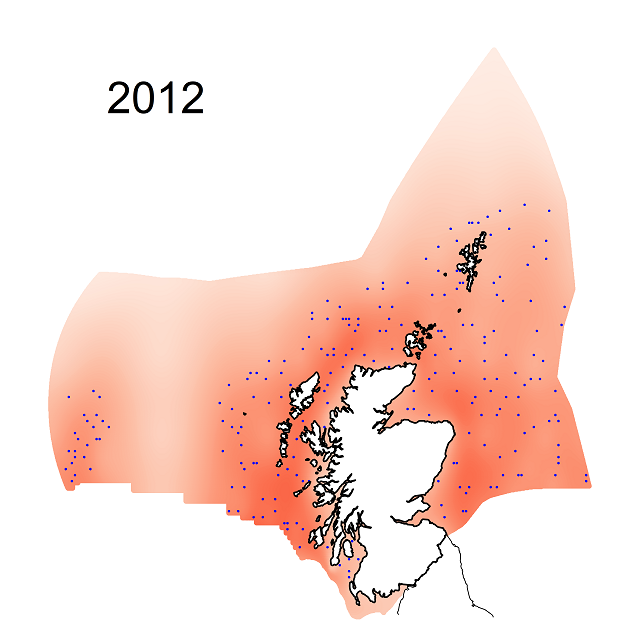
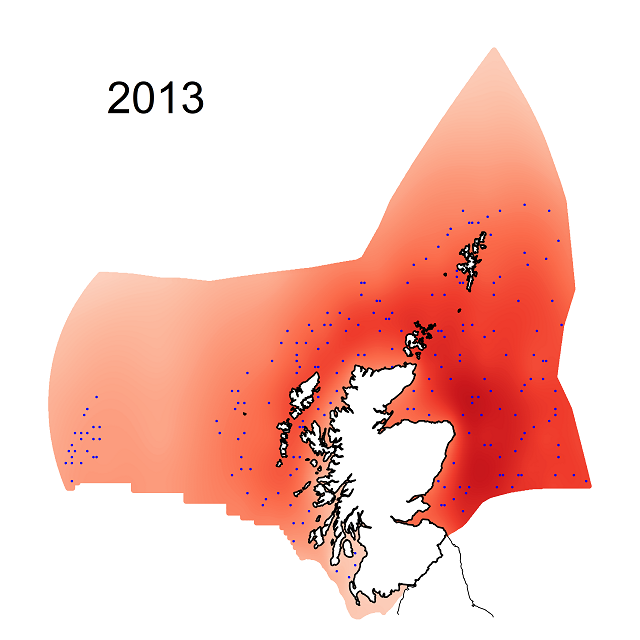
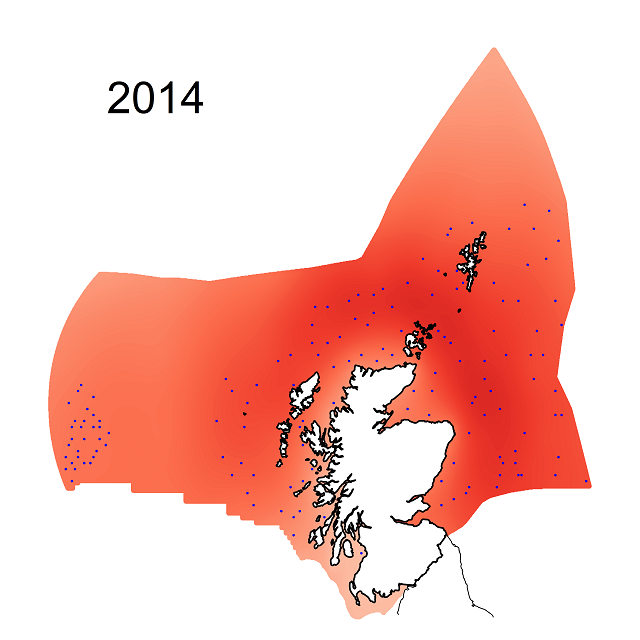
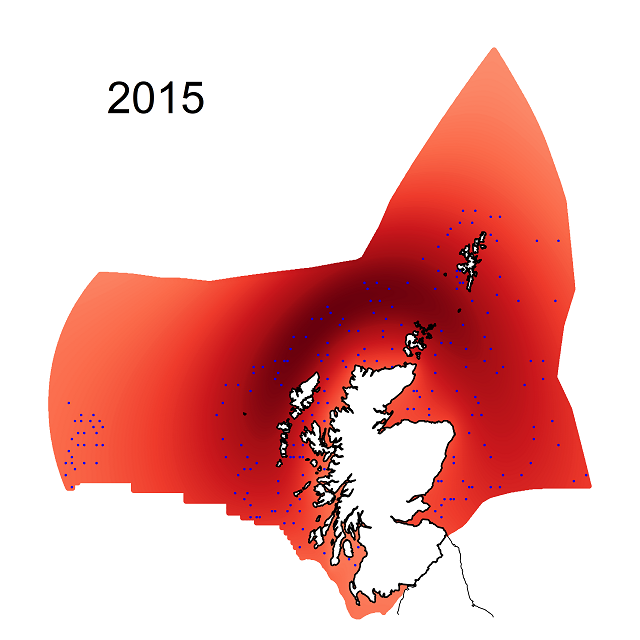
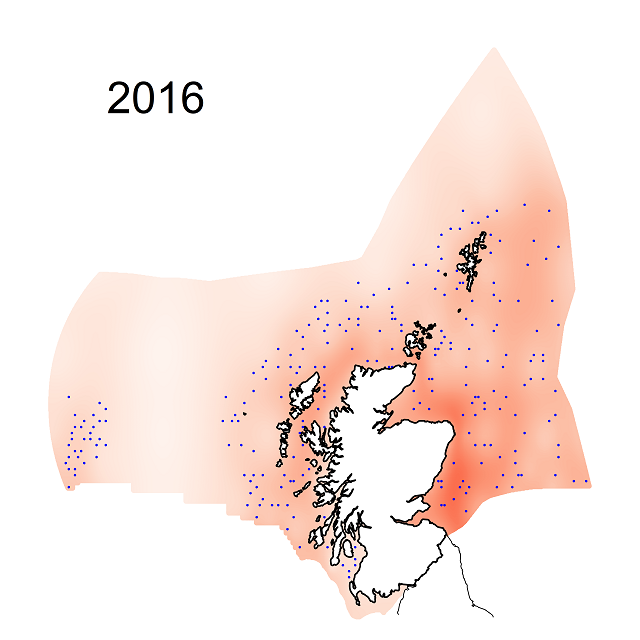
Modelled sea-floor litter densities (Figure e) indicate spatial variation. Model validations indicate that these patterns are a consequence of both sea-floor litter densities and the different ground-gears used for trawling. The validations are consistent, however, with the highest densities occurring in the North Sea and the lowest in off-shore waters west of Scotland. The patterns are not consistent across years, the most apparent inconsistency being an increased density around the south-west coast of Scotland during 2012. It is not certain whether this is a consequence of a change in litter densities or a sampling or modelling artefact.
 |
 |
 |
 |
 |
 |
 |
 |
|
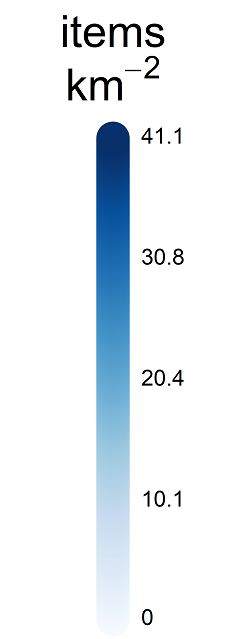
Figure e: Modelled sea-floor litter density (items km-2) within the Scottish Zone from 2012 to 2018. Biogeographic regions are denoted by dotted internal boundaries, and areas distant from survey trawls by stippling. Annual mean modelled sea-floor litter densities for the Scottish Zone with 95% confidence intervals are also presented. |
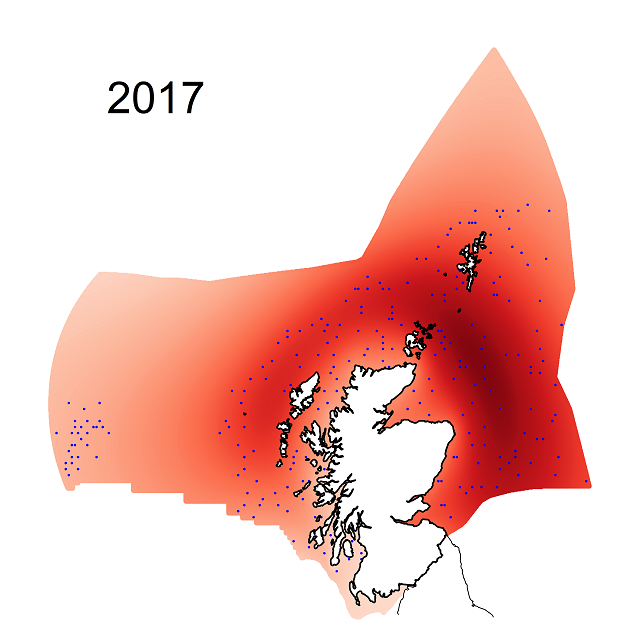
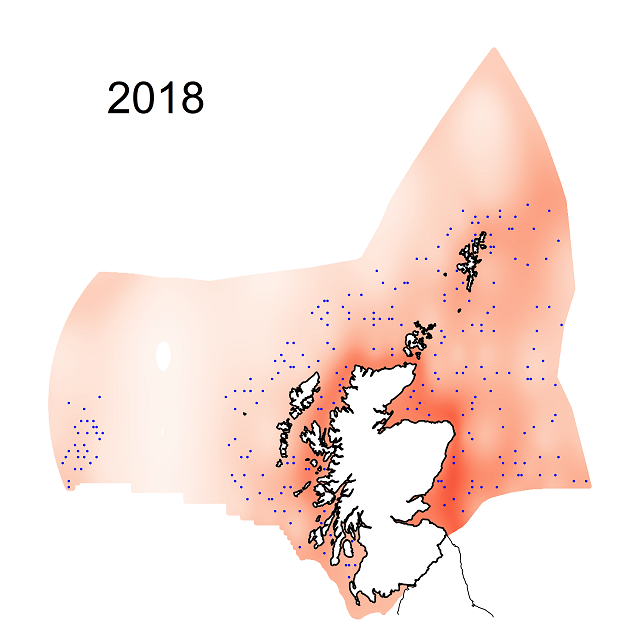
Modelling precisions for sea-floor litter densities, relative to the median precision across all analysis years, are shown in Figure f. Modelling precisions, which vary between annual analyses, tend to be lower where sampling was sparse.
 |
 |
 |
 |
 |
 |
 |
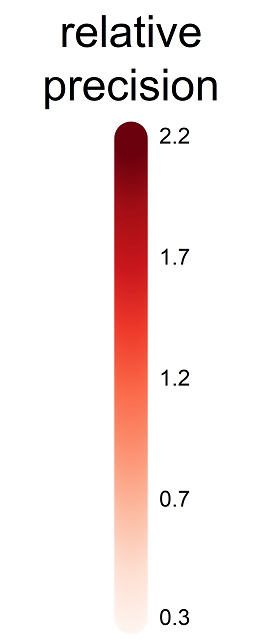 |
| Figure f: Relative modelling precisions for sea-floor litter densities within the Scottish Zone from 2012 to 2018. Sampling locations are denoted by blue points. |
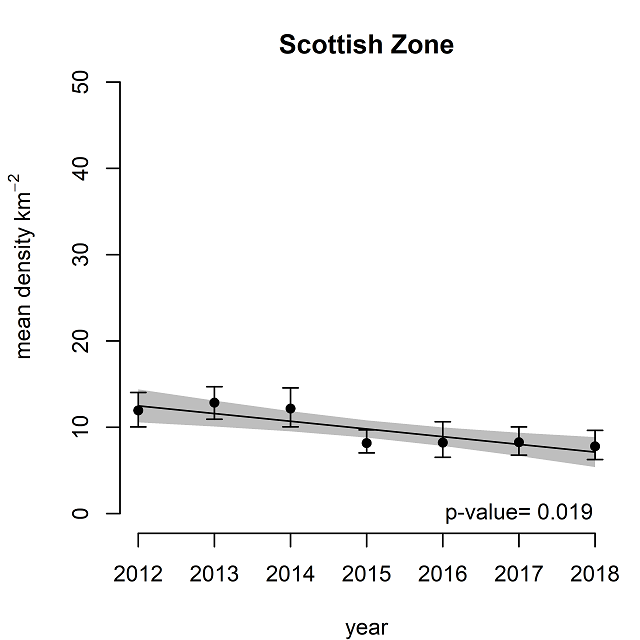
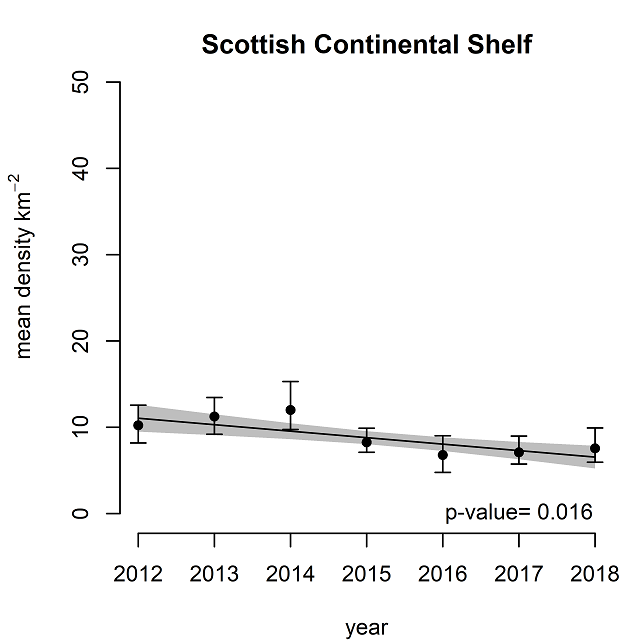
Annual estimates of the mean sea-floor litter density, together with 95% confidence intervals, are presented in Figure g. For the Scottish Zone as a whole there is evidence of an apparent decreasing density of sea-floor litter over the seven years of monitoring (p=0.019). Similar results were obtained for the Scottish Continental Shelf and the Atlantic North-West Approaches (p=0.016), indicating an apparent reduction in sea-floor litter density in the seas distant from large population centres. None of the trends indicate an apparent increase in sea-floor litter density.
 |
 |
 |
 |
 |
 |
|
Figure g: Mean sea-floor litter densities (items km-2) for the Scottish Zone and biogeographic regions from 2012 to 2018 inclusive. Mean values with 95% confidence intervals are denoted as points and vertical bars respectively. Linear trends with 95% confidence intervals over time are denoted as oblique lines and grey polygons respectively. Estimates of p are for a linear trend differing from a gradient of 0. |
These modelled spatial and temporal patterns should be regarded as indicative rather than definitive. Specific evaluations for small areas, such as the Firth of Clyde, are less certain because it is not certain to what extent the smoothers are able to adjust to local differences given the distribution of sampling locations. It is for this reason that biogeographic regions are used in preference to the more local Scottish Marine Regions. They do, however, indicate that sea-floor litter densities are highest for the North Sea and lowest in the off-shore waters west of Scotland.
There is also some evidence of an apparent decrease in sea-floor litter densities for the Scottish Zone, including the biogeographical regions of the Scottish Continental Shelf and Atlantic North-West Approaches.
It is not possible to compare these results to preceding years because the data are not available, and an assessment of sea-floor litter was not undertaken for the previous Scotland’s Marine Atlas (Baxter et al., 2011).
Conclusion
Sea-floor litter, the majority comprising plastic items, was observed in 44% of trawls undertaken in the seas around Scotland. In recent years the highest densities occurred in the North Sea, and the lowest in off-shore waters to the west of Scotland.
There is evidence of an apparent decrease in sea-floor litter density between 2012 and 2018 in areas distant from large population centres. There are several possible explanations for this.
The following comments are primarily intended to provide a note of caution.
The trawl gear captures and retains an unknown proportion of the available litter. Actual sea-floor litter densities are therefore higher, potentially considerably higher, than those described in this assessment.
Different trawl ground-gears (ICES 2012, 2017) are used by MRV Scotia in different areas, and the spatial litter distributions presented in this assessment are therefore a consequence of both varying litter densities and the different litter capturing properties of the gears. Model validations indicate that the conclusions of the assessment, as written, are correct. However, the reader should take care to not over-interpret specific spatial litter density variations apparent in the figures. It would clearly be desirable if the surveys, which are primarily intended to monitor commercial demersal fish stocks, adopted a consistent ground-gear in the future.
An apparent higher litter density along parts of the Great Britain coastline may be a modelling edge-effect.
Explanations for an apparent decrease in sea-floor litter density include reduced litter inputs relative to degradation and removal, fragmentation of litter to sizes less efficiently captured and/or retained by the gear, transport of litter to areas such as deeper waters which are not sampled, and the statistical rejection of a true null hypothesis. While the results of this analysis are, therefore, consistent with a reduction in sea-floor litter density in some parts of the Scottish Zone they do not demonstrate that this has actually occurred.
Despite the above reservations we know that at least some sea-floor litter is being removed. For example, the Marine Conservation Society’s Great British Beach Clean removes sea-floor litter subsequently transported onto beaches, and the participation of vessels in Fishing for Litter Scotland removes sea-floor litter in situ. Both supplement natural, but for plastics slow (reviewed by Andrady, 2015), degradation processes. It is only when combined rates of removal and degradation exceed rates of input that progress towards the UN General Assembly Sustainable Development Goal 14 requiring the prevention and significant reduction of marine debris by 2025 can be achieved.
Knowledge gaps
The sea-floor litter data were collected during international scientific surveys assessing commercial sea-floor living fish stocks. Trawls take place in areas suited to such fishing and omit deep seas, coastlines, and rocky areas. Likewise the equipment is designed to capture fish rather than litter. The results are, therefore, relative sea-floor litter distributions and are affected by unquantified amounts of sampling bias.
This assessment of sea-floor litter is only as reliable as the quality of the data and the statistical analysis on which it is based.
The data are collected as a part of ICES coordinated international scientific surveys assessing demersal fish stocks. Potential issues include:
- The trawl equipment is designed to sample fish and is likely to be suboptimal with regard to litter. In particular, the use of different ground-gear for different areas of the Scottish Zone may introduce spatial sampling biases. While the use of trawls for sampling continental shelves for litter is regarded as being the ‘most adequate to date’, it is accepted to underestimate litter densities (JRC, 2011). To what extent these are underestimated is unknown.
- The inclusion in the analysis of ‘twine’ displaced from the gear itself during a trawl generates a background noise which is likely to weaken sea-floor litter spatial distribution and temporal change signals. ‘Twine’ is categorised as a ‘Plastic’ and subcategorised as ‘Fishing Net’ (ICES, 2018). The subcategory, which includes items other than ‘twine’, contributes 6% of the litter items sampled. To what extent ‘twine’ obscures spatial distributions and temporal changes is unknown.
- Trawls are undertaken on shallow and continental-shelf subtidal sediments omitting deep seas, coastlines, subtidal rock habitats and other locations not conducive to sampling. It is likely that sea-floor litter accumulation, transport and degradation for at least some of these areas is substantially different (reviewed by Galgani, Hanke, & Maes, 2015). For example, over one million tonnes of munitions, which can be defined as litter (UNEP, 2005), were deposited in Beaufort’s Dyke (OSPAR, 2010), an area unsampled in these surveys. To what extent this potentially biased (with regard to sea-floor litter) sampling affects spatial distributions and temporal changes is unknown.
Statistical modelling is subject to assumptions. Potential issues include:
- The ‘wiggliness’ of the smoothers may not be applicable to all locations. An optimal ‘wiggliness’ is estimated by maximum likelihood (Wood, Bravington & Hedley, 2008) using data throughout the modelling area. This estimate is not necessarily relevant to specific locations. To what extent this affects predicted litter densities at specific locations is unknown.
- Edge-effects along modelling boundaries, including the Great Britain coastline, are possible.
- There are seven years of litter data. This is only a sufficient time to infer, at best, a short-term linear temporal change in sea-floor litter density. Within a policy context, medium and longer-term temporal changes are unknown.
Overall, the authors feel that this analysis generates ‘broad-brush’ inferences regarding the Scottish Zone between 2012 and 2018 inclusive. These are summarised in the brief conclusions section. The analysis does not enable inferences relating to specific areas or medium or long-term temporal trends.
Status and trend assessment
|
Region assessed |
Status with confidence |
Trend with confidence |
|---|---|---|
| Atlantic North West Approaches |
 |
|
| Irish Sea |
|
|
| Minches and Western Scotland |
|
|
| Northern North Sea |
|
|
| Scottish Continental Shelf |
|
|
This Legend block contains the key for the status and trend assessment, the confidence assessment and the assessment regions (SMRs and OMRs or other regions used). More information on the various regions used in SMA2020 is available on the Assessment processes and methods page.
Status and trend assessment
|
Status assessment
(for Clean and safe, Healthy and biologically diverse assessments)
|
Trend assessment
(for Clean and safe, Healthy and biologically diverse and Productive assessments)
|
||
|---|---|---|---|
 |
Many concerns |
No / little change |
|
 |
Some concerns |
Increasing |
|
 |
Few or no concerns |
Decreasing |
|
 |
Few or no concerns, but some local concerns |
No trend discernible |
|
 |
Few or no concerns, but many local concerns |
All trends | |
 |
Some concerns, but many local concerns |
||
| |
Lack of evidence / robust assessment criteria |
||
| Lack of regional evidence / robust assessment criteria, but no or few concerns for some local areas | |||
 |
Lack of regional evidence / robust assessment criteria, but some concerns for some local areas | ||
| Lack of regional evidence / robust assessment criteria, but many concerns for some local areas | |||
Confidence assessment
|
Symbol |
Confidence rating |
|---|---|
|
Low |
|
|
Medium |
|
|
High |

Assessment regions
 and the Scottish Offshore Marine Regions (OMRs, O1 – O10)")
Key: S1, Forth and Tay; S2, North East; S3, Moray Firth; S4 Orkney Islands, S5, Shetland Isles; S6, North Coast; S7, West Highlands; S8, Outer Hebrides; S9, Argyll; S10, Clyde; S11, Solway; O1, Long Forties, O2, Fladen and Moray Firth Offshore; O3, East Shetland Shelf; O4, North and West Shetland Shelf; O5, Faroe-Shetland Channel; O6, North Scotland Shelf; O7, Hebrides Shelf; O8, Bailey; O9, Rockall; O10, Hatton.
 Regions. These have been used as the assessment areas for hazardous substances.")
, Regions.")