
Background
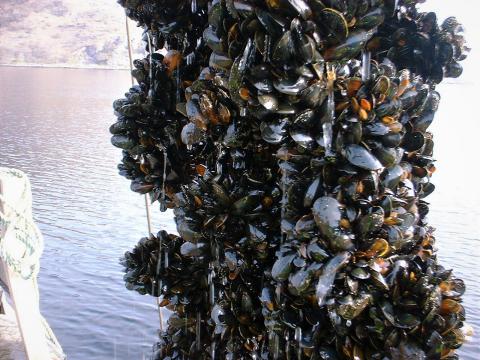
Shellfish, such as mussels and oysters, filter large volumes of water to obtain food. During this process they can concentrate organisms (bacteria and viruses) in their bodies, some of which may be harmful to humans (pathogens). Such organisms can be present due to contamination with sewage or animal faeces (faecal contamination). If raw or lightly cooked shellfish contaminated with a pathogen was eaten by a consumer, it could cause illness, such as vomiting and diarrhoea.
Levels of faecal contamination in shellfish collected from production areas (PAs) are monitored by Food Standards Scotland (FSS) as prescribed in the European Regulation (EU) 2017/625. E. coli is used as an indicator of this contamination and, as such, of water quality.
Classifications are awarded according to the FSS Protocol for Classification and Management of E.coli results (FSS, 2019a). There are three classes of water quality within the classification system - A, B and C , with A being the highest quality (cleanest waters) and C the lowest.
Depending on class, treatment of shellfish may be required before it is placed on market. Shellfish from class A waters may go directly to consumer without any further treatment, while shellfish from class B waters must undergo purification (by placing in tanks with clean water for a specific time) or cooking, and shellfish from class C waters must be cooked. Harvesting will be prohibited from areas where E. coli exceeds certain levels prescribed in the regulation.
FSS works with the Scottish Environment Protection Agency to identify any areas showing signs of deteriorating water quality.
Current survey work
The Shellfish Official Control (OC) classification and monitoring programme is fully funded by FSS. Regular monitoring is undertaken for all classified PAs. Shellfish samples are collected according to the FSS classification protocol for all current classified shellfish PAs. Shellfish samples are collected on a monthly basis, although for most PAs between 8-12 samples are, in effect, collected annually. Shellfish samples are also collected for any new areas for which a classification application has been submitted by the harvester. The sampling regime for these will vary, either 10 weekly samples or 10 monthly samples. Once annual classification is awarded, monthly sampling commences.
All data generated under the Scottish shellfish harvesting classification programme for the last 10 years are available on the Centre for Environment, Fisheries and Aquaculture Science (CEFAS) website. E.coli results are also available on the Scotland’s aquaculture website and on the FSS website.
An annual assessment of E. coli monitoring data is undertaken in January, with the previous 3 years’ data normally used to award the following year’s classification status. However, if there are insufficient data available, a minimum of 1 year of data are required to award an annual classification. The final classification document is published on the FSS website in March.
The assessment of the FSS classifications for 2019/2020 show the status of E. coli in shellfish flesh in the Scottish Marine Regions (SMRs). The 2019/20 assessment uses E. coli data collected between 2016 and 2018. Shellfish samples for Scotland, exluding Shetland, are analysed for E.coli by CEFAS, and for Shetland by Seafood Quality Control (SSQC), on behalf of FSS. The laboratories are accredited to ISO 17025, and samples are analysed for E.coli using a protocol based on ISO 16649-3. CEFAS participates in 3 quality assurance schemes:
- External Quality Assessment (EQA) provided by Public Health England (PHE). This consists of three distributions per year of two shellfish samples tested in duplicate.
- Analysis of two Internal Quality Control samples per month in the form of lenticules (Certified Reference Material), with results compared to previously analysed lenticules from the same batch (6 x analyses in duplicate).
- CEFAS also takes part in an internal comparability exercise where the EQA material is tested and results compared between analysts.
SSQC take part in the following quality assurance exercises:
- All available rounds of the EQA exercise provided by PHE.
- CEFAS Ring Trial.
- Internal quality check, with a minimum of 2 rounds per year, using spiked samples of shellfish homogenate.
Classification awards are carried out as described in the FSS classification protocol (FSS, 2019a). The results of the 2019/2020 classification assessment are published on the FSS website (FSS, 2019c). The FSS shellfish classification results were used to assess the individual SMRs. Of the eleven designated SMRs, eight have classified shellfish production areas. Only six of these eight SMRs had sufficient data to carry out an assessment, as SMRs with less than 5 production areas were not assessed. The areas with sufficient production areas for assessment were Shetland, West Highland, Outer Hebrides, Argyll, Forth and Tay, and Clyde.
The shellfish PA classifications for each SMR were summarised as a percentage of the total for that area. Table a shows the criteria for the individual classifications of each site. A site can be designated A, B, C, A/B or B/C. Seasonal sites designated A/B were A class for a minimum of 5 months. Seasonal sites designated B/C were B class for a minimum of 6 months. No trend analysis is possible as this assessment only looks at classification for a single year. The PAs that are classified each year can vary.
|
Classification
|
Criteria
|
Action
|
|---|---|---|
|
A
|
80% of samples collected during the review period <230 E.Coli/100 g flesh and intra-valvular liquid. The remaining 20% of samples <700 E. coli/100g of flesh and intra-valvular liquid.
|
May go direct for human consumption if end product standard met.
|
|
B
|
90% of samples collected during the review period < 4600 E. coli/100 g of flesh and intra-valvular liquid. The remaining 10% of samples <46000 E. coli/100g of flesh and intra-valvular liquid.
|
Must be subject to purification, relaying in Class A area (to meet Category A requirements) or cooked by an approved method.
|
|
C
|
Samples collected during the review period <46000 E. coli/100 g of the flesh and intra-valvular liquid.
|
Must be subject to relaying for a period of at least 2 months or cooked by an approved method.
|
|
|
Above 46000 E. coli/100 g of the flesh and intra-valvular liquid.
|
Prohibited. Harvesting not permitted.
|
Results
Eight Scottish Marine Regions (SMRs), Shetland, West Highland, Outer Hebrides, Argyll, Forth and Tay, Clyde, North Coast, Solway, had classified shellfish PAs. The 2019/20 classification for each of these locations (2016- 2018 data) is shown in Figure 1. Only SMRs with five data points were included in the regional assessment. Of the eight SMRs with shellfish PAs, six had sufficient data points, Solway and North Coast had insufficient data.
The percentage of each classification category was calculated for each SMR, and is shown in Figure 2. Shetland contains the highest percentage (89%) of Class A shellfish PAs. The only SMR to contain any Class C areas is Argyll (2/11 PAs). Water quality will depend on the impact from human and animal pollution sources, which will vary depending on location.
Shellfish water quality was assessed for Scotland’s Marine Atlas (Baxter et al., 2011). The 2009/2010 classification showed that 40% of PAs were Class A all year round. In the current assessment, 59% of all PAs across Scotland were Class A, which is a marked improvement.


The full details of the results of the E.coli monitoring are already published E.coli results are also available on the Scotland’s aquaculture website and on the FSS website.
Conclusion
The overall microbiological water quality of shellfish PAs is good, with 59% Scottish PAs being designated as Class A. Shetland had the highest percentage of Class A products (89%). For five of the six SMRs assessed, over 50% were designated Class A or A/B, with Class A products being of sufficient microbiological quality to be placed directly on the market without further processing.
Knowledge gaps
There are several regions with either no data or very few data points. This is due to the location of classified shellfish areas as FSS only monitor areas with classified shellfish harvesting activity. There are also 2 SMRs (Solway and North Coast) that have insufficient data for a regional assessment.
Status and trend assessment
Traffic light assessments are not appropriate for this assessment due to the lack of assessment criteria and the small number of production areas in each SMR.
This Legend block contains the key for the status and trend assessment, the confidence assessment and the assessment regions (SMRs and OMRs or other regions used). More information on the various regions used in SMA2020 is available on the Assessment processes and methods page.
Status and trend assessment
|
Status assessment
(for Clean and safe, Healthy and biologically diverse assessments)
|
Trend assessment
(for Clean and safe, Healthy and biologically diverse and Productive assessments)
|
||
|---|---|---|---|
 |
Many concerns |
No / little change |
|
 |
Some concerns |
Increasing |
|
 |
Few or no concerns |
Decreasing |
|
 |
Few or no concerns, but some local concerns |
No trend discernible |
|
 |
Few or no concerns, but many local concerns |
All trends | |
 |
Some concerns, but many local concerns |
||
 |
Lack of evidence / robust assessment criteria |
||
| Lack of regional evidence / robust assessment criteria, but no or few concerns for some local areas | |||
 |
Lack of regional evidence / robust assessment criteria, but some concerns for some local areas | ||
| Lack of regional evidence / robust assessment criteria, but many concerns for some local areas | |||
Confidence assessment
|
Symbol |
Confidence rating |
|---|---|
|
Low |
|
|
Medium |
|
|
High |

Assessment regions
 and the Scottish Offshore Marine Regions (OMRs, O1 – O10)")
Key: S1, Forth and Tay; S2, North East; S3, Moray Firth; S4 Orkney Islands, S5, Shetland Isles; S6, North Coast; S7, West Highlands; S8, Outer Hebrides; S9, Argyll; S10, Clyde; S11, Solway; O1, Long Forties, O2, Fladen and Moray Firth Offshore; O3, East Shetland Shelf; O4, North and West Shetland Shelf; O5, Faroe-Shetland Channel; O6, North Scotland Shelf; O7, Hebrides Shelf; O8, Bailey; O9, Rockall; O10, Hatton.
 Regions. These have been used as the assessment areas for hazardous substances.")
, Regions.")