Background
Sea surface temperatures (SSTs) around Scotland are strongly influenced by the atmosphere (heat flux) and ocean circulation (advection). When looking at trends around Scotland over long periods of time (more than 50 years) SSTs show an increasing trend in line with global trends, as the entire Earth system has been absorbing more heat with climate change. On decadal and shorter time periods, these trends can differ, and can even be less obvious (and not statistically significant) due to variability on shorter time scales. The conditions in the adjacent North Atlantic Ocean influence regional temperatures in Scotland via both atmospheric and advective processes.
Temperature variability in Scottish waters is provided regularly as part of the Scottish Ocean Climate Status Report (Hughes et al., 2018). For brevity, this assessment focuses on sea surface temperature (SST) in Scottish waters.
The average sea surface temperature across each Scottish Marine Region (SMR) demonstrates the influence of the adjacent North Atlantic Ocean: with winter SST on the west coast of Scotland tending to remain higher than those in the north and east of Scotland. The average winter SST in the Argyll region (in the west) is almost 1.5 °C greater than average winter temperature in the North East region (Hughes et al., 2018).
SSTs around Scotland follow a seasonal cycle, similar to that in air temperature, but peak temperatures in the sea are approximately 1 month later, in August.
For this assessment, trends are calculated during the entire time period of observations, during the current climatological period (1981 - 2010) and during the most recent decade. Trends have been calculated from annual mean datasets using a linear regression. To ensure that the trends quoted are significant, the non-parametric Mann-Kendall test for a trend has been applied (Mann, 1945).
A combined satellite and observational gridded sea surface temperature dataset, produced by the Meteorological Office, Hadley Centre for Climate Science Services in the UK (Rayner et al., 2003), is used. This dataset is on a 1° latitude-longitude grid, starting in 1870 with gridded fields constructed using optimal interpolation techniques. The HadISST1.1 dataset has been used for this assessment, and all data have been quality controlled. This dataset includes ship-based observations from Marine Scotland Science’s research vessels (and others) through the contribution to the Global Telecommunication System (GTS).
In the Scottish Ocean Climate Status Report, analyses are available from two additional datasets collected by Marine Scotland Science:
- The Scottish Coastal Observatory (SCObs), which consists of a number of monitoring sites where SST is recorded using electronic temperature sensors (Vemco miniloggers) at half hourly intervals (all data are publicly available here). At four of these sites, additional parameters are collected, including salinity, nutrient, phytoplankton and zooplankton data, on a weekly basis. (Bresnan et al., 2016; Marine Scotland Science, 2016).
- A database holding all data from water samples collected on research cruises, dating back to the early 1900s, including many parameters such as temperature, salinity and nutrients. This database continues to grow each year, with data collected on-board Marine Scotland’s research vessels MRV Scotia and MRV Alba Na Mara.
Looking solely at absolute temperature values to compare one region with another can be misleading, as some regions will naturally experience greater variation in sea surface temperature than others. To easily compare the observed changes between regions, the observations in each region can be placed in the context of the variability of the region. This means taking the observed value, removing the average of the relevant period, and dividing by the standard deviation in that period. These are called normalised anomalies.
Results
The regional temperatures in the sub-polar North Atlantic during the 1981 - 2010 climatological period were increasing faster than 1893 - 2018 trends, due to changes in Atlantic Ocean circulation outside Scottish waters. Due to the strong influence of the North Atlantic on conditions in Scottish waters, the trends in this region during the 1981 - 2010 period are also higher than the 1893 - 2018 trend. Since 2016, the circulation of the North Atlantic sub-polar gyre has changed, which means the properties of Atlantic water have become cooler and fresher. Therefore, there has been no significant trend in the most recent decade.
Scottish Marine Regions
Based on the gridded SST product, all SMRs show an increasing trend in sea surface temperature from 1893 - 2018, with trends for each region between 0.05 and 0.07 °C per decade (Figure 1). The trend in the Hatton region was not statistically significant.

When considering the 1981 – 2010 climatological period, these trends are higher for each region, ranging from between 0.2 and 0.4 °C per decade.
None of the regions have shown a significant trend for the decade between 2008 and 2017.
The SCObs datasets show no significant trend in temperature over the most recent decade, or over the 1997 - 2018 period. This dataset is still relatively short; in order to provide more information on temperature trends in Scottish coastal regions, these time series need to be continued.
The extended SCObs datasets do show a significant trend for each of the three sites at Millport, Fair Isle and Peterhead over the climatological average period: 0.50, 0.29, 0.26 °C per decade, respectively.
Offshore Marine Regions
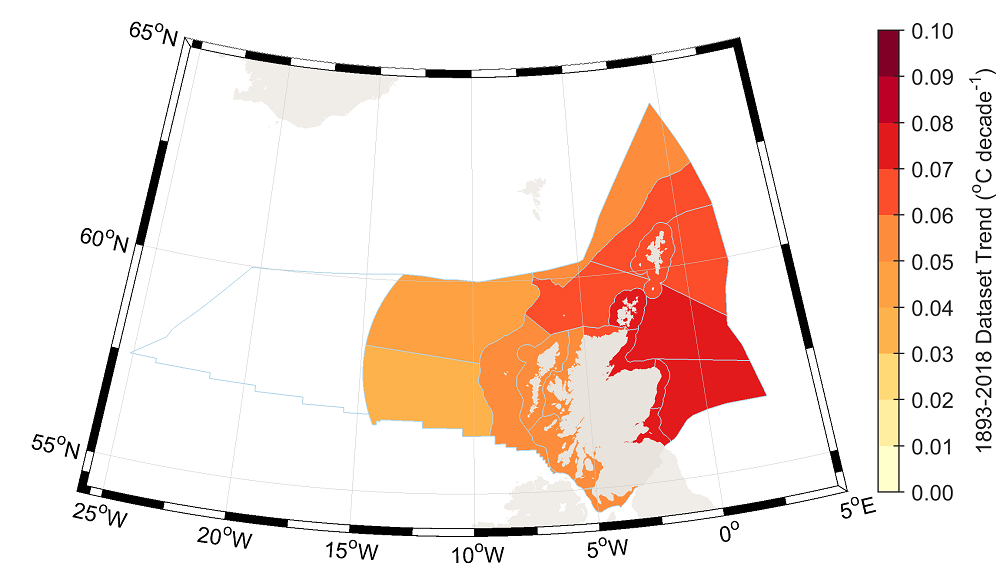
Based on the gridded SST product, all but one of the OMRs (Hatton) show an increasing trend in sea surface temperature from 1893 - 2018, with trends for each region between 0.03 and 0.07 °C per decade (Figure 2).

When considering the 1981 – 2010 climatological period, these trends are higher for each region, ranging from between 0.22 and 0.44 °C per decade.
There are regional differences in the observed trends during the 1893 - 2018 and 1981 - 2010 periods. For both periods, the trends in the shallow regions of the North Sea are higher than those in regions to the north and west of Scotland. This is likely due to the dynamics of heat uptake by shallow regions. In the 1981 - 2010 climatological period, the trend in the Hatton region are also higher than those in neighbouring regions closer to the Scottish coast. This is due to changes in the circulation of the Atlantic Ocean to the south.
None of the regions have shown a significant trend for the decade between 2008 and 2017.
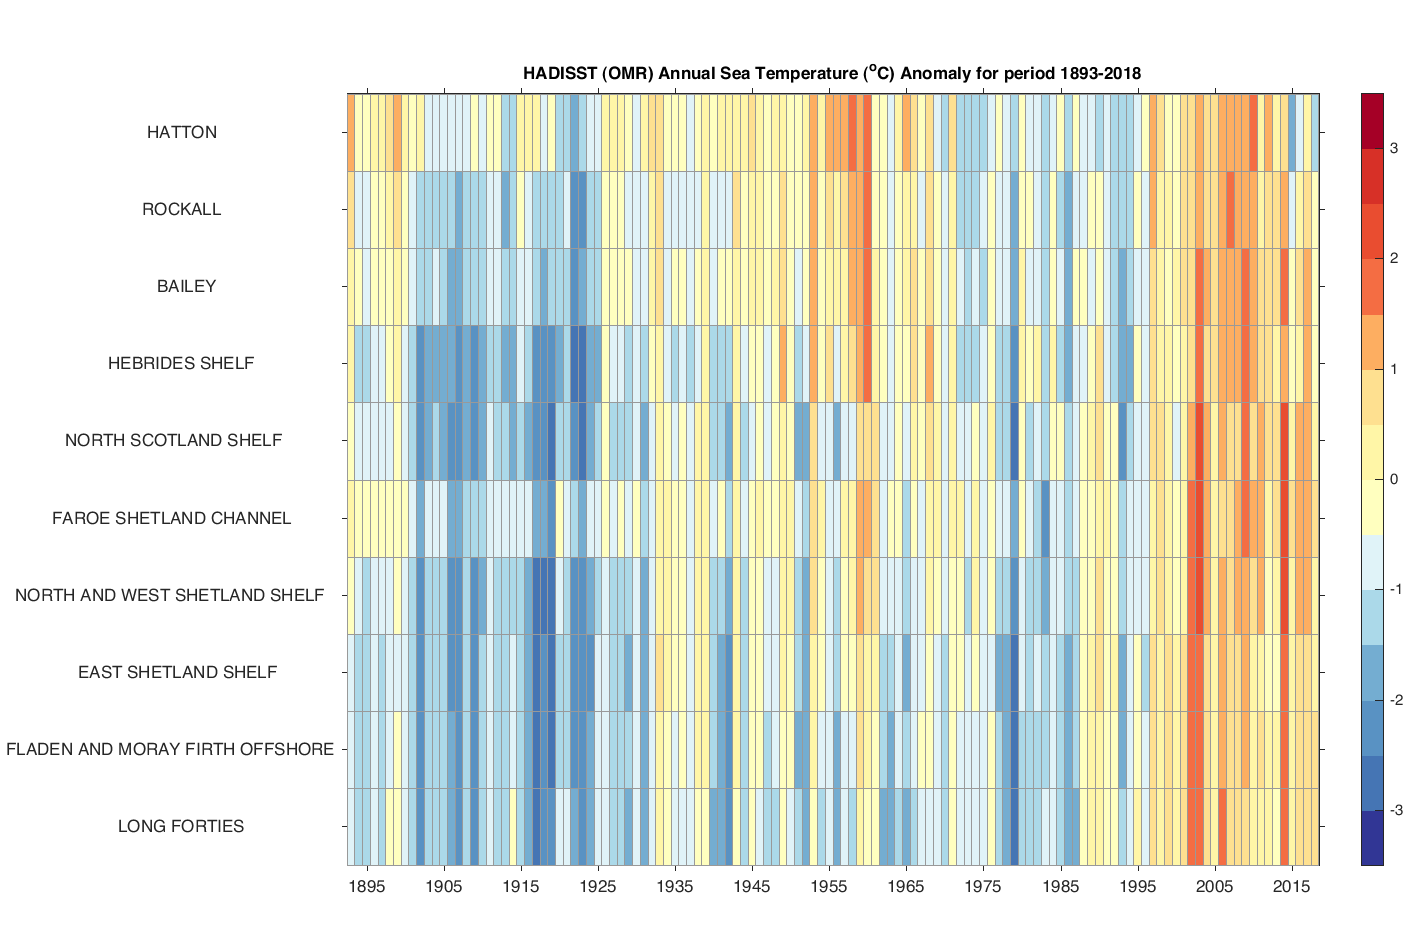
The analysis of linear trends in time series can mask the year-to-year and decadal variability. Figure a shows the annual SST anomalies for the OMRs. It shows that the variability is similar across the different regions, although more warm years have been observed within the North Sea over the most recent decades. Annual SST anomalies in the last ten years have been relatively variable, although 2014 was particularly warm in all regions.

Figure a: Annual SST anomalies relative to the 1981 - 2010 period by OMR. from the HadISST 1.1 data product. These anomalies have been normalised by removing the 1981 - 2010 mean and scaling by the 1981 - 2010 standard deviation for the region. The use of standardised values allows for easy comparison between regions which may have different variability.
Conclusion
SSTs have increased globally and this is reflected by increasing trends observed in all SMRs and OMRs over the last 100 years. During the 1981 - 2010 climatological period, there has been an increased rate of change. This is the result of an increased global trend and regional variation in the sub-polar North Atlantic Ocean and its adjacent regional seas. In recent years, SST differences from the 1981 - 2010 mean have been more variable, and therefore no significant trends have been established for the most recent decade. Although global temperatures will continue to rise due to climate change, there will be regional variations which may mask the long-term trend.
Knowledge gaps
SSTs are observed well by both in situ and remote sensing observations. However, sub-surface temperature observations (near the sea bed or vertical water column profiles) remain relatively sparse. Sustaining observations at a regional level will be important to help identify how the regional temperature variability is influenced by global climate change.
Understanding of the variability at all timescales (seasonal, inter-annual, decadal and long-term) is based on observations from very long measurement records (longer than 30 years). Interruptions in these data (missing locations or broken in time) make the analyses of variability more difficult. These gaps may be improved by incorporating a combination of observations and numerical models (reanalyses).


