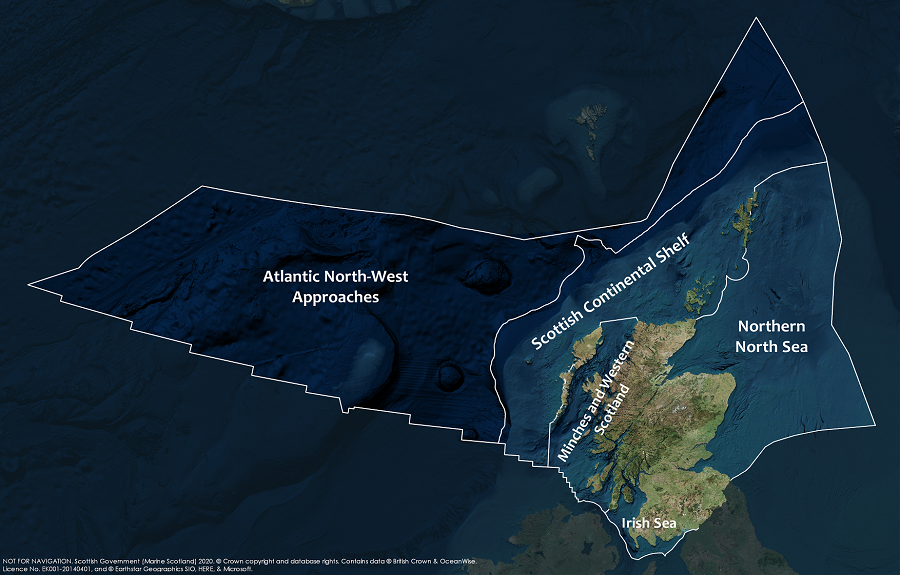
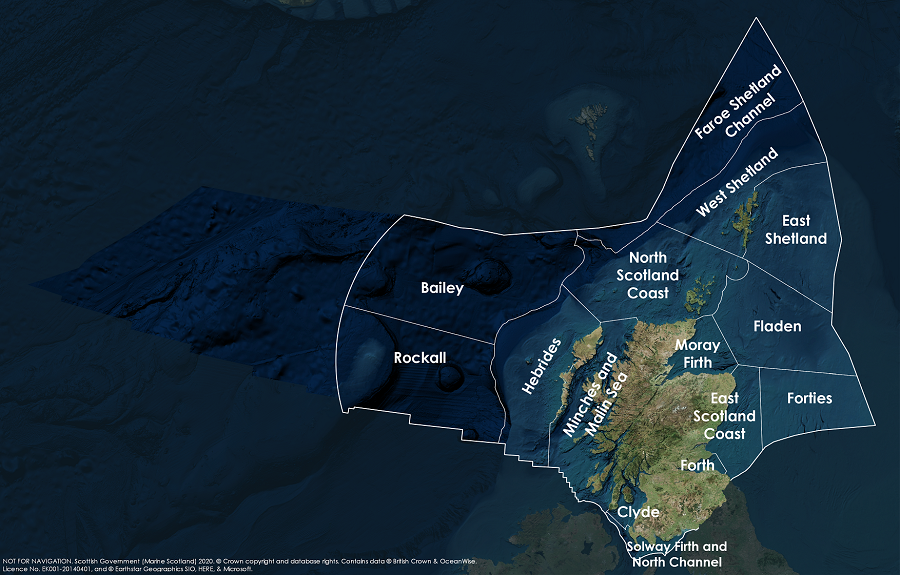
Background
Waterbird is a broad term used to refer to birds that live on or around water such as, geese, swans, divers, grebes, ducks, waders, rails, coots and herons. Scotland’s coasts and inland waters provide overwintering habitat for internationally important populations of migratory waterbirds. Many of these species are long distance migrants, breeding in the high Arctic and attracted by the relatively mild winters and the extensive wetland and intertidal habitats that Scotland has to offer. In an international context Scotland’s extensive non-estuarine coast is important for specialist species (species adapted to and typically found in a narrow range of habitats) such as purple sandpiper and ruddy turnstone; its sea lochs, firths and bays hold large numbers of sea duck, divers and grebes. Furthermore estuaries hold substantial numbers of waders and waterfowl.
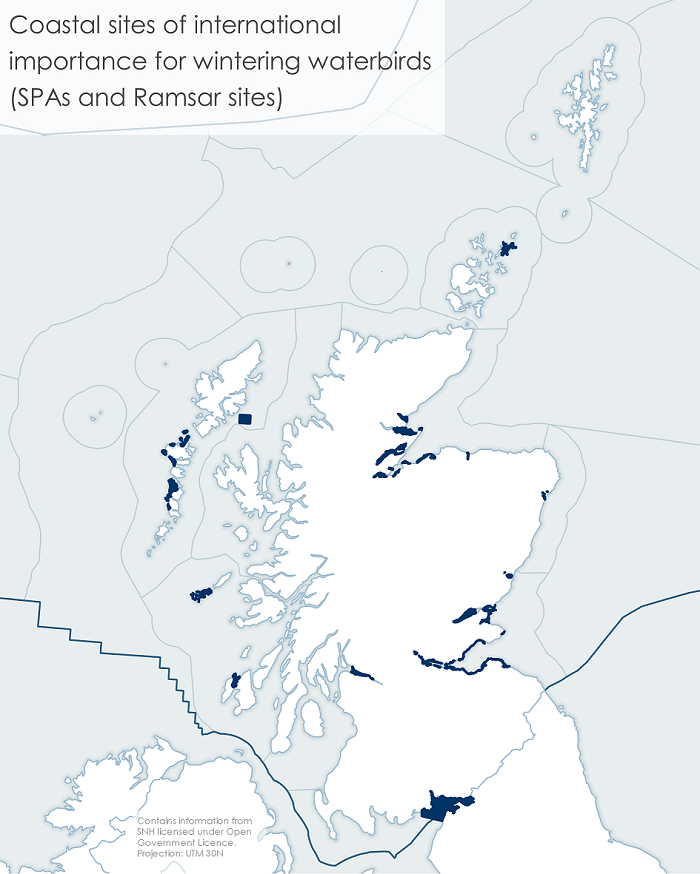
In Scotland, there are 53 protected areas (Special Protection Areas (SPA) and/or Ramsar sites, classified in accordance with the EC Birds Directive or under the international treaty signed at the Ramsar Convention for wetlands, respectively) for internationally important populations of wintering waterbirds (Figure 1).
This analysis includes only species closely associated with the marine environment. The index includes estuarine and coastal shore wintering waders (e.g. common redshank and purple sandpiper), estuarine waterfowl (e.g. common shelduck), seaduck (e.g. long-tailed duck and common eider) and coastal water feeding birds (e.g. great northern diver and Slavonian grebe) (Figure 2). Some of these species breed in Scotland but are joined in winter by birds from elsewhere.
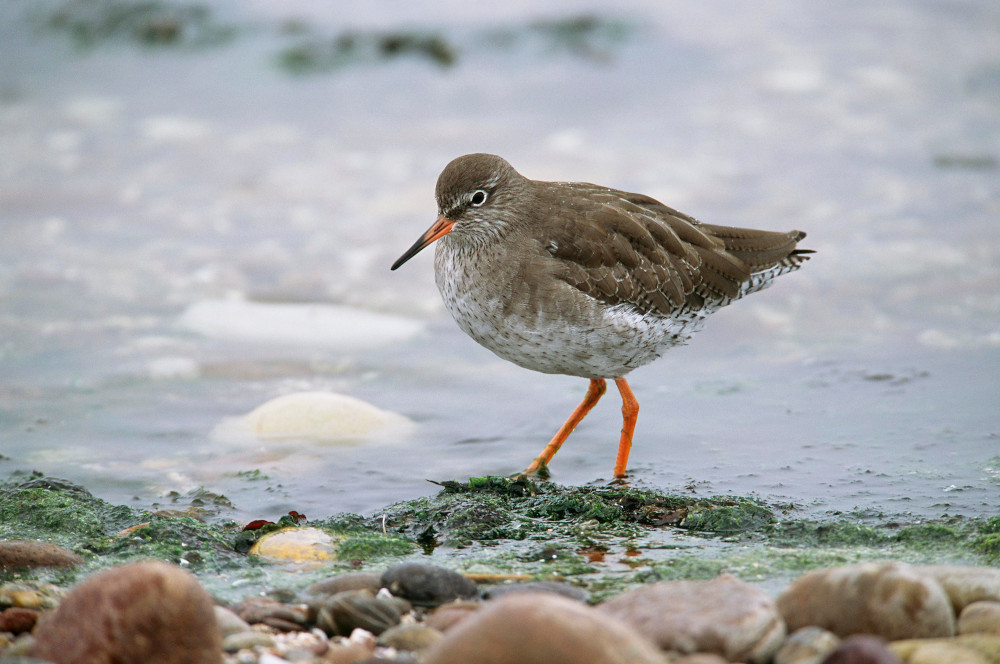
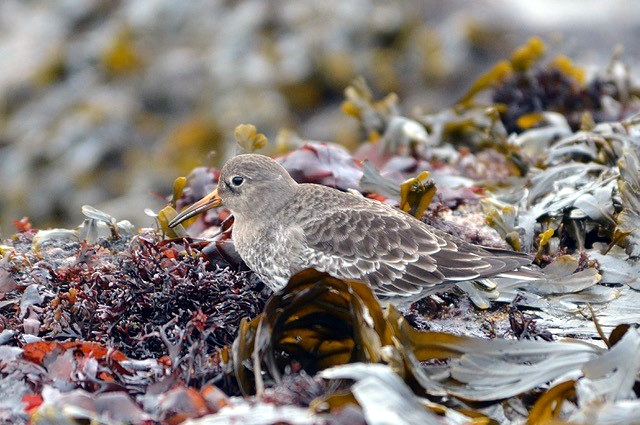
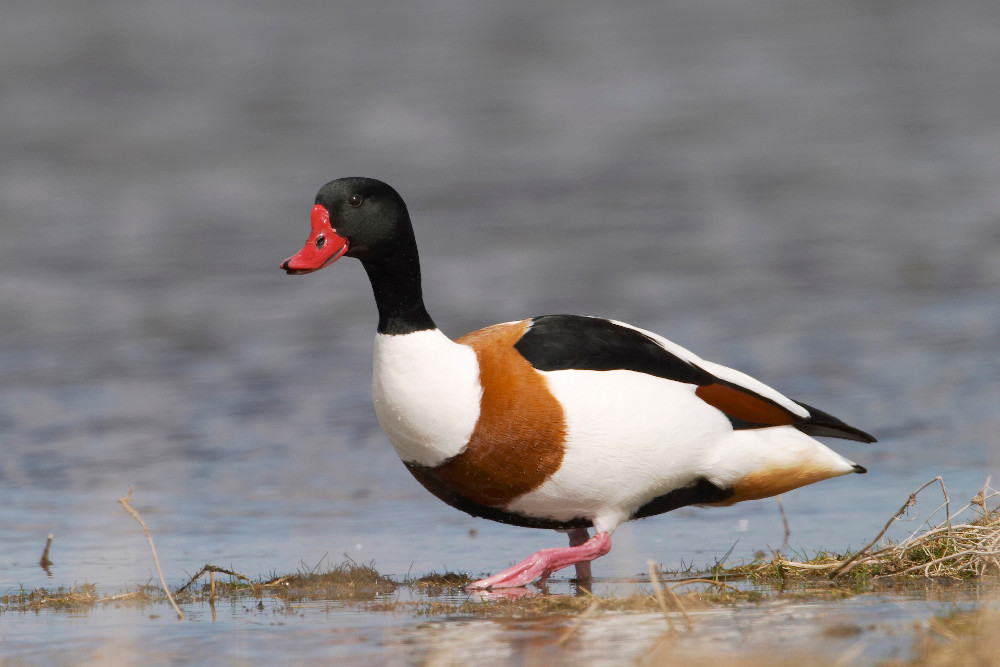
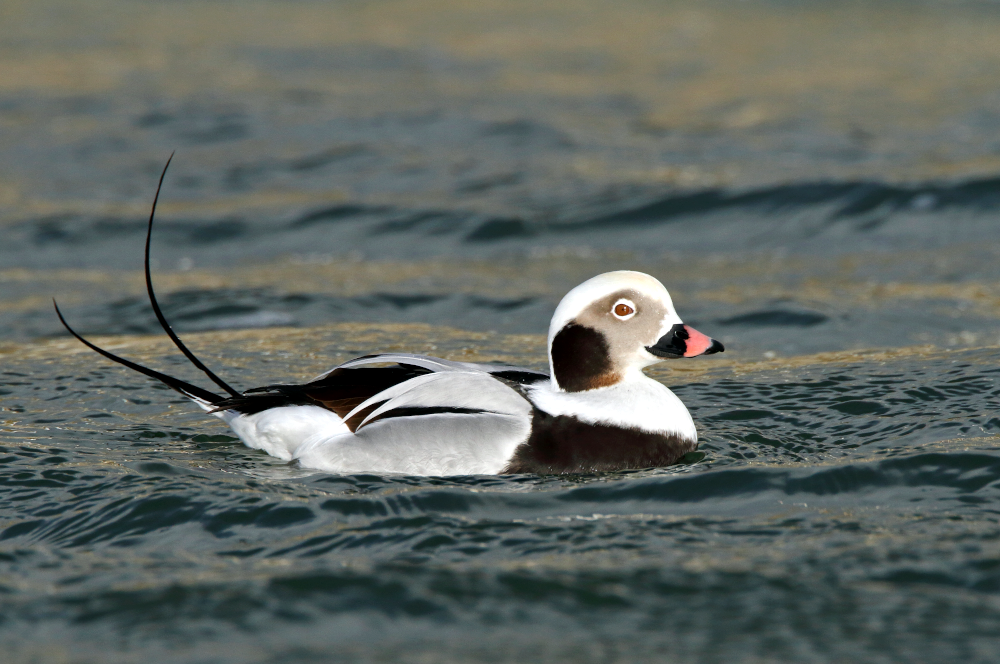
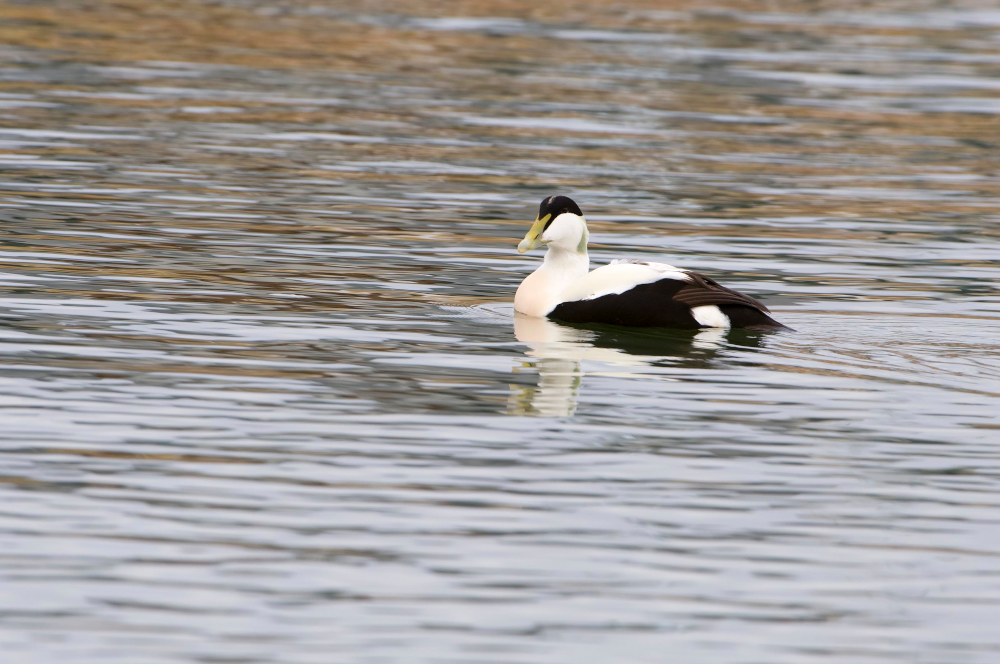
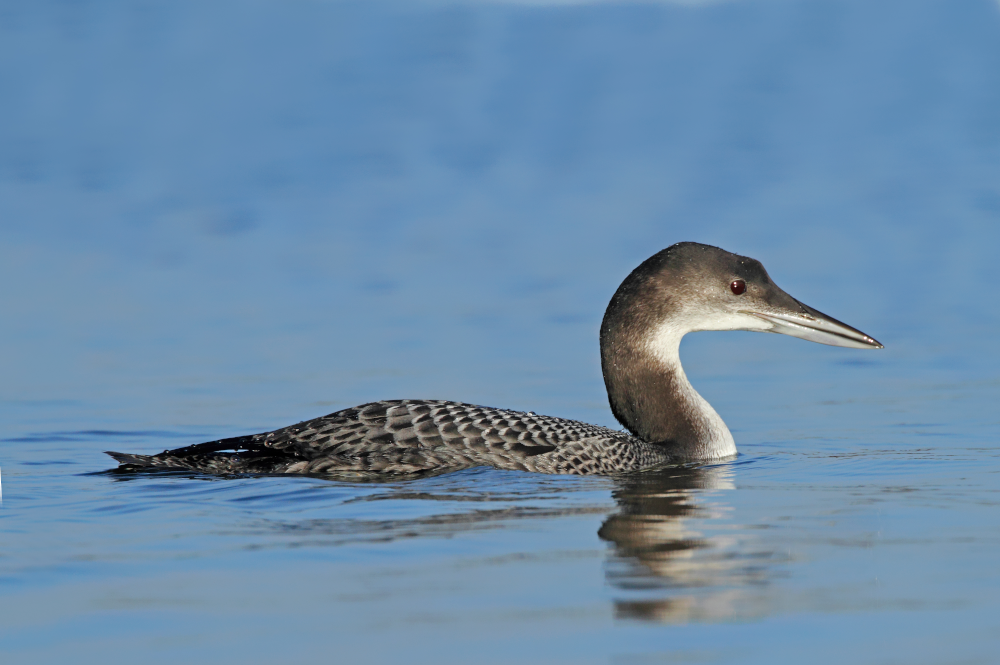
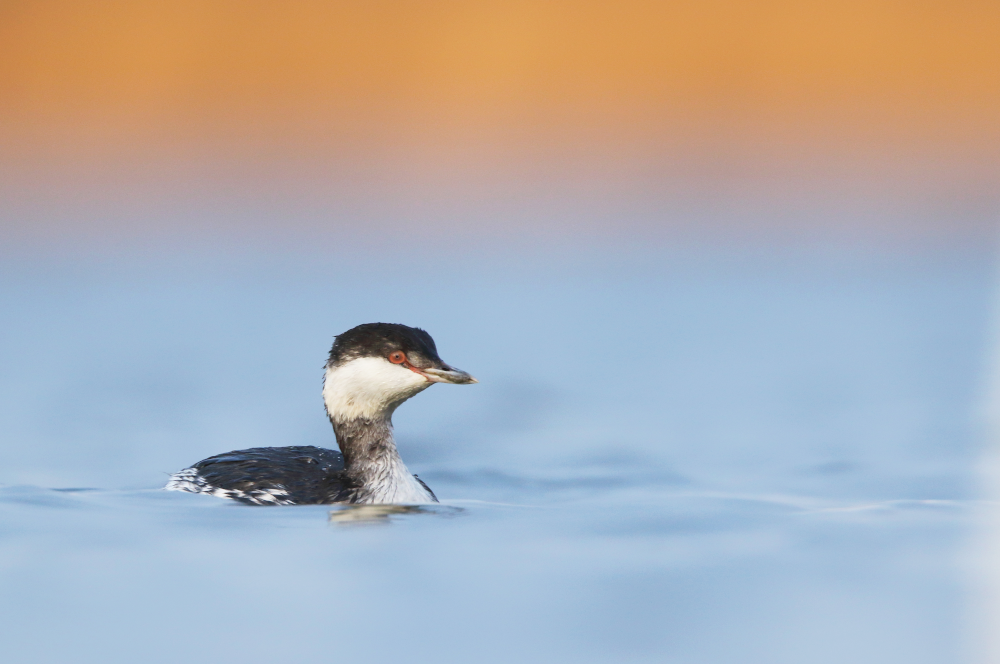
Figure 2: Examples of wintering waterbirds species found along Scottish coasts. Common redshank and common eider © Lorne Gill/NatureScot; purple sandpiper © John Baxter; common shelduck © David Whitaker, Highland Wildlife Photography; long-tailed duck, great northern diver and Slavonian grebe © John Dickenson.
The ‘Wintering Waterbirds in Scotland (S04)’ indicator published by NatureScot includes both marine and freshwater waterbirds. There is no single indicator for marine waterbirds. The assessment is therefore based on a subset (just marine species) of species from the wintering waterbird indicator used to create a marine wintering waterbird index. Wintering waterbird populations are monitored primarily through the Wetland Bird Survey (WeBS); using synchronised monthly counts (September to March) provided mostly by volunteers.
Wintering waterbird populations are monitored primarily through British Trust for Ornithology (BTO) Wetland Bird Survey (WeBS), although other surveys contribute for specific groups. WeBS is an ongoing annual monitoring scheme for non-breeding waterbirds in the UK, which aims to provide principal data for the conservation of their populations and wetland habitats. It was established formally in 1993 to integrate waterfowl and wader counts dating back to the 1940s. WeBS is a partnership jointly funded by BTO, the Royal Society for the Protection of Birds (RSPB) and the Joint Nature Conservation Committee (JNCC), in association with the Wildfowl and Wetland Trust (WWT). Details of the survey protocols are found in the WeBS counter handbook.
Synchronised counts (core counts) of 41 waterbird species that regularly over-winter in Scotland is undertaken by a network of volunteers and professional counters at sites on a monthly basis, principally from September to March. These counts are coordinated by the BTO and the data are stored in a database maintained by BTO. The database contains records back to 1964, but with regular counts for many sites from winter 1975/76, which is used as the baseline for the marine wintering waterbird index. This means the baseline populations could be reflecting a recovering, declining or stable population. Waterbird populations also fluctuate naturally and at any fixed point in time individual species populations may naturally be high, low or average for the species. The baseline provides a comparison of waterbird populations from 1975/76 until present day but does not confirm how this compares with waterbird populations prior to 1975/76 or the scale of natural variability over time. A large number of sites have been monitored continuously since then, but there is some annual variation in coverage as might be expected. Data entry includes an automated checking procedure, but data are also checked for anomalies on entry by observers. The results from the core counts are used to provide population estimates, determine trends in numbers and distribution, and identify important sites for waterbirds.
BTO use the WeBS data to construct the waterbird index annually. These annual WeBS indices are used for the ‘Wintering Waterbirds in Scotland (S04)’ indicator (SNH, 2018).
As the Wintering Waterbirds in Scotland (S04) indicator includes taxa with a non-marine association, the indicator presented here is constructed from a subset of the full wintering waterbird indicator as published by NatureScot (SNH, 2018). The data on 24 species (Table a) of marine waterbirds selected from the 41 species of all waterbirds occurring in Scotland are used here to create an index of change. This marine wintering waterbird index is used to support an assessment of the health of waterbird populations in the marine environment.
|
Common name
|
Scientific name
|
|
Common shelduck
|
Tadorna tadorna
|
|
Greater scaup
|
Aythya marila
|
|
Long-tailed duck
|
Clangula hyemalis
|
|
Common scoter
|
Melanitta nigra
|
|
Velvet scoter
|
Melanitta fusca
|
|
Red-breasted merganser
|
Mergus serrator
|
|
Black-throated diver
|
Gavia arctica
|
|
Red-throated diver
|
Gavia stellata
|
|
Great northern diver
|
Gavia immer
|
|
Slavonian grebe
|
Podiceps auritus
|
|
Great cormorant
|
Phalacrocorax carbo
|
|
European shag
|
Phalacrocorax aristotelis
|
|
Common eider (not Shetland)
|
Somateria mollissima
|
|
Eurasian oystercatcher
|
Haematopus ostralegus
|
|
Ringed plover
|
Charadrius hiaticula
|
|
Grey plover
|
Pluvialis squatarola
|
|
Red knot
|
Calidris canutus
|
|
Purple sandpiper
|
Calidris maritima
|
|
Dunlin
|
Calidris alpina
|
|
Black-tailed godwit
|
Limosa limosa
|
|
Bar-tailed godwit
|
Limosa lapponica
|
|
Eurasian curlew
|
Numenius arquata
|
|
Common redshank
|
Tringa totanus
|
|
Ruddy turnstone
|
Arenaria interpres
|
Pressures on marine waterbird populations
The main pressures affecting wintering waterbirds include climate change (Pavón‐Jordán et al., 2019), habitat loss and degradation and human disturbance.
Climate change
Climate change can influence waterbird populations directly and indirectly. Direct effects of climate change can arise through environmental changes such as warmer temperatures and changes in predominant wind direction. These environmental changes have profound effects on waterbird migration. Warmer temperatures can advance aspects of the bird’s life cycle for instance, by leaving wintering grounds early and arriving at breeding grounds too early for peak prey availability or exposing birds to higher rainfall, leading to increased chick mortality. Wintering ranges of some species are also changing. In the UK, warmer temperatures have shifted the distributions of eight out of nine common species of wader over-wintering on estuaries eastward, where they can take advantage of better feeding in areas that previously would have been too cold (Maclean et al., 2007). Shifts in wintering range are also partly a consequence of reduced migratory behaviour. Some wader and waterfowl species are travelling shorter distances between summer and winter than previously. Changes in predominant wind direction and also effect both the timing and ability of individuals to complete their migratory journey and occurrences of storm events in breeding and wintering areas can cause occasional high mortality of waterbirds. The intensity and potential frequency of such events is likely to increase, under climate change.
Indirect impacts are associated largely with loss of foraging habitat and availability of prey. Sea-level rise can cause coastal erosion and flooding in some areas. It is also likely to cause ‘coastal squeeze’, whereby large areas of coastal habitats may be lost (Maclean et al., 2007).
Habitat loss and degradation
Habitat loss and damage due to a variety of coastal activities such as development of coastal defences, land reclamation, dredging and construction of marinas etc. can also have serious impacts on waterbird numbers, particularly waders and estuarine waterfowl where this leads to the disappearance of intertidal habitat and their prey (del Hoyo et al., 1996).
The removal of prey species either directly through fisheries or incidentally through disturbance to the seabed can result in reduced availability of food particularly shellfish, for various waterbird species such as common scoter, common eider, red knot and Eurasian oystercatcher. Changes to seabed sediment affect not only benthic feeders (such as common eider) but may also impact water column feeders (for example Slavonian grebe) as changes occur in mobile prey.
The reduction in the enrichment of many estuarine mudflats, as a result of better regulation of sewage discharges and nutrient runoff, has resulted in a decline in the abundance of some species (e.g. greater scaup) as the productivity of the estuaries has declined.
Some benthic feeding species are visual foragers and accordingly may be affected by water clarity in terms of foraging success.
Disturbance, displacement and barrier effects
Sea ducks and divers are sensitive to visual disturbance. In the marine environment, disturbance can be associated with shipping activities, offshore windfarms and dredging. Disturbance from vessel traffic causes waterborne birds to take flight. Some species are more sensitive than others, with some species (e.g. red-throated diver) taking flight sooner (larger flush distance from the source of disturbance) and taking longer to return to the area, causing temporary habitat loss (Schwemmer et al., 2011). Schwemmer et al. (2011) also found indications of habituation in sea ducks within areas of channelled traffic.
Benthic feeders, such as sea ducks and divers, are reported as the species guild showing highest vulnerability to disturbance and/or displacement from habitat due to offshore wind farms (Furness et al., 2013) indicating that artificial structures may act as barriers to movement for several species. Displacement and barrier effects can potentially cause additional energetic demands on birds and ultimately threaten adult survival by preventing feeding or access in favoured areas and/or increasing the distance required to get to foraging areas as birds fly around rather than through the windfarm. The additional energy required to divert around individual wind farms is potentially small in the context of long migratory flights however, there could still be barrier effects for sea ducks which move between marine feeding and roosting areas daily during winter (e.g. common scoter and long-tailed duck).
Waders such as common redshank, red knot and ruddy turnstone are sensitive to pedestrian, vehicle, and watercraft disturbance, especially at roost sites, on and along shorelines and at their main estuarine areas (Goodship & Furness, 2019).
The marine wintering waterbird index gives a measure of changes of abundance of the selected species. If split into regional indicators it could also give a crude indication of distribution changes. Further research would be needed to relate these to the Feature Activity Sensitivity Tool (FeAST) described pressures. A decline or increase in the index does not indicate which of the FeAST pressures (if any) may be causing that change. The UK Marine Strategy (page 53) reports that ‘the indicators used were unable to distinguish human impacts from the effects of prevailing environmental conditions’.
The specific FeAST described pressures acting on mobile species that are thought to be significant for wintering waterbirds are listed below.
- Death or injury by collision above water
- Death or injury by collision below water
- Barrier effects
- Nitrogen and phosphorus enrichment*
- Organic enrichment*
- Physical change to another seabed type*
- Physical removal (extraction of substratum)*
- Physical loss – to land or freshwater habitat*
- Reduction in prey*
- Removal of non-target species (including lethal)
- Removal of target species
- Synthetic compound contamination from pollution incidents/ accidental spills or bioaccumulation
- Visual disturbance (behaviour)
- Climate change
* via habitat loss or degradation
Comparison with other assessments
In comparison to other indices this marine wintering waterbird index uses a more targeted approach. The selection of species for the marine wintering waterbird index differs to the UK marine wintering waterbird index as reported in the UK Marine online assessment tool (Cefas) United Kingdom Marine Monitoring and Assessment Strategy (UKMMAS), which reports trends in many waterfowl that are not strongly associated with marine environments (Mitchell et al., 2018). In spatial scale it is also more targeted than the UK Marine Strategy (Defra, 2019) which reports that ‘The population size of marine bird species has not declined substantially since 1992 as a result of human activities’.
For the OSPAR and UK Marine Strategy Assessments data on trends in annual abundance of waterbird species in Scotland have been combined with data from elsewhere to assess marine bird abundance across the Greater North Sea and Celtic Seas OSPAR regions (OSPAR, 2017) and UK Marine Strategy sub-regions (Mitchell et al., 2018). The WeBS data included in those assessments also have a filter used to remove inland sites. The marine wintering waterbird index presented here is specific to Scotland.
The conclusions that can be drawn from this index are comparable to those of the other assessments that apply to wider UK (UKMMAS) and European (OSPAR) seas, but interpretation needs to take account of the differences in the indices.
The coastal filter applied by the BTO to data for UK Marine Strategy and OSPAR still leaves many species that are not associated with the marine environment and therefore it would be misleading to include them in the marine wintering waterbird index. For example, the OSPAR Marine bird abundance indicator reports 100% of Greater North Sea surface feeding species are above the threshold, but these are data from only one species (shoveler) that is not generally regarded as a marine species. Similarly that report includes in its headline figure, eight grazing species which includes coot and various swans and geese. These are species unlikely to be reflective of the health of the seas and are not included in the index reported here. The WeBS analysis for the OSPAR and UKMMAS also includes annual mean values of birds at sites (from July to June), so includes data from outside the winter period. The marine wintering waterbird index uses counts only obtained over the winter period. The area covered in this assessment is the whole of Scotland (including islands) but density of coverage varies.
The datasets used in the assessment are the WeBS core count data available from the BTO web site. BTO use the WeBS data to construct the waterbird index annually. The methods are detailed in the Wetland Bird Survey, Survey Methods, Analysis and Interpretation 2017 report. These annual WeBS indices are used for the ‘Wintering Waterbirds in Scotland (S04)’ indicator (SNH, 2018). This marine wintering waterbird index uses a subset of that full selection.
The primary data collection method is monthly counts of all wetland species present at a wide selection of wetland sites made by volunteers, as temporally coordinated as possible.
These counts (termed ‘core counts’, the term used by BTO to refer to counts taken at the core sites for the WeBS survey) are entered into the database by the observers or a local co-ordinator. It is these core counts that are used for the WeBS annual indices, the wintering waterfowl indicator and this marine wintering waterbird index. The database system includes some validation on entry in terms of sense-checking and unusual counts are flagged for checking by local or national organisers.
Detail of the treatment of incomplete counts in the data is given in the WeBS indices construction document. Provided that there are sufficient actual counts (counts where the number of birds present is determined by a field visit) then on the occasions when a particular site has not been visited, an expected count for each species is calculated (imputed) based on the pattern of counts at that site across months, years and also the pattern observed at other sites. Only sites that have at least 50% of all possible visits undertaken are treated in this way and used in the index. The underlying assumption is that the pattern of change in numbers across these sites (the index) is representative of the pattern of change in numbers at the country level.
The counts for the selection of sites are then compared with the baseline (initial count) for the series. In the WeBS indices data from 1975/76 are used for the baseline.
A smoothed trend is fitted to each species counts using Generalised Additive Models (GAMS), smoothing being used to reduce influence of unusually high or low numbers. The wintering waterbirds index comprises individual species indices covering a range of waterfowl and waders. This means also that group indices (for waterfowl and waders) can be produced. The overall and group indices are geometric means of the individual species indices.
As the Wintering Waterbirds in Scotland (S04) indicator includes taxa with a non-marine association, the marine wintering waterbird index presented here is constructed from a subset of the full wintering waterbird index as published by NatureScot (SNH, 2018). The data on 24 species (Table a) of marine waterbirds selected from the 41 species of all waterbirds occurring in Scotland are used here to create an index of change.
The full ‘Wintering Waterbirds in Scotland (S04)’ indicator (SNH, 2018) undergoes internal review before release, with senior members of species team or marine ornithologists in NatureScot.
Biases in data
Issues with the WeBS distribution of survey sites were identified in Austin et al. (2007). They considered that wader trends will be biased towards changes occurring in estuaries, as the periodic non-estuarine survey indicated that WeBS only monitor between 25 and 50% of the wintering ringed plover, purple sandpiper and ruddy turnstone. To some extent the sea duck indices will also be biased towards changes in estuarine environments, although the proportion of overall numbers that are covered by the WeBS core counts is less well known.
Austin et al. (2007) considered that multi-species indicators may obscure important trends in individual species, and so these individual trends also should be considered when assessing the indicator changes.
The methods document on the BTO website details likely bias in the trends to be borne in mind while considering the trend outputs.
Confidence in Indicator Assessment
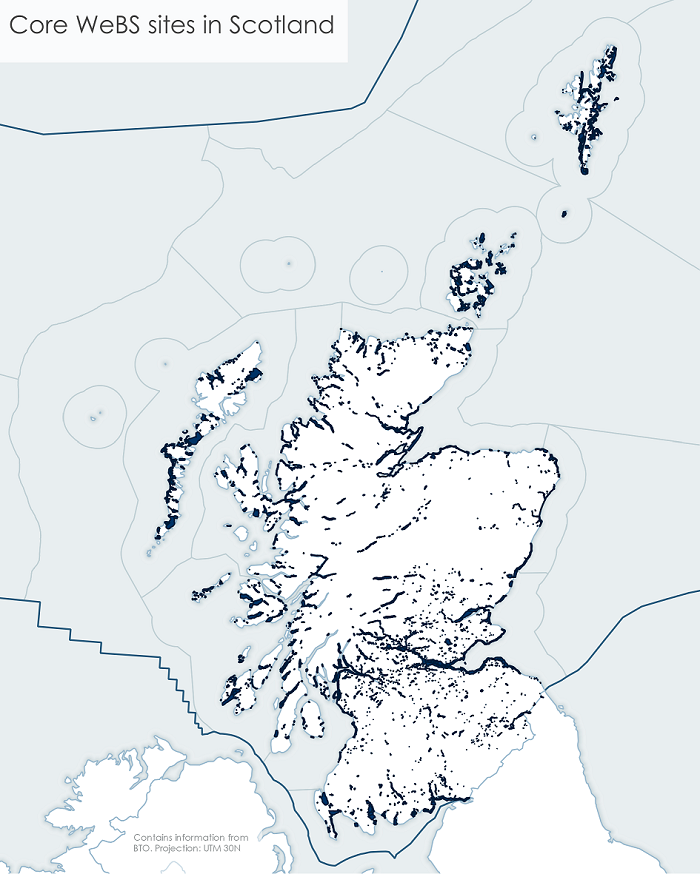
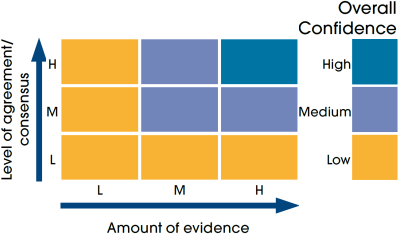
The confidence in the data is high, but the confidence assessment for the index for marine species presented here is medium. The reason is that at present although the taxa selected are closely associated with marine habitats, freshwater coastal sites are not excluded (Figure a). The degree of influence of freshwater wintering species on the index is considered to be small, but it is unknown.
The current assessment does not rely on expert judgement, as the indicator is built from empirical data. However, where species are cryptic or thought to be under-recorded there is some caution / interpretation required. Although marine species have been selected for the creation of this index, where those species occur inland those counts are also included. Separation of WeBS data by applying a ‘marine and coastal filter’ is possible and should be used in future. However the marine and coastal filter when applied does not exclude some near coast freshwater sites. Further refinement will be required in future to create an indicator that is properly reflective of marine health. Although in the current selection the occurrence of marine species on freshwater is not removed, the numbers of those will generally be low and not as potentially misleading as the inclusion of freshwater and terrestrial dependent species in the Oslo Paris Convention (OSPAR) and UKMMAS indicator. It is therefore much more tailored to reflecting health of waterbird populations in the marine environment.
Regional assessments
Trends are not currently available for Scottish Marine Regions because the core counts are land based and only have a limited applicability to offshore marine regions. The land based coverage for Scottish Marine Regions (SMRs) also varies (Figure a) and are currently not set up to be separated into SMRs. If counts were separated and indices constructed for the regions then extreme caution interpreting results should be applied where coverage is least extensive. Data could be extracted and analysed separately for UK Marine Strategy sub-regions although the same caveat would apply, with coverage of the east coast of Scotland and northern England more complete compared to coverage of the west coast.
Results
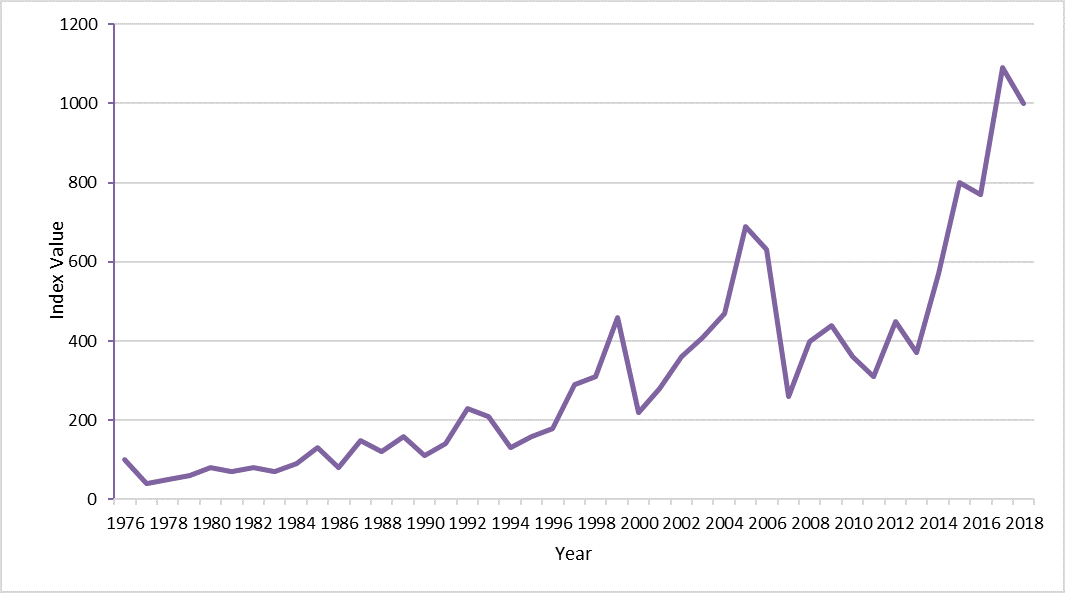
Since the 1975/6 winter the marine wintering waterbird index has increased, peaking in the winter 2002/03. Between 2010/11 and 2017/18 the index shows a small increase and recent years have been above the 1975/76 level (taken as baseline value of 100). Note that the smoothed index is unreliable at the very start and end of periods, but the index overall since 2011 has been above 100 (Figure 3), and has not been below 100 since 1986.

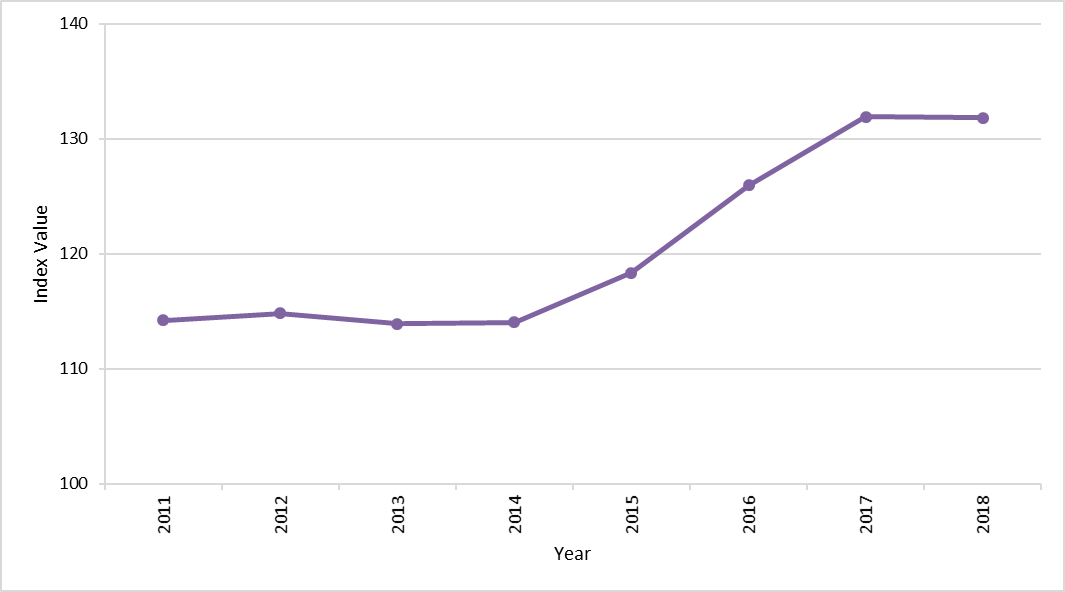
Since 2011 the index has increased, and is now around 130% of its baseline value in 1975/76, and 115% of its value from 2010/11. The average value of the smoothed index for that period is 121% (Figure 4).
The species within the index can be reduced to two functional groups waterfowl and diving species (Figure 5) and wading birds (Figure 6).
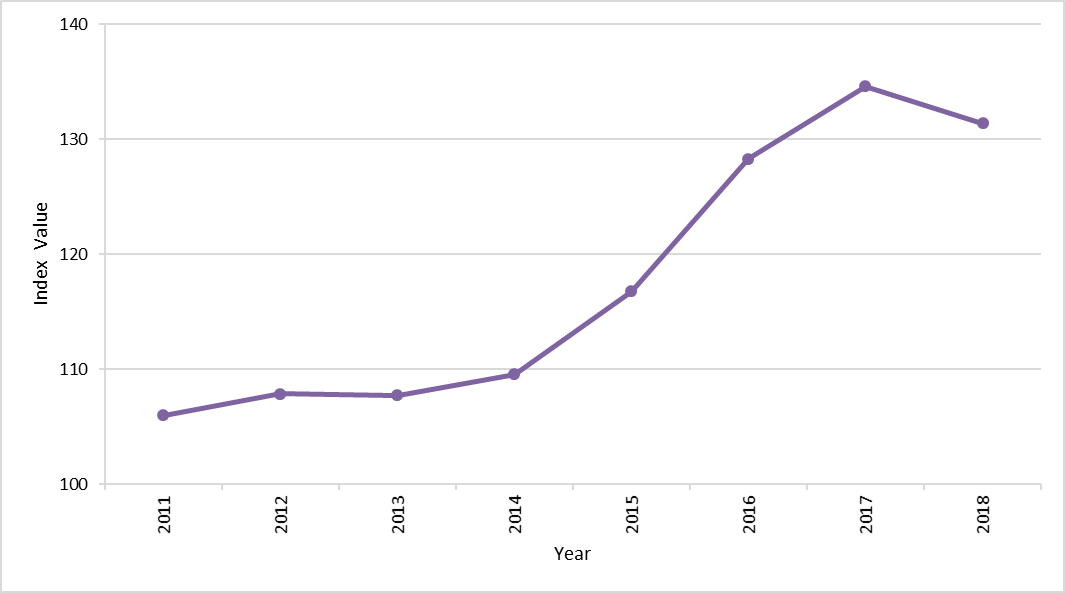
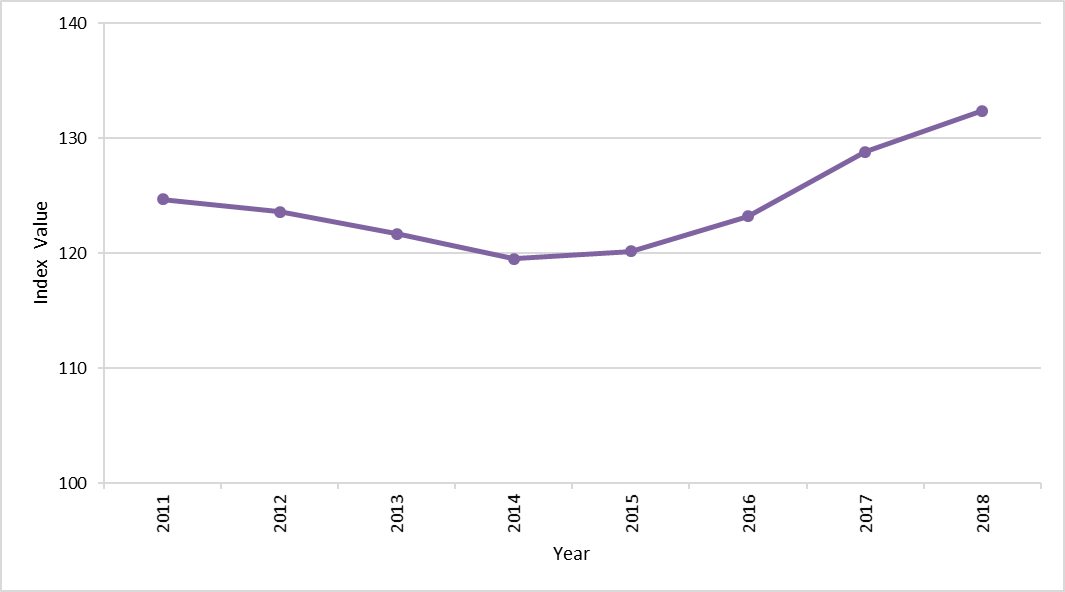
The short-term trends for these two groups are a little different, with the waterfowl index increasing rapidly from 2014 to 2017 and the wading bird index more slowly following a dip to a low point in 2013/14. Note that this recent low point is still 120% of the 1975/76 baseline value (Figure 6).
Table 1 shows the summarised trend (overall pattern of the index shown by that species in the 32 year period of the index values) for 24 species that contribute to the marine wintering waterbird index. The short term trend assessment is based on a comparison of the 5 year averaged index value which is a standard approach for assessing wintering waterbird populations.
|
Taxon
|
Overall trend from 1975/76 baseline to 2017/18
|
Change from 2011
(based on 5 year means - 2007/08 – 2011/12 and 2012/13 - 2017/18)
|
Group
|
|
Common shelduck(4)
|
Increase +55%
|
Stable 0%
|
Waterfowl
|
|
Greater scaup(4)
|
Decrease -74%
|
Decrease -12%
|
Waterfowl
|
|
Long-tailed duck(4)
|
Decrease -49%
|
Decrease -68%
|
Waterfowl
|
|
Common scoter(4)
|
Increase +80%
|
Increase +85%
|
Waterfowl
|
|
Velvet scoter(4)
|
Increase +138%
|
Increase +40%
|
Waterfowl
|
|
Red-breasted merganser(4)
|
Increase +41%
|
Stable -4%
|
Waterfowl
|
|
Common eider (not Shetland) (4)
|
Increase +23%
|
Decrease -15%
|
Waterfowl
|
|
Red-throated diver(1)
|
Increase +53% (since 1994)
|
Decrease -14%
|
Diving birds
|
|
Black-throated diver(1)
|
Increase +37% (since 1994)
|
Increase +70%
|
Diving birds
|
|
Great northern diver(1)
|
Increase +462% (since 1994)
|
Increase +67%
|
Diving birds
|
|
Slavonian grebe(1)
|
Increase +143% (since 1994)
|
Increase +16%
|
Diving birds
|
|
Great cormorant(2)
|
Stable +6%
|
Stable -5%
|
Diving birds
|
|
European shag(3)
|
Decrease -24%
|
Stable -9.5%
|
Diving birds
|
|
Eurasian oystercatcher(4)
|
Stable 0%
|
Stable +1%
|
Waders
|
|
Ringed plover(4)
|
Stable +8%
|
Stable -4%
|
Waders
|
|
Grey plover(4)
|
Increase +49%
|
Decrease -30%
|
Waders
|
|
Red knot(4)
|
Decrease -20%
|
Stable +8%
|
Waders
|
|
Purple sandpiper(4)
|
Increase +17%
|
Decrease -19%
|
Waders
|
|
Dunlin(4)
|
Decrease -41%
|
Stable +4%
|
Waders
|
|
Black-tailed godwit(4)
|
Increase +1386%
|
Increase +87%
|
Waders
|
|
Bar-tailed godwit(4)
|
Stable -7%
|
Stable -3%
|
Waders
|
|
Eurasian curlew(4)
|
Increase +59%
|
Stable -2%
|
Waders
|
|
Common redshank(4)
|
Decrease -33%
|
Stable -4%
|
Waders
|
|
Ruddy turnstone(4)
|
Increase +15%
|
Decrease -17%
|
Waders
|
- (1) Index values from winter 1994/95 onwards.
- (2) Index values from 1988/89 onwards.
- (3) Index values from winter 2003/04 onwards.
- (4) Index values from winter 1975/76 onwards.
In Table 1 an increasing or decreasing trend is assumed if there is a greater than 10% change between two time periods for calculation of mean value (although actual figures for change are also presented).
Of 24 species that are usually associated with marine habitats six have increased since 2011, seven have declined and 11 have remained stable.
Looking over the time series from 1975/76 to the most recent estimate in 2018:
- since 2011 the index of marine wintering waterbirds (Figure 4) has increased following a period of sustained increase from 1986 until peaking in winter 2002/03 and then a short period of decline until winter 2009/10. The index was stable until 2014/15 when the current increasing trend started. By 2018, wintering numbers were 130% of the 1975/76 level.
- since 2011 the index of wintering waterfowl (Figure 5) reflected the marine wintering waterbird index being relatively stable until winter 2013/14 and then increasing. Data from 13 species are included in the wintering waterfowl index.
- the wading bird index does not fully reflect the wintering waterbird index with the wading bird index steadily declining between 2010/11 and 2013/14 before then steadily increasing (Figure 6). Data from 11 species are included in the wading bird index.
Selected individual species index values are shown in Figures b to i.
Waterfowl and diving birds
Thirteen species are included in the wintering waterfowl index. These include five sea duck (greater scaup, common eider, long-tailed duck, common scoter and velvet scoter), shelduck, red-breasted merganser, three divers (red-throated diver, black-throated diver and great northern diver), Slavonian grebe and cormorants (great cormorant and European shag).
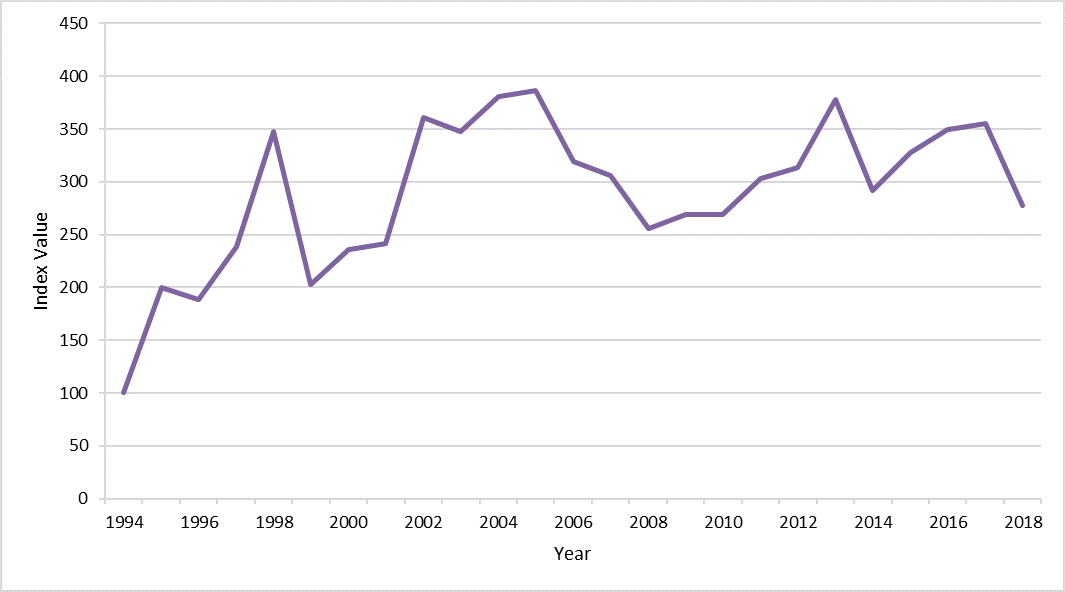
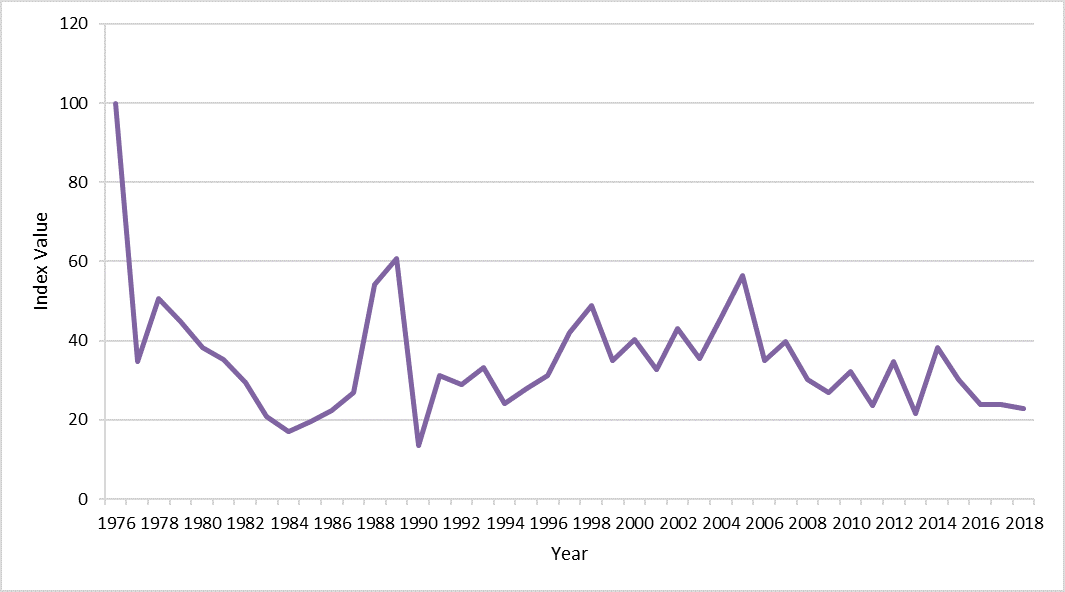
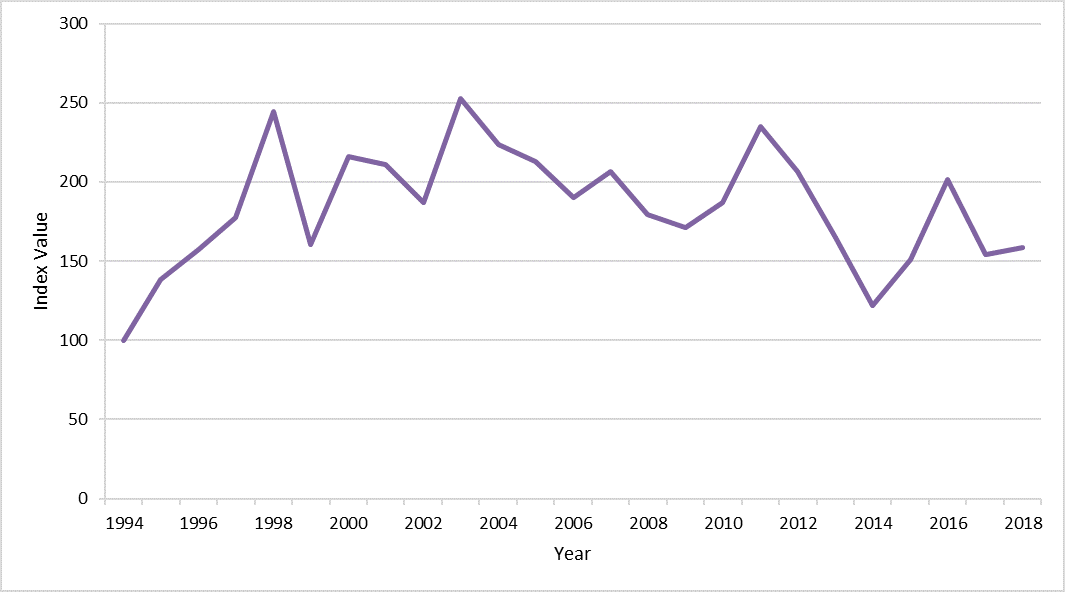
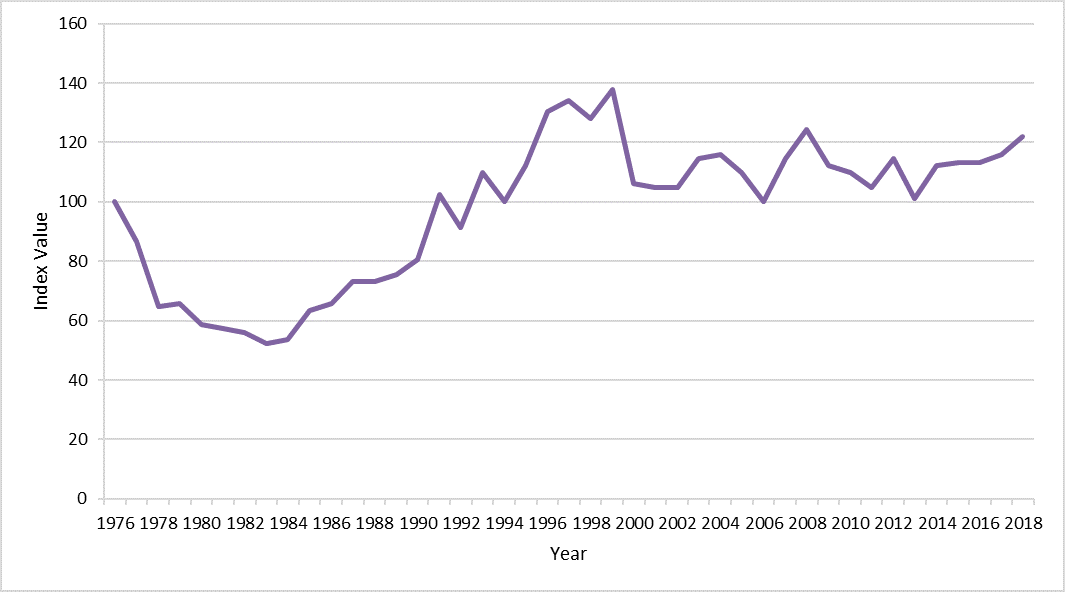
During the period 2011 to 2018, trends have increased for five species (common scoter, velvet scoter, black-throated diver, great northern diver and Slavonian grebe (Figure b). For all species this coincides with an overall long term increasing trend. However, caution should be applied to these index values as all species other than Slavonian grebe are predominantly offshore marine birds with large numbers occurring beyond the detection of land based counts. Trends for four species (long-tailed duck (Figure c), greater scaup (Figure d), common eider and red-throated diver Figure e)) have decreased during the same period. For long-tailed duck and greater scaup this coincides with a long term decreasing trend since the 1975/76 baseline value. For common eider and red-throated diver the overall long term trend has been an increasing trend. Red-throated diver show a low point in 2013/14 with some increase thereafter but not to the same extent shown in the late 1990s/early 2000s. Trends for common shelduck (Figure f), red-breasted merganser, great cormorant and European shag have remained relatively stable during the 2011 to 2018 period.

Wading birds
Eleven species are included in the wading bird index (Eurasian oystercatcher, ringed plover, grey plover, red knot, purple sandpiper, dunlin, black-tailed godwit, bar-tailed godwit, Eurasian curlew, common redshank and ruddy turnstone).
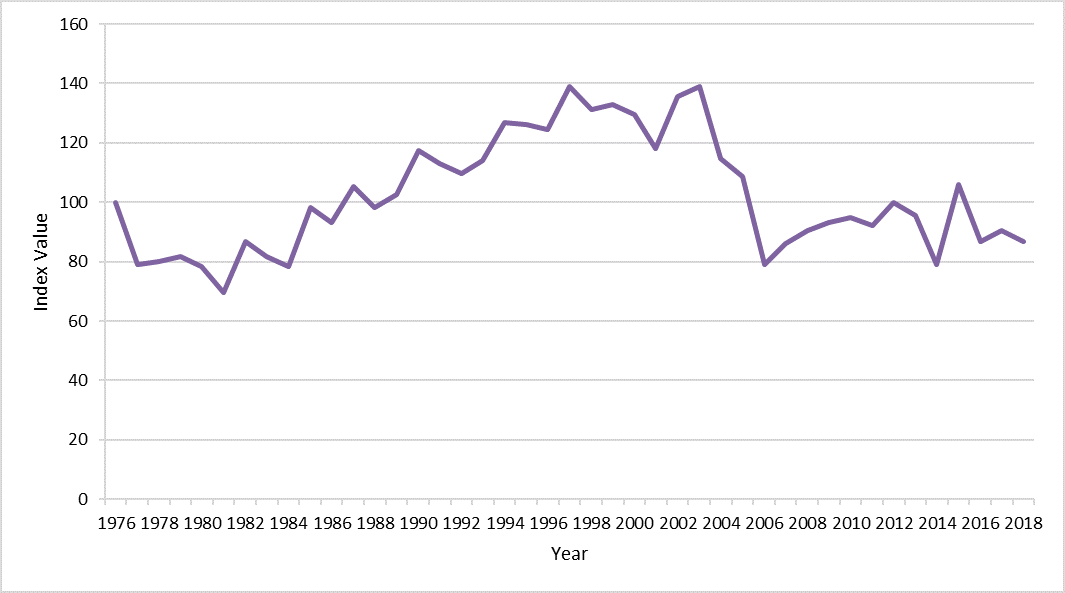
The trend for most wading birds (7 of the 11 species) has been stable during the period 2011 to 2018. For Eurasian oystercatcher (Figure g), ringed plover and bar-tailed godwit this coincides with an overall stable trend since the 1975/76 baseline value. The overall trend for red knot, dunlin and common redshank has been declining since the 1975/76 baseline value. Wintering Eurasian curlew, however, has been on an overall long term increasing trend (Figure h).
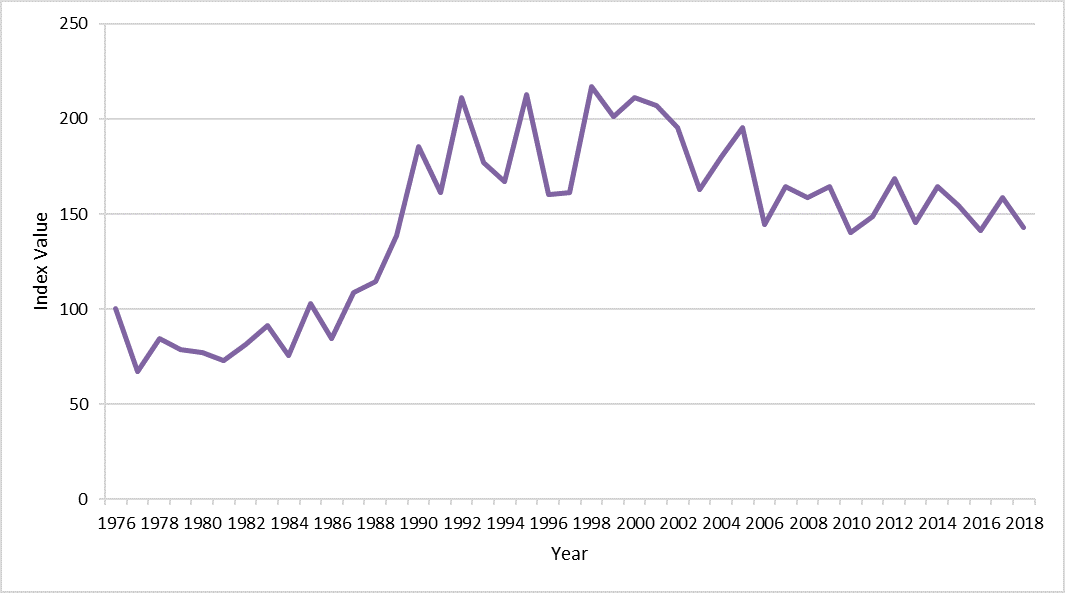
Black-tailed godwit was the only wading bird to increase during the period 2011-2018 (Figure i). The overall long term increasing trend for black-tailed godwit has been dramatic with numbers now exceeding the 1975/76 baseline value by 1,386% with an increase of 87% in the current index period reflecting a sharp increase in trend from 2013. Trends for three species (grey plover, purple sandpiper and ruddy turnstone) have decreased during the same period. The long term trend for these three species had been increasing since the 1975/76 baseline value. Purple sandpiper and ruddy turnstone are now at similar values to the 1975/76. Grey plover remains above the 1975/76 baseline value.
Conclusion
The marine wintering waterbird index, referenced to 1975, has fluctuated over time. It reached peak values in early 2000s and has since declined, but levelled off and even shown a slight increase in recent years so remains above baseline. The wintering waterbird indicator has increased 15% since 2011 and is 31% higher than it was in 1976.
Since 2011 the trend has been for an increase in the index, strongest for marine waterfowl and diver species. Black-tailed godwit, however, produced the highest increase in the index with an +87% change since 2011.
Although the trend line for the indicator incorporates counts of diver species and Slavonian grebe, caution should be applied as it is clear that there are significant populations not covered by regular WeBS counts. However, as the most important populations are now included in proposed SPAs, future monitoring of those SPAs will help provide a more robust marine wintering waterbird index.
Waders using the non-estuarine coast have shown decreasing trends at least since around 2000 for purple sandpiper and mid 1990s for ruddy turnstone. There is currently only occasional monitoring of these through national surveys (BTO Non Estuarine Wader Survey – NEWS). Coupled with relatively few researchers working on these species means declines may be going un-noticed, and drivers of population change are not understood.
Since 2011 the combined marine wintering waterbird index, the waterfowl and divers index and the wading birds index have all increased. The increase in the waterfowl and divers is small, but all three indices were above the 1976 baseline level in 2018. In early 2000s the combined index reached peak values. Minimum values were recorded in the early 1980s.
Although the wader trend has shown a decline since the late 1990s and early 2000s, the latest results show a slight upturn. Scotland is in an important position within the East Atlantic Flyway (the migration route used by waders). Scottish estuaries act as internationally important refuges for waders wintering and refuelling whilst en-route to other destinations. Six species have shown either long term (1975/76 to 2018) or short term (2011 to 2018) declines by 5 to 95% (ruddy turnstone, grey plover, common redshank, purple sandpiper, dunlin and red knot), all of which Scotland hosts internationally important numbers. Their individual trends follow a similar pattern, peaking between 1994/95 to 1999/99 then declining from 2002/03.
It has been shown that some species may shift in response to climate change (Pavón‐Jordán, 2019; Rehfisch et al., 2004), with good supporting evidence for red knot and dunlin populations being mobile responding to changes in food availability (Conklin & Colwell, 2008). For high Arctic breeding waders (ruddy turnstone and purple sandpiper) the reasons for change are not clear. Summers et al. (2012) highlighted breeding success as being a potential driver for purple sandpiper populations. There remains a lack of research, particularly on rocky shore waders to understand which factors are driving declines. Only one wader species, black-tailed godwit, has seen sustained increases in numbers. Black-tailed godwits are typically from the Icelandic sub-population which are increasing in response to agricultural and climatic change (Gill et al., 2007), but the increases in Scotland are not at a scale that reverse the large declines that have led to this species being listed as International Union for the Conservation of Nature (IUCN) Near Threatened list. Bar-tailed godwits are also Near Threatened; studies have shown that they are highly mobile in winter (Rehfisch et al., 2003), so the trend at a Scotland scale may not reflect what is happening at a broader scale.
Following a period of decline in numbers of wintering ducks and divers in the early 2000s, the waterfowl and diving birds index shows a levelling and then increase in numbers recently, so the period since the last atlas assessment has been mainly one of increase.
Prey resource of fish and shellfish are also exploited by humans. The impact of this exploitation beyond effects of disturbance is difficult to quantify, although a general rule of a third for the birds has been suggested (Curry et al., 2011). That wintering wader populations, and possibly seaduck populations fluctuate in line with prey stocks is shown by several studies (e.g. Atkinson et al., 2000; Cerveaci et al., 2015; Enst, 2006). Exploitation of stocks may reduce shellfish density, but also shellfish aquaculture can be associated with increased prey resource and marine waterbird densities (e.g. Zydelis et al., 2009).
Protection or management of shellfish stocks which limit take by humans would be expected to benefit some species included in the index.
Since 2011 the increasing index and the relative levels of the index both suggest that the marine environment is supporting good populations of wintering waterbirds. Underlying that, there are differing individual species trends and to some extent the group trends. Historically the high-point of the indices in the late 1990s and early 2000s suggest higher populations could be supported by the Scottish marine environment, although the current positive index shows populations are greater than at the baseline period.
This index should be constructed from data on marine species wintering at marine sites. Other marine waterbird indices use surface feeding, grazing and scavenging species that also utilise freshwater and terrestrial habitats. To address impacts on the health of the marine environment it is recommended that a more strictly marine focus is maintained for this assessment.
Knowledge gaps
There is a lack of knowledge on the key drivers for the declining waterbirds. Most notably waders using non-estuarine (rocky shore) sites.
The reason for the decline in both marine wintering waterfowl and waders since the end of the 1990s is unclear, as are the reasons for the increase in the decades prior to that.
Many of these birds have dispersed populations and are difficult to monitor. The populations of marine species that occur further offshore such as long-tailed duck, common eider and great northern diver are not generally covered by regular monitoring. A scheme to monitor populations of divers and seaduck found in the marine proposed SPAs would go some way to addressing this.
Waders have been found to be negatively impacted by disturbance and habitat loss (e.g. Burton et al., 2006; Smit & Visser, 1993; Stillman et al., 2007; Whittingham et al., 2019) although the causal link to any declines has not been established. Prevention of disturbance at wader feeding and roosting sites, and particularly protection of wader foraging habitat would be of benefit to waders and to waterfowl species that are also vulnerable to disturbance (Smit & Visser, 1993).
Research is rapidly required across Scotland and indeed throughout their entire global range on waders using non-estuarine coasts, particularly ruddy turnstone and purple sandpiper, to understand the reasons for recent declines and look at possible measures to help populations.
Status and trend assessment
Data confidence is High. Indicator Confidence is medium.
It is not possible at this time to provide regional trends for Scottish Marine Regions.
|
Species group |
Status |
Assessment (2011 to 2017) |
|
Marine waterbird |
 |
|
|
Marine wader |
 |
|
|
Marine wildfowl |
 |
|
This Legend block contains the key for the status and trend assessment, the confidence assessment and the assessment regions (SMRs and OMRs or other regions used). More information on the various regions used in SMA2020 is available on the Assessment processes and methods page.
Status and trend assessment
|
Status assessment
(for Clean and safe, Healthy and biologically diverse assessments)
|
Trend assessment
(for Clean and safe, Healthy and biologically diverse and Productive assessments)
|
||
|---|---|---|---|
 |
Many concerns |
No / little change |
|
 |
Some concerns |
Increasing |
|
 |
Few or no concerns |
Decreasing |
|
 |
Few or no concerns, but some local concerns |
No trend discernible |
|
 |
Few or no concerns, but many local concerns |
All trends | |
 |
Some concerns, but many local concerns |
||
 |
Lack of evidence / robust assessment criteria |
||
| Lack of regional evidence / robust assessment criteria, but no or few concerns for some local areas | |||
 |
Lack of regional evidence / robust assessment criteria, but some concerns for some local areas | ||
| Lack of regional evidence / robust assessment criteria, but many concerns for some local areas | |||
Confidence assessment
|
Symbol |
Confidence rating |
|---|---|
|
Low |
|
|
Medium |
|
|
High |
Assessment regions
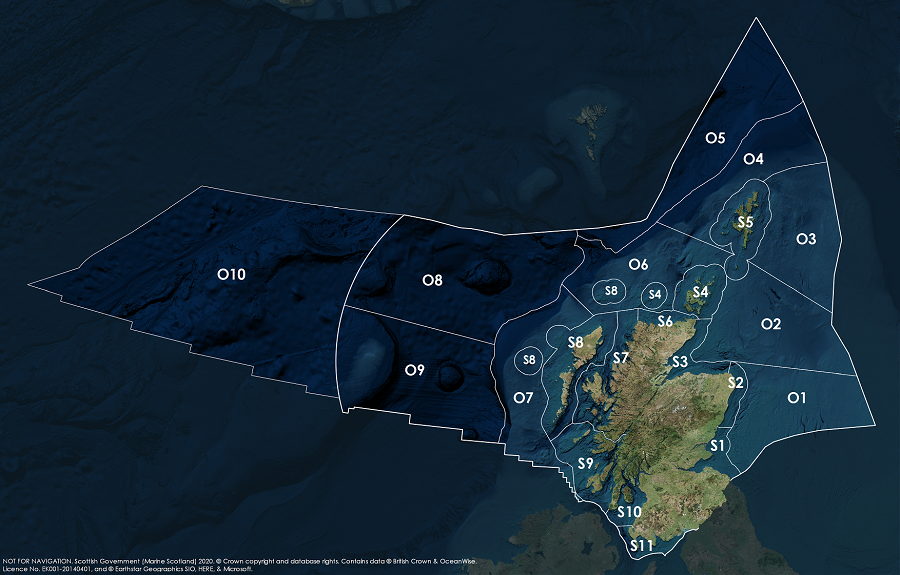
Key: S1, Forth and Tay; S2, North East; S3, Moray Firth; S4 Orkney Islands, S5, Shetland Isles; S6, North Coast; S7, West Highlands; S8, Outer Hebrides; S9, Argyll; S10, Clyde; S11, Solway; O1, Long Forties, O2, Fladen and Moray Firth Offshore; O3, East Shetland Shelf; O4, North and West Shetland Shelf; O5, Faroe-Shetland Channel; O6, North Scotland Shelf; O7, Hebrides Shelf; O8, Bailey; O9, Rockall; O10, Hatton.
