
Background
This indicator is used to assess the status of six types of subtidal biogenic habitats (i.e. habitats formed by key animal or algal species): blue mussel, horse mussel, flame shell, maerl and seagrass beds, as well as serpulid aggregations (Figure 1), in relation to the target set by the UK Marine Strategy Part 1 (UK Government, 2012; 2019). These habitats are encompassed by the intertidal and continental shelf reporting category.
The indicator estimates losses in the coverage of these six habitats within each Scottish Marine Region (SMR) derived from surveys between 2011 and 2018. Losses could arise from physical disturbance, for example the use of demersal and static fishing gear, or anchoring, as well as a range of other factors such as overfishing, changes in the flow characteristics of the water resulting from engineering works, and potentially from climate change, ocean acidification and pollutants (including from fish farming). Furthermore, natural drivers of change; disease, storm action and fluctuations in recruitment of the habitat-forming species, are also possible factors.
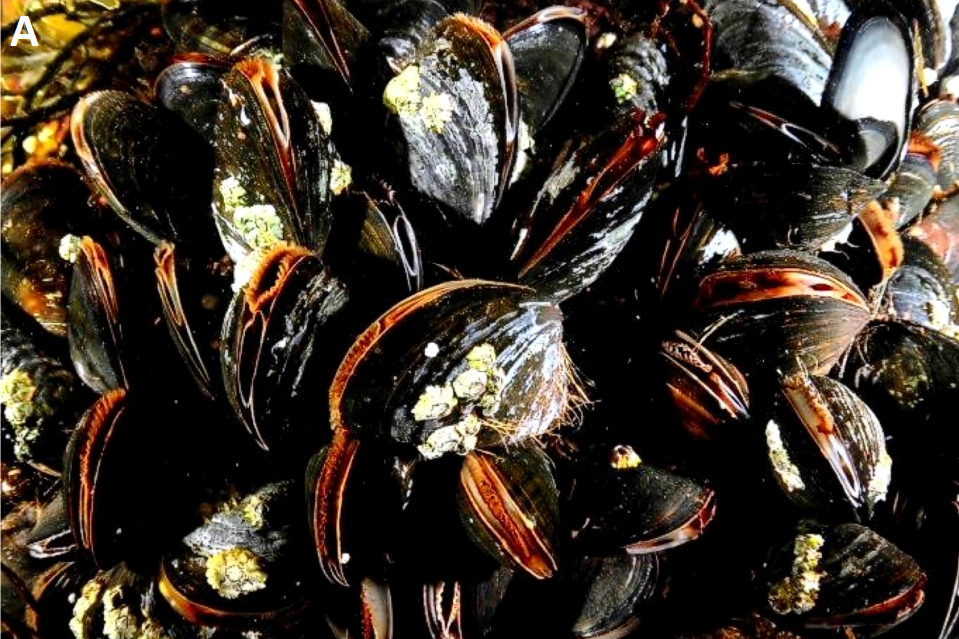
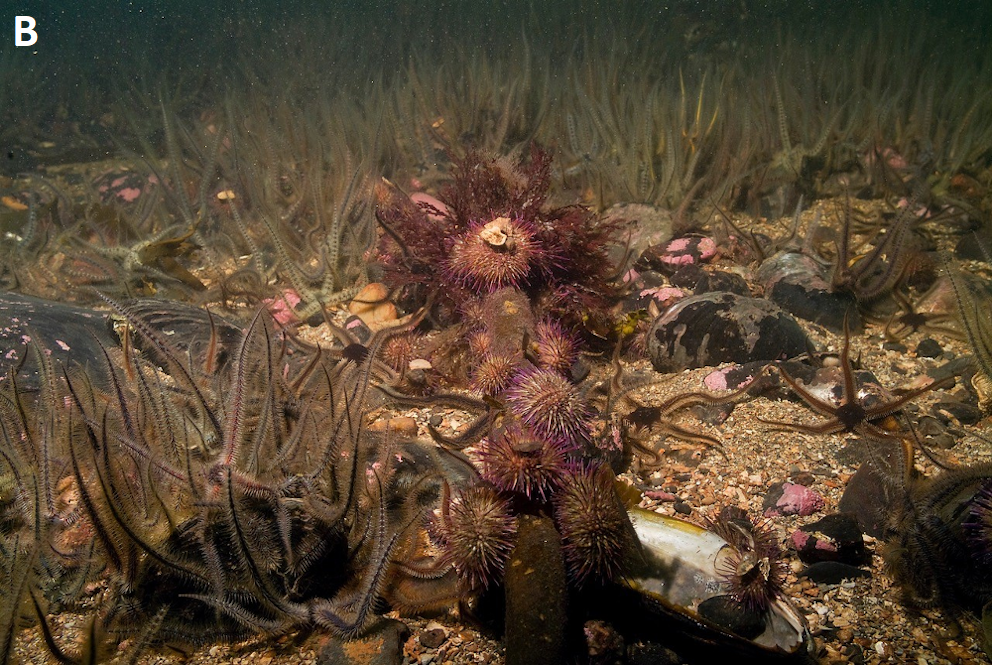
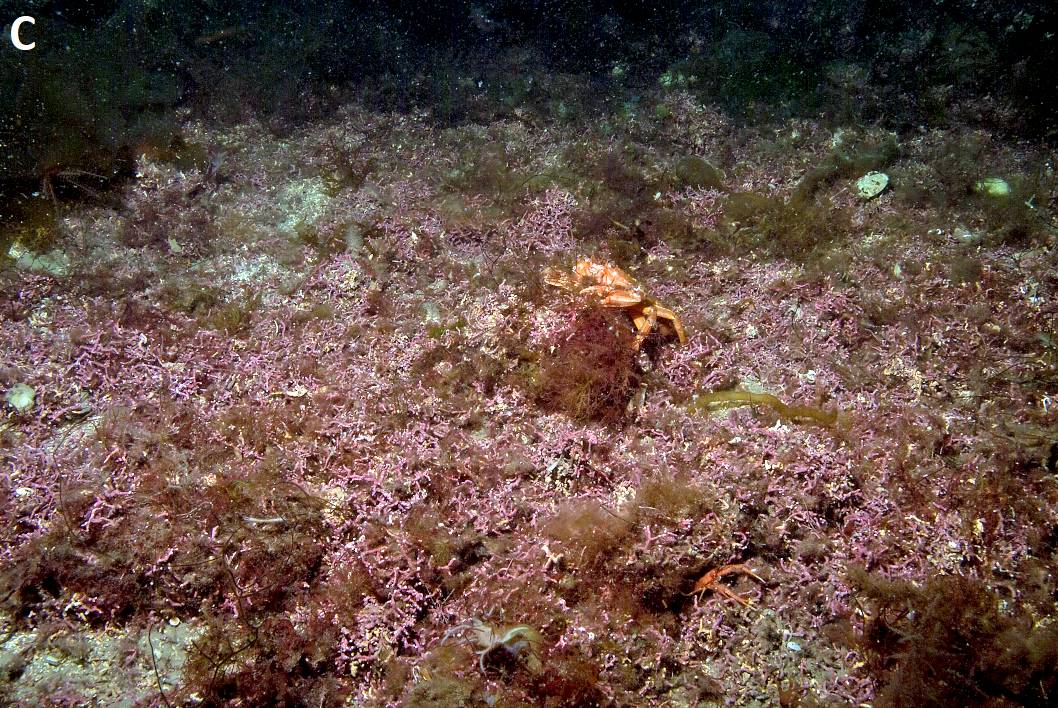

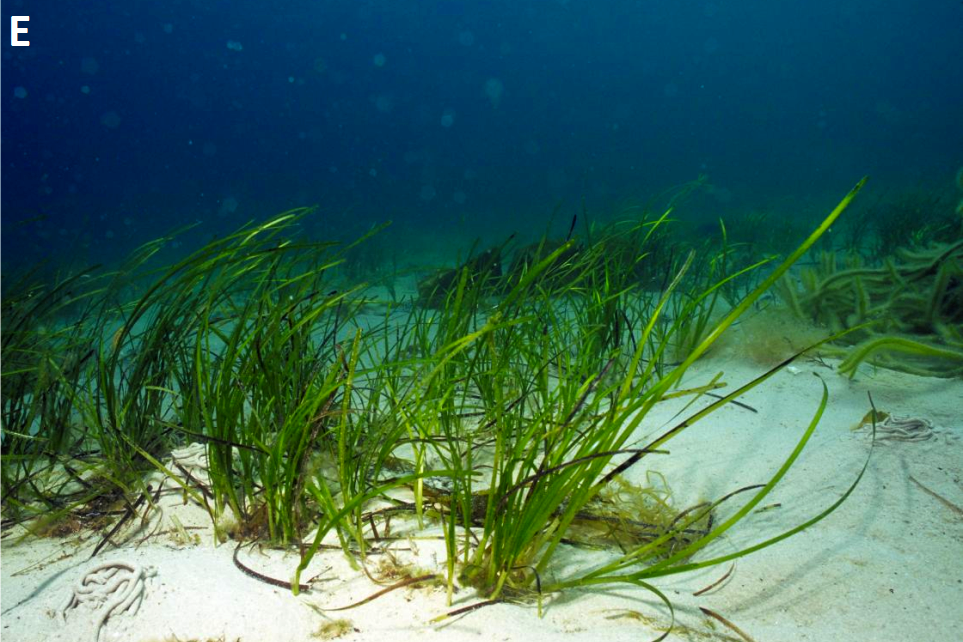
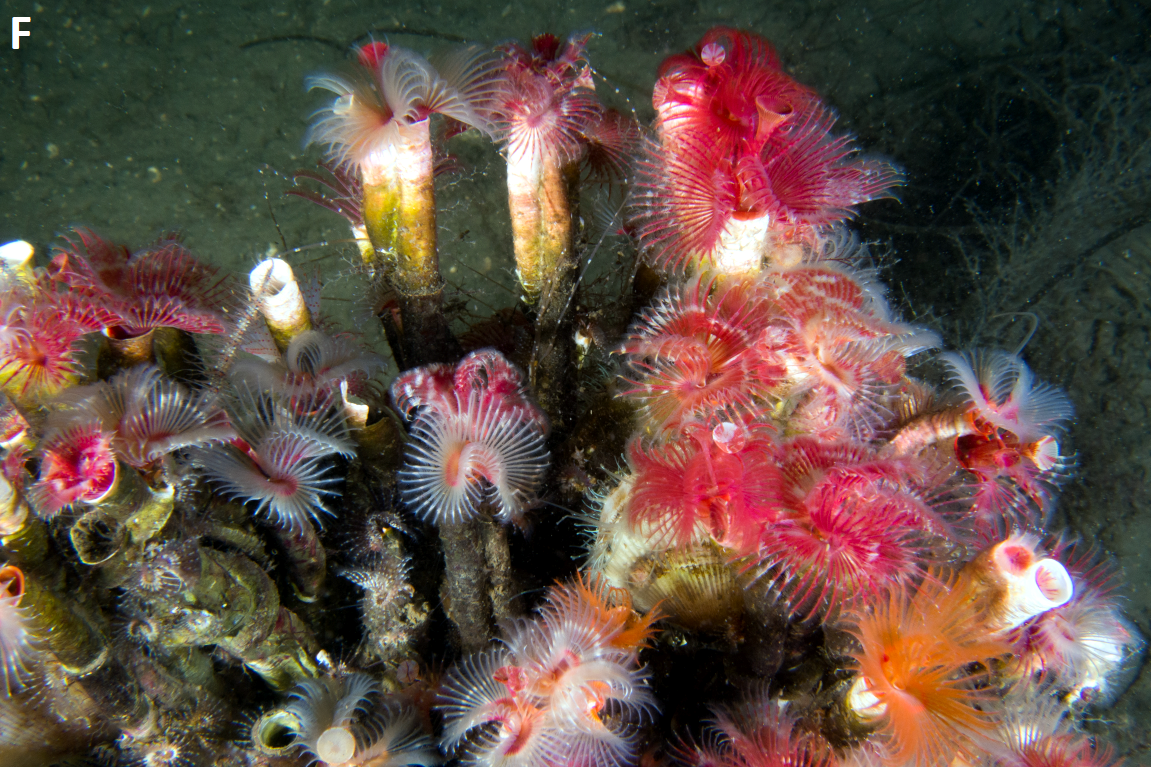
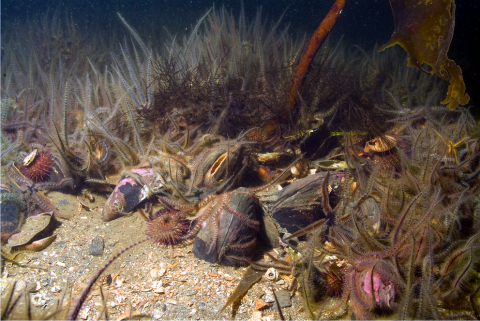
Figure 1: Illustrations of the six biogenic habitats considered by the biogenic habitat loss indicator. A, blue mussel bed; B, horse mussel bed; C, maerl bed; D, flame shell bed; E, seagrass bed; F, serpulid aggregation. © NatureScot.
The habitats are all Priority Marine Features and are habitats for which monitoring information is required to fulfil UK legislative requirements (Robson, 2014). All biogenic habitats are known to respond to anthropogenic disturbance which in turn affects coverage, with reductions being indicative of probable impacts to the wider marine environment.
The data underpinning the assessment are largely derived from surveys undertaken as part of marine protected area development and monitoring programmes run by NatureScot and Marine Scotland, together with historical baseline data drawn from the SNH GeMS database of Priority Marine Features.
Baseline reference extent values for the six biogenic habitats were derived for each of the 11 Scottish Marine Regions. Estimates of extent for each habitat were initially obtained from the NatureScot GeMS database within ArcGIS 10.2. GeMS contains polygons delimiting the extent of known beds, as well as additional point records lacking in associated areal coverage data. These initial estimates were adjusted where possible by reference to the survey and academic literature, which also facilitated the inclusion of additional occurrences of the habitat. For example, incorporation of seagrass habitat extent data from published pre -2011 surveys (Harries et al., 2007; Malthus et al., 2006) significantly modified the GeMS polygon based estimate of the habitat for the Outer Hebrides.
Recent survey literature was also reviewed in detail to identify and quantify examples of habitat loss or gain recorded during the period 2011 to 2018. The indicator metric adopted was the estimated total area of biogenic habitat lost within a region. A threshold of zero loss was set as the indicator target in line with the UK’s stated target for the condition of listed biogenic habitats (DEFRA, 2014). Percentage loss of extent was also calculated for each habitat type for each region to signify the scale of loss.
Additional measures of habitat condition were considered for integration into the indicator or to provide supplementary evidence for assessment of biogenic habitat condition. Several parameters based on the characteristics of the infaunal community were considered as indicators of the condition of maerl beds. The Infaunal Quality Index (IQI) has not currently been developed for subtidal sediment core samples (UK Technical Advisory Group, 2012), although it has been applied to maerl core data (Fitch, Cooper, Crowe, Hall-Spencer & Philips, 2014). The difficulty in setting reference values for species diversity metrics and multimetric measures such as the M-AMBI (Muxika, Borja & Bald, 2007) that incorporate diversity data is particularly significant for maerl habitats that display wide natural variation in infaunal diversities. The Azti Marine Biotic Index (AMBI) has been adopted here to provide supplementary quantitative assessment of maerl bed condition. This assesses habitat condition based on the relative abundance of taxa belonging to different disturbance-tolerant categories (Borja, Franco & Pérez, 2000). Muxika, Borja & Bonne (2005) have mapped the spectrum of possible AMBI scores against the ecological status categories of water bodies for the Water Framework Directive: ≤1.2 (high), >1.2 - ≤3.3 (good), >3.3 - ≤4.3 (moderate), >4.3 - ≤5.5 (poor), >5.5 (bad). AMBI scores were calculated for all known core samples (10 cm diameter core, sediment screened for infauna on 1 mm mesh sieve) collected from Scottish maerl beds since 2011 as part of marine protected area monitoring programmes. Four or five replicate core samples collected from 29 maerl beds throughout Scottish waters have been analysed. See Results (extended) for further details. In addition pre-2011 replicate core samples have been analysed from 12 of these locations to provide temporal comparisons.
Results
The percentage loss in extent recorded during the assessment period 2011 to 2018 for each of the biogenic habitats for each region is shown in Table 1, as well as the aggregated total loss in hectares for each region. The target quality threshold of zero loss was not met in five of the regions: Moray Firth, West Highlands, Outer Hebrides, Argyll and Clyde.
There were insufficient data to provide assessments for the remaining six regions and the table reflects a paucity of data on biogenic habitat extent for Scottish Marine Regions in general. Recorded losses in the Clyde relate to flame shell and maerl beds at just one location (Loch Fyne). Marked losses in flame shell and serpulid aggregation habitats were principally responsible for the target not being met for Argyll, whereas seagrass and serpulid habitats were the significant contributors to loss in the Outer Hebrides and West Highlands respectively. Pronounced reduction of blue mussel beds in the Dornoch Firth were solely responsible for the recorded habitat loss in the Moray Firth.
|
Scottish Marine Region
|
Habitat (% loss)
|
Total loss (ha)
|
Target met
|
|||||
|
Blue mussel
|
Flame shell
|
Horse mussel
|
Maerl
|
Seagrass
|
Serpulid aggs
|
|||
|
Forth and Tay
|
?
|
-
|
?
|
-
|
?
|
-
|
?
|
?
|
|
North East
|
-
|
-
|
-
|
-
|
-
|
-
|
?
|
?
|
|
Moray Firth
|
99.5
|
-
|
Stable
|
-
|
?
|
-
|
217
|
No
|
|
Orkney Islands
|
-
|
?
|
?
|
?
|
?
|
-
|
?
|
?
|
|
Shetland Isles
|
?
|
-
|
?
|
?
|
?
|
-
|
?
|
?
|
|
North Coast
|
-
|
-
|
-
|
?
|
-
|
-
|
?
|
?
|
|
West Highlands
|
?
|
<1
|
?
|
?
|
?
|
>90
|
20
|
No
|
|
Outer Hebrides
|
?
|
-
|
?
|
?
|
27.1
|
-
|
180
|
No
|
|
Argyll
|
?
|
53.3
|
Loss
|
?
|
Loss
|
35.0
|
>78
|
No
|
|
Clyde
|
?
|
9.1
|
?
|
9.9
|
?
|
-
|
23
|
No
|
|
Solway
|
?
|
-
|
-
|
?
|
?
|
-
|
?
|
?
|
Confidence in assessments
Confidence for all assessments is low. The role played by anthropogenic factors in driving change in habitat extent at the surveyed locations is generally not understood. There is no firm evidence for a linkage except for loss of flame shell habitat in West Highlands. For most of the habitats the level of confidence in baseline and current habitat extent data is low and so recorded reductions in extent of specific beds does not necessarily imply a global reduction within a region.
The level of accuracy of quantitative habitat loss assessments for particular beds is likely to be highly variable, although high confidence can generally be placed on the qualitative identification of loss. Apart from flame shell beds and serpulid aggregations, assessments are mostly based on temporal trend data derived from only a small proportion of the likely total extent of the feature within a region. The indicator includes losses recorded since 2011 but the precise timing of losses is generally unknown. Thus, in some cases loss may have predated 2011 with the post 2011 trend following a different projection.
Results of review of literature for assessment of habitat loss
Seagrass beds
Outer Hebrides
The Sound of Barra hosts extensive areas of seagrass beds. Harries et al. 2007 provide a coverage estimate of 360 ha based on 2006 survey work, of which 260 ha is mapped within the NatureScot GeMS database. Based on analysis of satellite imagery underpinned by ground-truthing an overall trend of thinning of the beds in the Sound of Eriskay was identified by Harries et al. 2007 between 2001 and 2006, although increase in seagrass density was noted locally. Hydrological changes resulting from the construction of the Eriskay causeway were identified as a possible driver of the change, although natural temporal fluctuation in density may also have been a significant factor.
Recent analysis of satellite imagery from 2005 to 2017 reveals that the process of eelgrass thinning is continuing (Figure a). Plant loss is particularly marked to the east of the Eriskay causeway (bed A in Figure a). Some redistribution of eelgrass appears to have taken place to the west of the causeway, although overall density appears lower, particularly within bed B (Figure a). Drivers for seagrass decline clearly extend beyond causeway construction as marked thinning and contraction of beds can also be identified up to 8 km to the south-west off Fiaray (Figure a) and Fuday. No quantitative assessments of eelgrass loss have been carried out but the visual impression from the satellite imagery is that several of the major beds have possibly lost, in the order of, 50% of their cover between the years 2001 and 2017. This figure includes both thinning and peripheral contraction of beds.
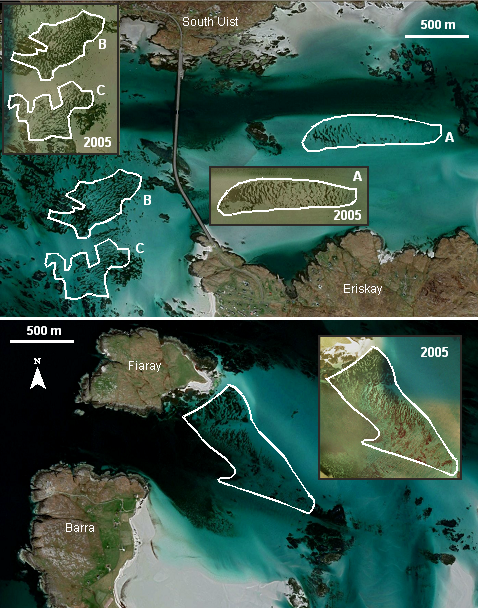
Figure a: Satellite imagery of the Sound of Eriskay (upper) and Sound of Fiaray (lower) in the Sound of Barra, with conspicuous seagrass patterning delimited by white lines. Main images from May 2017, with insets showing appearance of seagrass beds in January 2005. Seagrass cover is normally lower in winter time. © 2019 Google, Maxar Technologies and Getmapping plc.
Argyll
Complete eelgrass bed loss is known to have taken place recently in Loch Creran. Smith (1887) described the presence of a green sloping bank of Zostera marina extending for at least 'several hundred yards' in 1883, although its location within the loch was not stipulated. In 1989 Connor (1990) recorded a dense bed of Z. marina at around 1 m above chart datum along the northern shoreline of the lower basin. Moore et al. (1998) identified three small beds in 1998 along the northern shoreline of the lower basin, one of which is likely to have been the bed recorded by Connor (1990). The spatial extent of the beds was not measured, although it is probable that total extent was <1 ha. The last known record of Zostera marina in the loch is believed to be in 2002, the most developed bed of the three recorded by Moore et al. (1998). Subsequent surveys of the loch for eelgrass, the most recent in 2019, have failed to record any evidence of the continued presence of the species in the loch.
Unfortunately, the scale of eelgrass distribution in Argyll is quantitatively unknown. The GeMS database only includes coverage data for one bed amongst the Treshnish Islands; however, there is extensive presence of the habitat around Islay and in Loch Sween and Loch Craignish.
Other regions
Subtidal seagrass beds are known from all the other SMRs apart from North Coast and North East. Little is known about their extent (apart from Clyde) and data on temporal trends are insufficient to form a judgement on current status.
Flame shell beds
Clyde
Hall-Spencer & Moore (2000) reviewed the evidence for a decline in flame shell populations in the Clyde Sea area over the previous 40 years and implicated scallop dredging as a likely causative factor in their disappearance from a number of locations. Since 2011 the only bed to have been examined in the Clyde SMR is that at Otter Spit in Loch Fyne (Moore et al., 2013b). This may represent the only remaining bed in the Clyde area. A record of a bed south of Inchmarnock Island (GeMS database derived from Allen, Axelsson, Dewey & Clark, 2013) should be regarded as uncertain, as the record only relates to the finding of several flame shell nests which collectively represented nest coverage of the sea bed of <1%. In 2012 the extent of the Otter Spit bed was estimated to be 50 ha (Moore et al., 2013), however, its northern limit was found to have retreated from part of its former range. Based on the distribution of former records, bed loss is estimated at around 5 ha minimum (see Moore et al., 2013b). MPA monitoring here in 2015 indicated that no further habitat loss had taken place. Hall-Spencer & Moore (2000) report observing damage to the bed here by scallop dredging.
Argyll
The presence of a flame shell bed off Port Appin in Loch Linnhe, Argyll was first recorded in 1988 (Connor, 1989) and its distribution mapped by Moore, Harries & Trigg (2012) based on spot dive and diver transect records over the period 2001 - 2006 (Figure b). The bed covered an area of the order of 40 ha, although with some localised bare patches. As part of a broader programme for assessment of the distribution and condition of selected Priority Marine Features the bed was resurveyed in 2011 and was found to be extinct over most of its former range (Moore et al., 2012). It was restricted to three relict patches totalling 3 ha. A subsequent 2015 survey (Cook, 2016) failed to record the habitat on two of the three patches and this was confirmed by a 2018 survey (Heriot-Watt University, unpublished), which failed to observe the habitat on any of the three patches. The habitat was recorded to the north of its previously known distributional limit, although subsequent examination of the area suggests that extinction may now have occurred between 2018 and 2019.
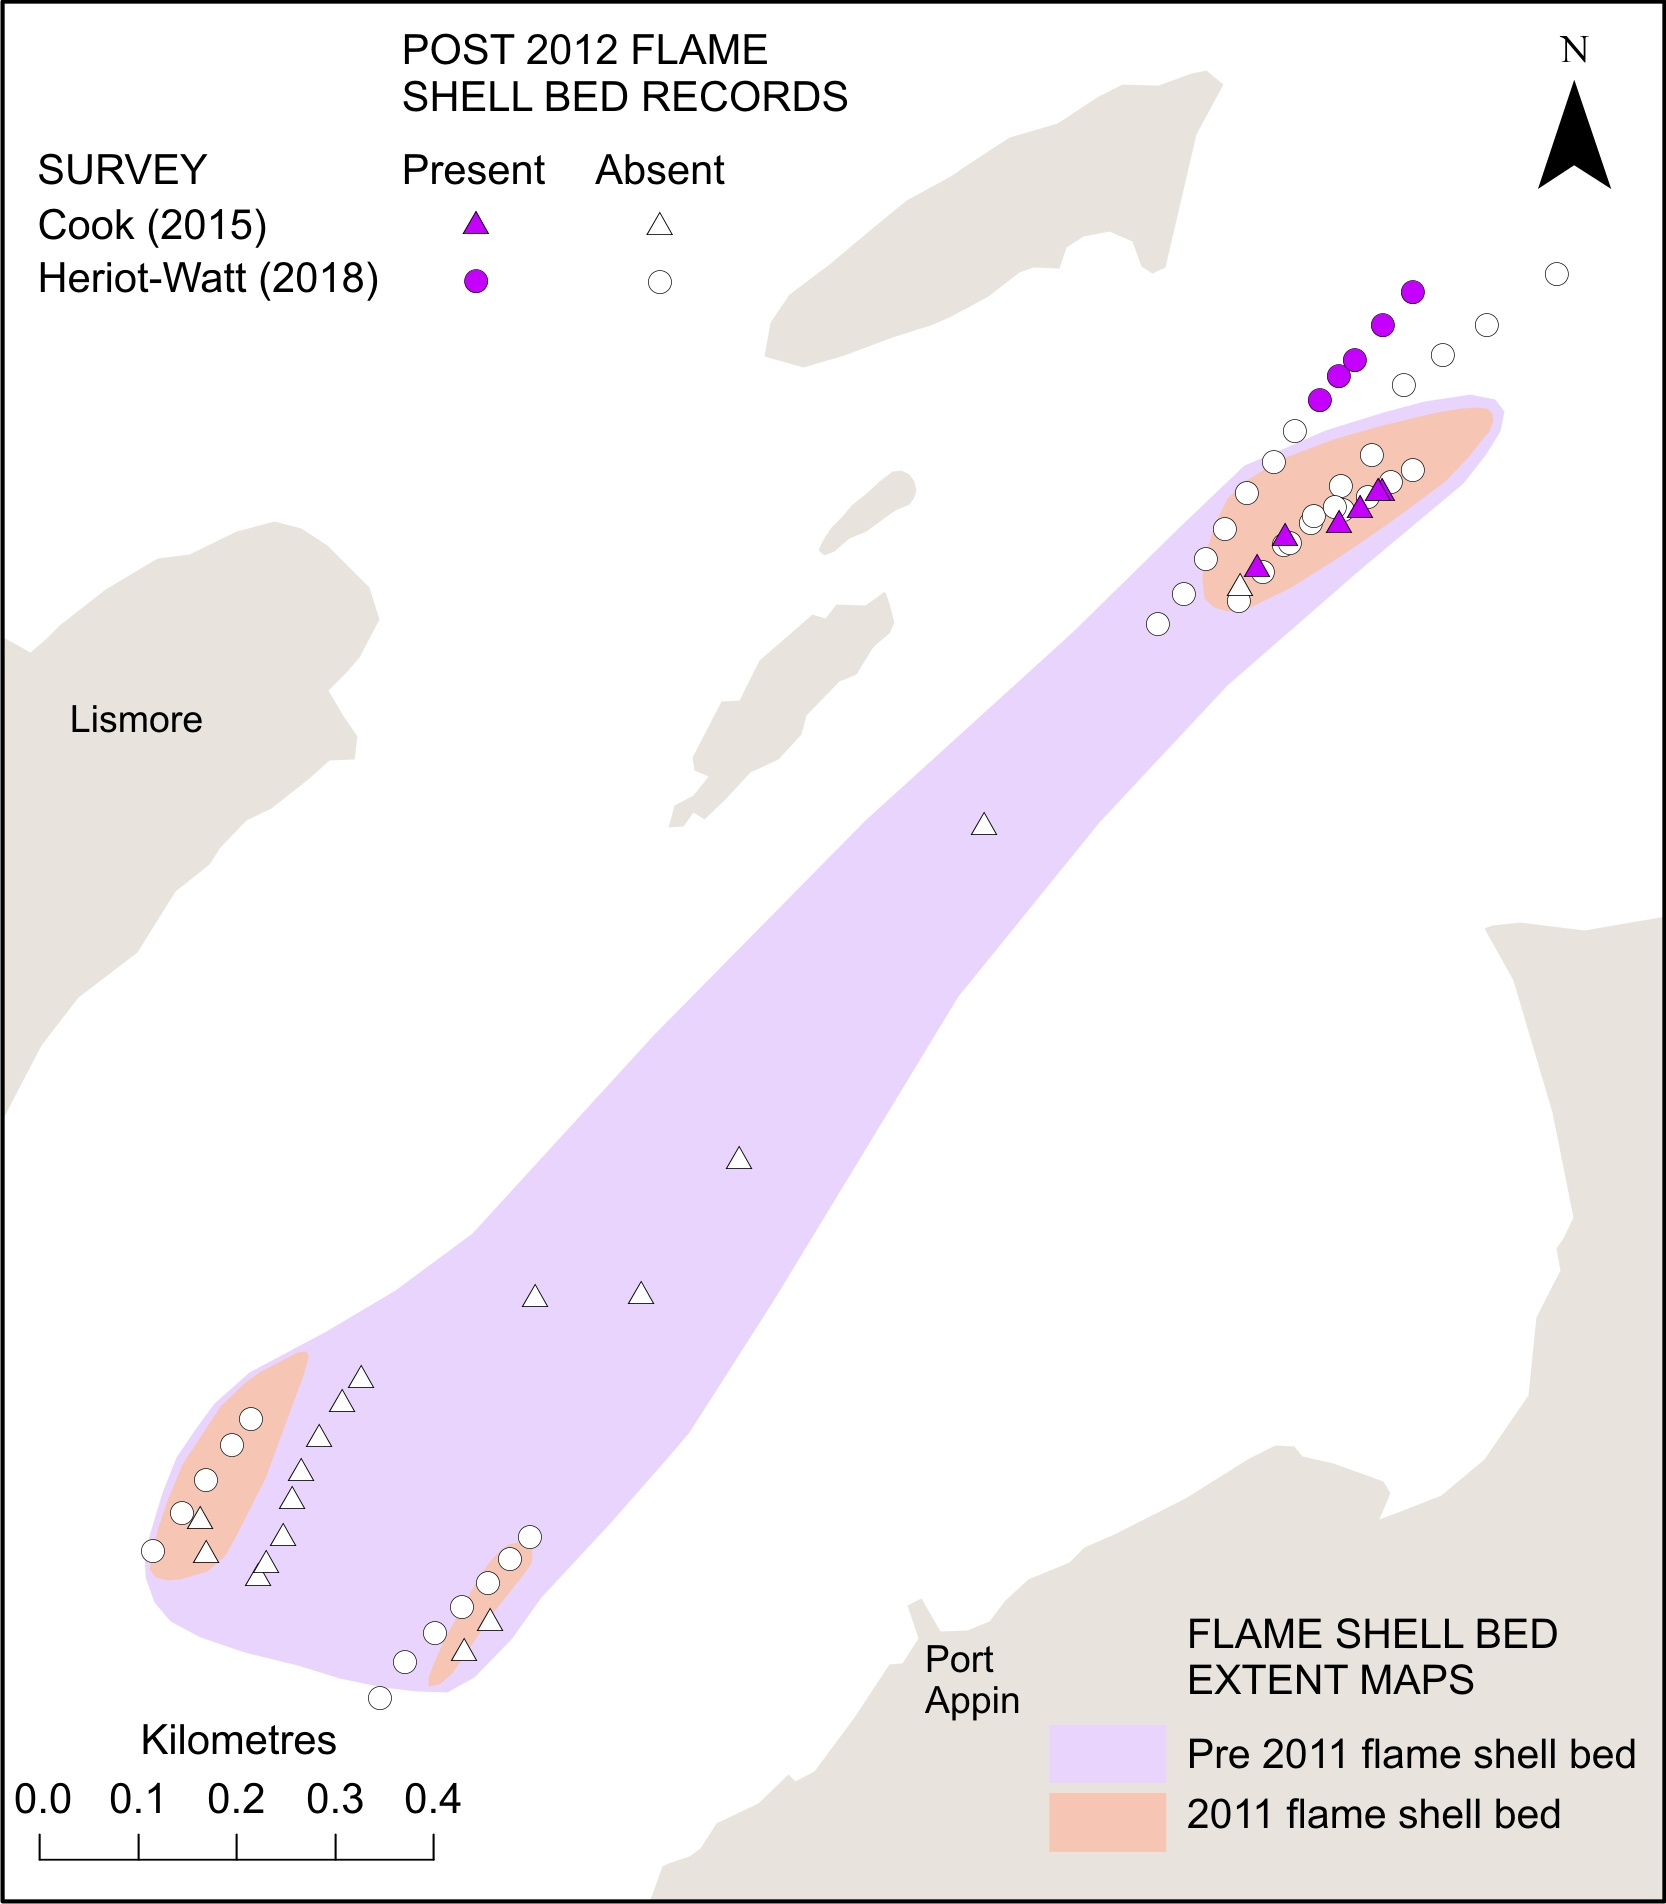
Figure b: Contraction of flame shell bed at Port Appin, Loch Linnhe, showing historical extent of bed based on pre-2011 records and following a detailed 2011 survey (Moore et al., 2012). Point records also shown for post-2012 surveys.
The same 2011 survey (Moore et al., 2012) carried out a comprehensive examination of the west coast of Shuna Island in order to validate a 1989 flame shell bed record (Connor (1989)). No evidence of the continued existence of the bed was found.
Flame shell beds were first mapped in Loch Creran in 2012 (Moore et al., 2013b) occupying a total area of 18.5 ha and split between two locations. However, as part of condition assessment work in 2018 (Moore et al., 2019) an additional bed was located and the measure of total extent of the habitat in the loch increased to 35 ha. The habitat was found to be in good condition; however, the increase in extent was likely to be due to the increase in spatial spread of survey sites rather than expansion of the habitat.
West Highlands
As in the case of Loch Creran measures of bed extent in Loch Alsh have increased from 75 ha in 2012 (Moore et al., 2013b) to 105 ha in 2016 (Moore et al., 2018) probably due to wider sample coverage rather than habitat expansion. Survey work in Loch Carron in 2017, following the damage to a flame shell bed by scallop dredging, recorded a total coverage of the habitat of 214 ha, with an estimated 0.4% (0.9 ha) exhibiting evidence of degradation (Moore et al., 2018). The flame shell population was able to persist in much of the damaged areas and particularly where the bed was well-developed, and it is considered that total habitat loss in Loch Carron is unlikely to be greater than 1%, although possibly significantly greater locally.
Since 2011 potential changes in other West Highland beds have been recorded in the Sound of Mull and off Wester Ross. A bed off Rubha an Ridire at the eastern entrance to the Sound of Mull was recorded in 1989 (Connor, 1989) but re-examination of the location in 2011 failed to record it (Moore et al., 2012). This was noted as being a small bed and so may have been missed. It appears likely that there has been some contraction of the small bed at Sruth Lagaidh Narrows in Loch Broom prior to 2011 (Moore, Harries, Trigg, Porter & Lyndon, 2011). Bed extent was assessed in 2010 as 7 ha. A survey of the site in 2017 found no firm evidence for a temporal change in bed extent since 2010, although there was an apparent improvement in habitat condition, in the form of an increase in the thickness and luxuriance of the byssal turf, which overtopped the bound pebbles and shells in 2017, but not in 2010 (Moore, 2019).
Recent SNH and Marine Scotland dropdown video surveys (2018 & 2019, unpublished) have identified the presence of several previously unrecorded flame shell beds in the region of the Inner Sound to the west and north of Loch Carron. The surveys were undertaken as part of the EMFF Project Engaging the Fishing Industry in Marine Environmental Survey and Monitoring.
Orkney Islands
Flame shell beds have been recently recorded at several locations in Scapa Flow (Hood, 2016; unpublished 2019 SNH/MS EMFF dropdown video survey). However, their extent, as well as temporal patterns in condition, are currently unknown.
Other regions
Flame shell beds are unrecorded in all other regions.
Serpulid aggregations
Argyll
In Loch Creran the serpulid worm tube aggregations form bushy, well-developed reefs up to 75 cm in height and 1-2 m in diameter. The extent of the serpulid reef habitat was assessed in 2005 as 108 ha (Moore et al., 2006). Most of the habitat appeared in good condition, albeit there was localised damage from demersal fishing, finfish and mussel farming, vessel moorings and organic pollution, although cessation of the organic discharge had led to some recovery of the habitat. Condition monitoring in 2017 to 19 based on diver, sidescan and single beam sonar surveying revealed a marked deterioration in the status of the habitat (Moore et al., 2019). There was widespread fragmentation of the reefs with loss of most of the larger structures (Figure c). A reef condition metric based on measures of reef canopy height, percentage of broken reef, tube occupancy by Serpula vermicularis, and the presence of pristine reefs, was determined from 40 diver transects passing through the habitat. The score ranged from 1 (pristine) to 8 (scattered broken reef rubble fragments supporting few serpulid worms). The mean score was 5.8 with 58% of transects providing the lowest scores of 7 - 8 (Figure d). No equivalent data are available for the 2005 survey, but based on considerable experience of the area, the mean score is likely to have been within the range 1 - 2. Thirty-five per cent of the transects in 2017 to 19 produced condition scores of 8 and this can be considered indicative of the scale of habitat loss.
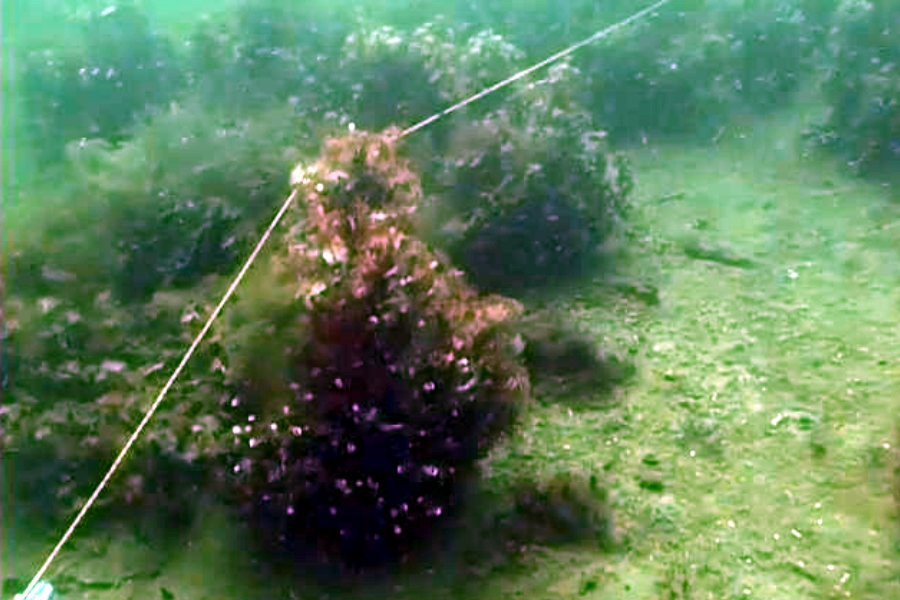
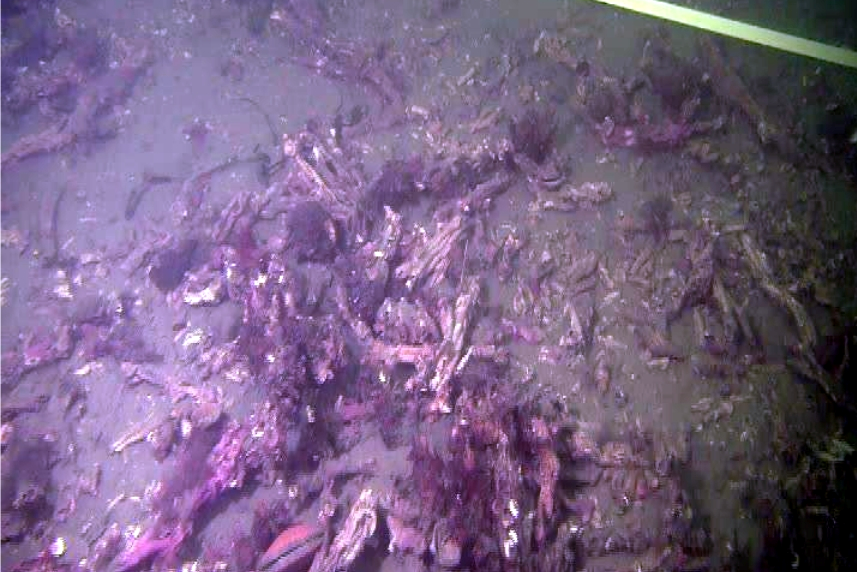
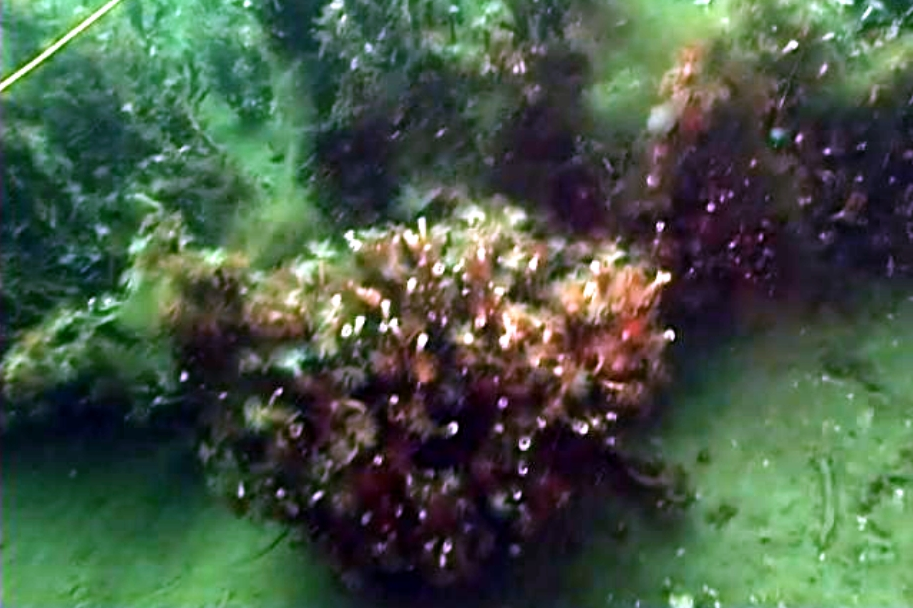
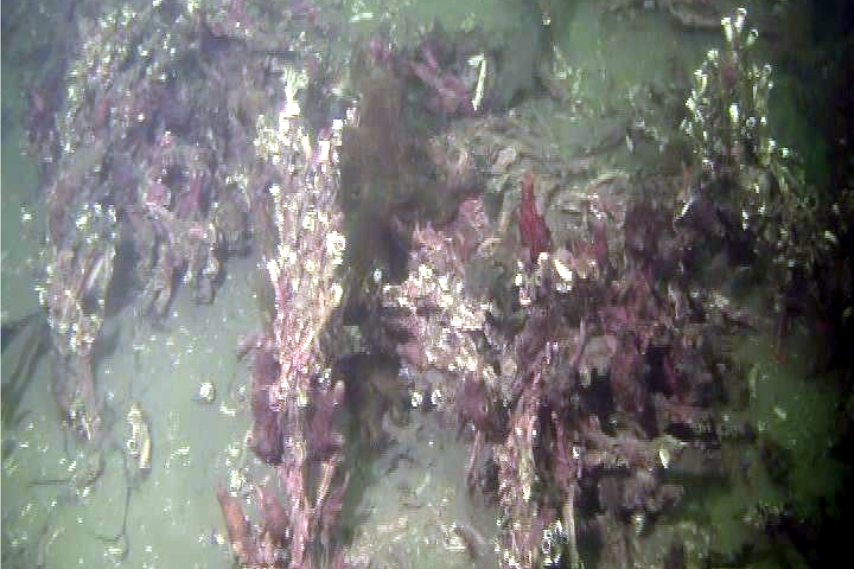
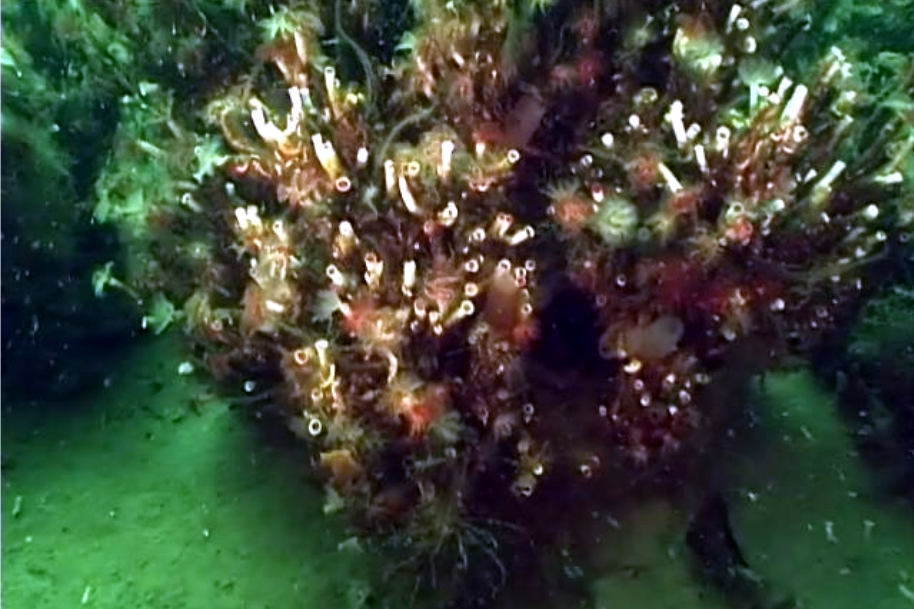
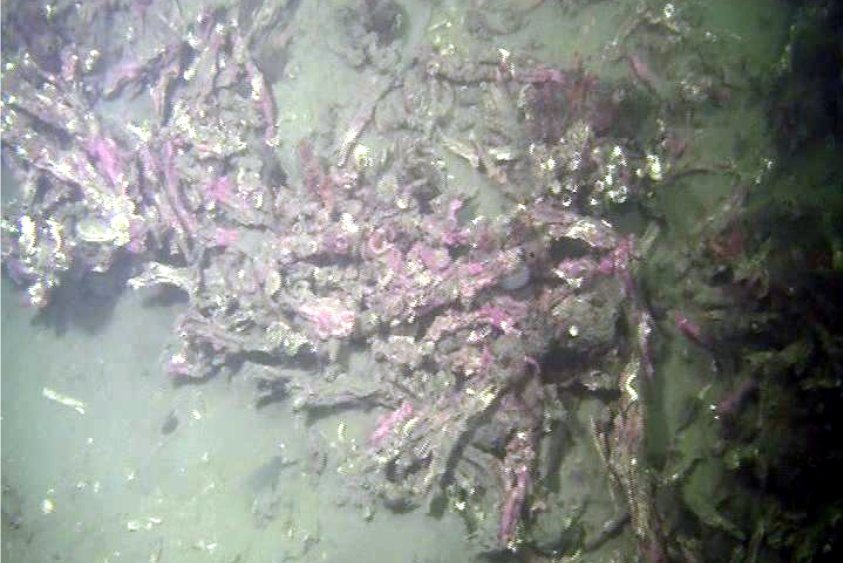
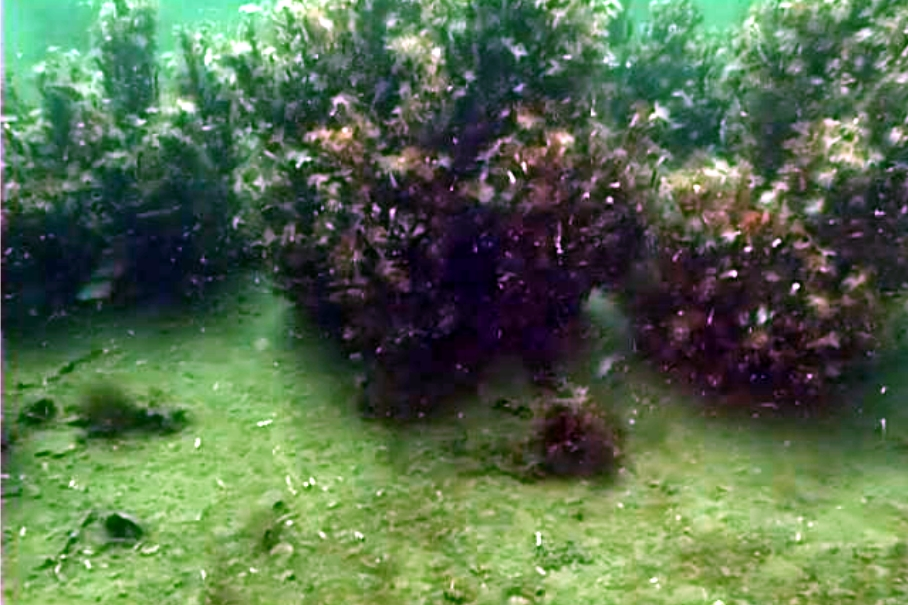
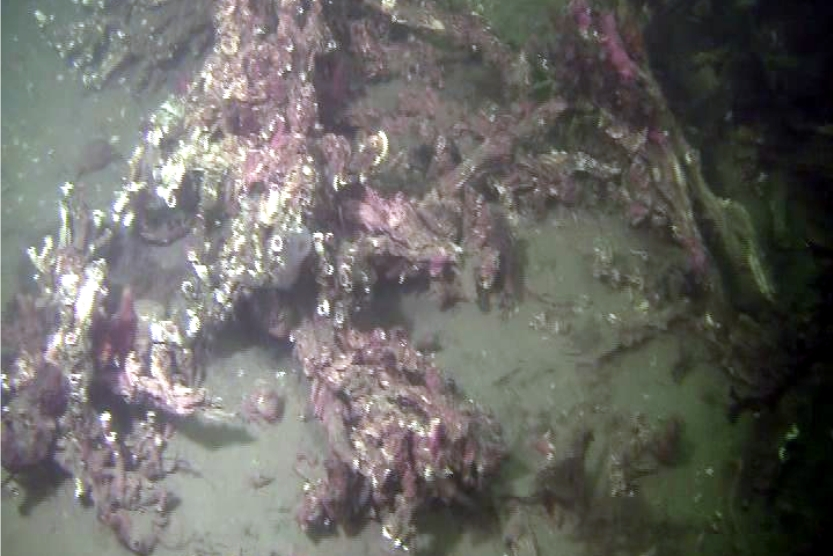
Figure c: Screen grabs from video taken along the same transect in Loch Creran in 2005 (left) and 2014 (right) showing temporal degradation of the serpulid habitat.
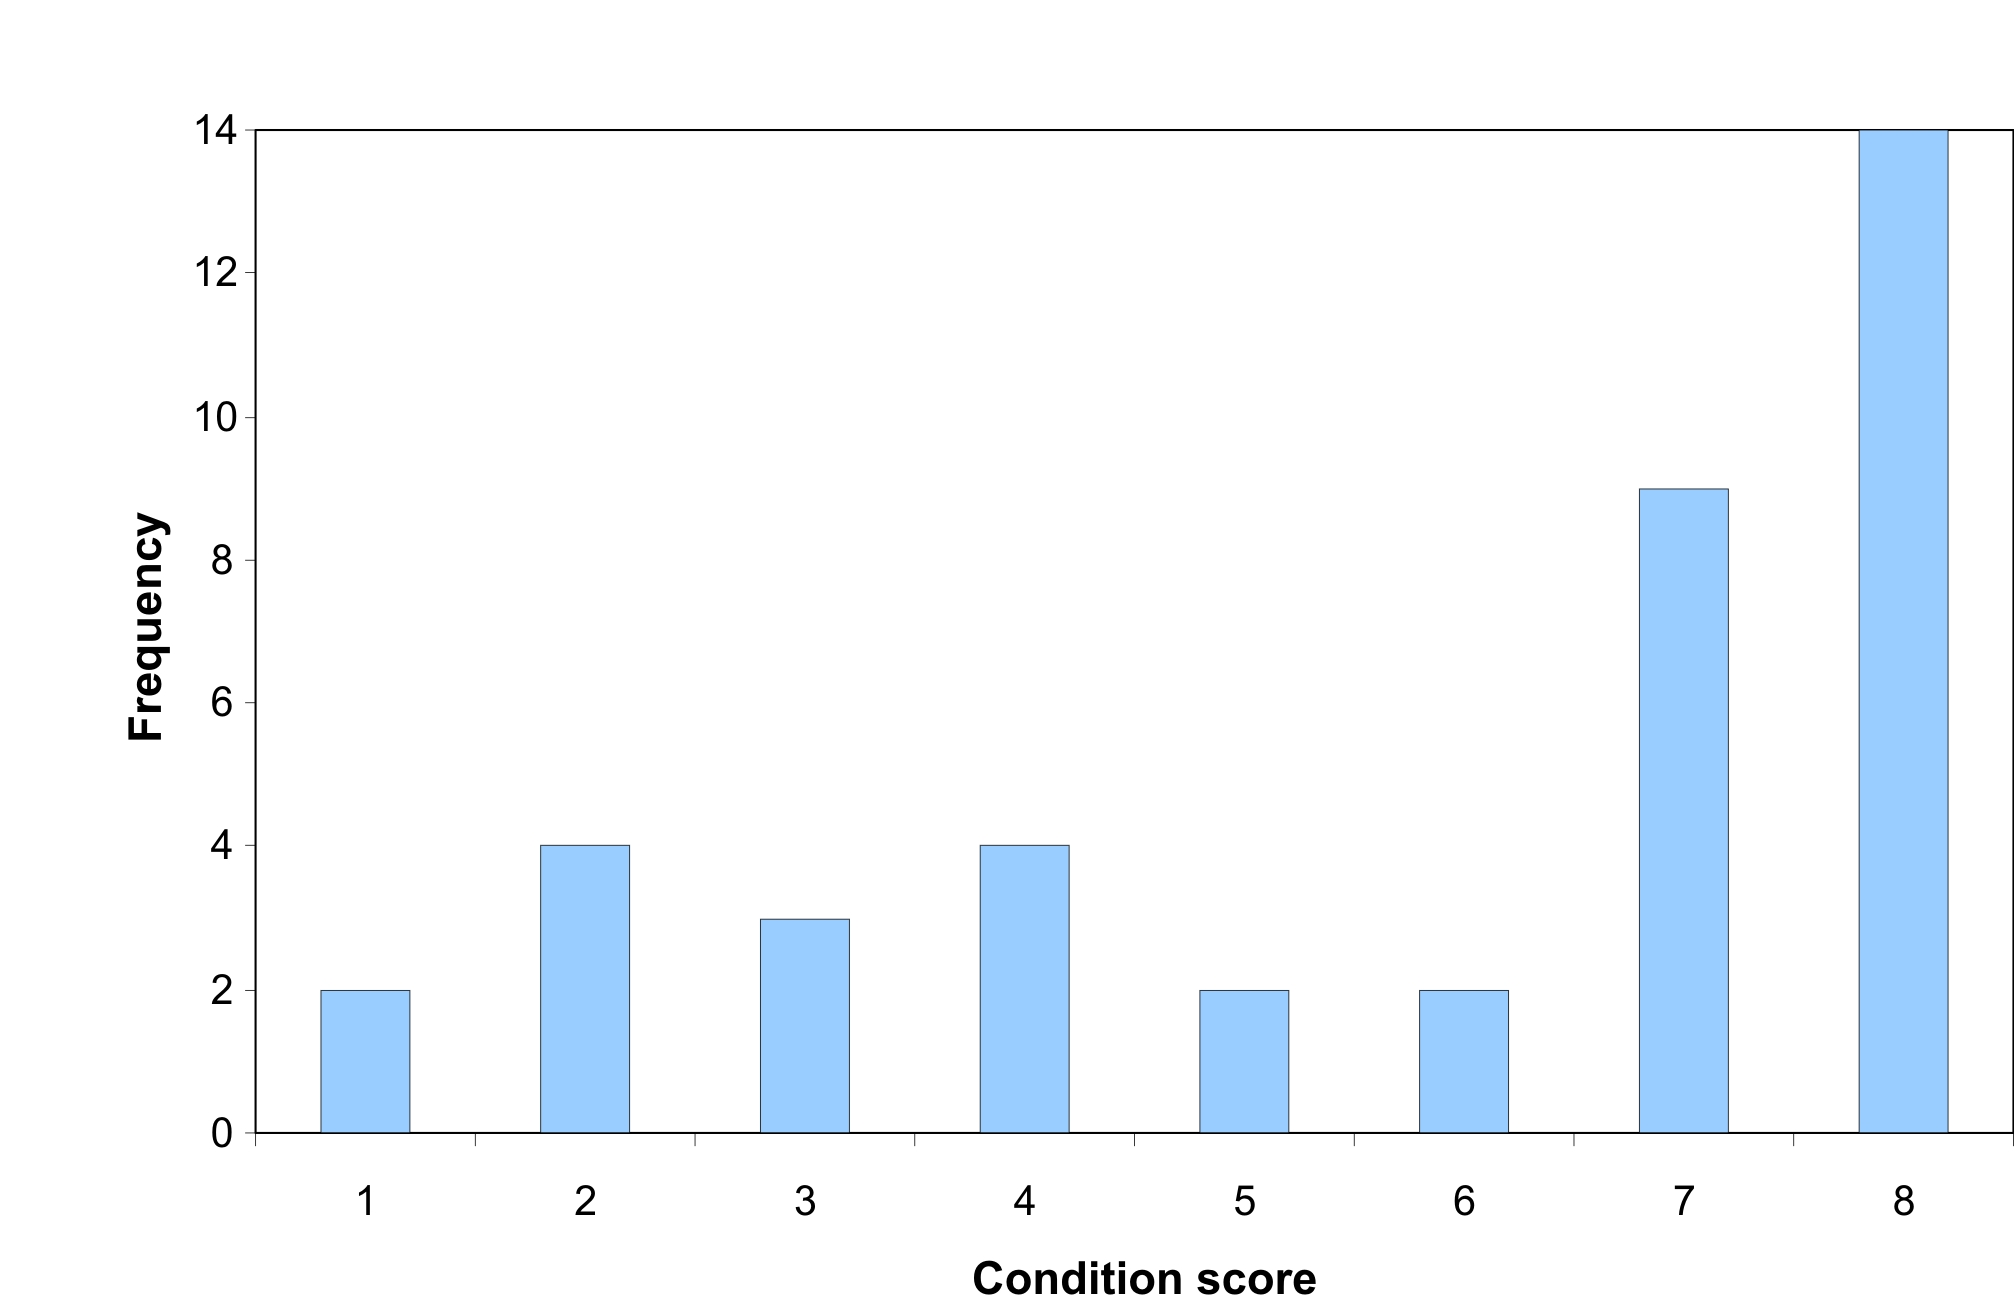
Figure d: Frequency of Loch Creran diver survey transects examined in 2017 - 2019 allocated to serpulid reef condition scores (1 = undegraded, 8 = largely unpopulated reef rubble).
The cause of habitat deterioration is uncertain; however, it is considered most likely that it is part of a long-term natural cycle of degradation without compensatory replenishment (see Moore et al. (2019) for further details).
West Highlands
In Loch Teacuis, an arm of Loch Sunart, serpulid reefs were first recorded in 2006 (Mercer, Howson & Moore, 2007), with a habitat coverage of 20 ha, within which reef coverage was around 4% (Dodd, Baxter & Hughes, 2009). By 2015 living reefs had become largely extinct, although scattered reef fragments, largely unoccupied by worms, were still present (Kamphausen, 2015). The cause of loss is unknown. The action of storms on reef structures, perhaps exacerbated by the presence of colonising kelp plants, was suggested as a possible factor (Kamphausen, 2015).
Recent SNH survey work has revealed small clusters of Serpula vermicularis of up to around 50 tubes on cobbles and boulders in Loch Ailort (Moore, 2019). No temporal data are available for this site and the extent of the feature is unknown, although it is likely to be small.
Other regions
Serpulid aggregations are unrecorded in all other regions.
Horse mussel beds
Knowledge of the spatial extent of Scottish horse mussel beds is insufficient to assess the quantitative significance of recorded habitat degradation. Many known beds are not delimited within the GeMS database. There are several recorded examples of loss of extent or condition of beds.
Argyll
In the Argyll region declines in horse mussel density were recorded on three beds in Loch Creran (with also extent reduction at one of them) between 2005 (Moore et al., 2006) and 2018 (Moore et al., 2019). The scale of bed loss is unknown, although the previous extent of the bed is likely to have been small, based on the limited sampling intensity in 2005 (Moore et al., 2006).
West Highland
There is no firm evidence that the areal extent of the habitat has declined in the West Highland region over the assessment period. There has been a steady temporal decline in density of a bed in Loch Alsh. Measurements of mean percentage cover of the seabed by live horse mussel shells have reduced from 29% in 1999 (Mair, Moore, Kingston & Harries, 2000) to 16% in 2004 (Emu Ltd., 2006), 11% in 2007 (Marine Bio-images, 2007) and 7% in 2012 (Moore et al., 2013b). In the same region, there is also an indication (though not backed by quantitative evidence) that horse mussel density has declined in Strome Narrows in Loch Carron (Moore et al., 2018). In both Loch Alsh and Loch Carron it is possible that competition with flame shells has played a role in the reduction in horse mussel density.
Moray Firth
MPA monitoring of the largest horse mussel bed in Scottish waters off Noss Head found the distribution of the bed in 2017 to be consistent with earlier mapping of the feature based on records from 2010 to 2013 (Scottish Natural Heritage, 2014; Moore, 2019).
Other regions
Horse mussel beds are also found in Forth and Tay, Orkney Islands, Shetland Isles, Outer Hebrides and Clyde. No data on temporal extent trends are available.
Blue mussel beds
Moray Firth
Both intertidal and subtidal mussel beds are present in the Dornoch Firth and have supported a fishery for hundreds of years. In 2010 scattered subtidal beds occupied an area of around 218 ha (Bromham, 2010), with mapping provided by Cook, Cordingley, Woolmer & Sanderson, 2016) (Figure d). A subsequent survey in 2015-16 (Cook et al., 2016) recorded only two relict patches occupying a total area of 1 ha (Figure e). The loss of habitat was considered to possibly involve factors such as poor recruitment success and increased levels of post settlement mortality.
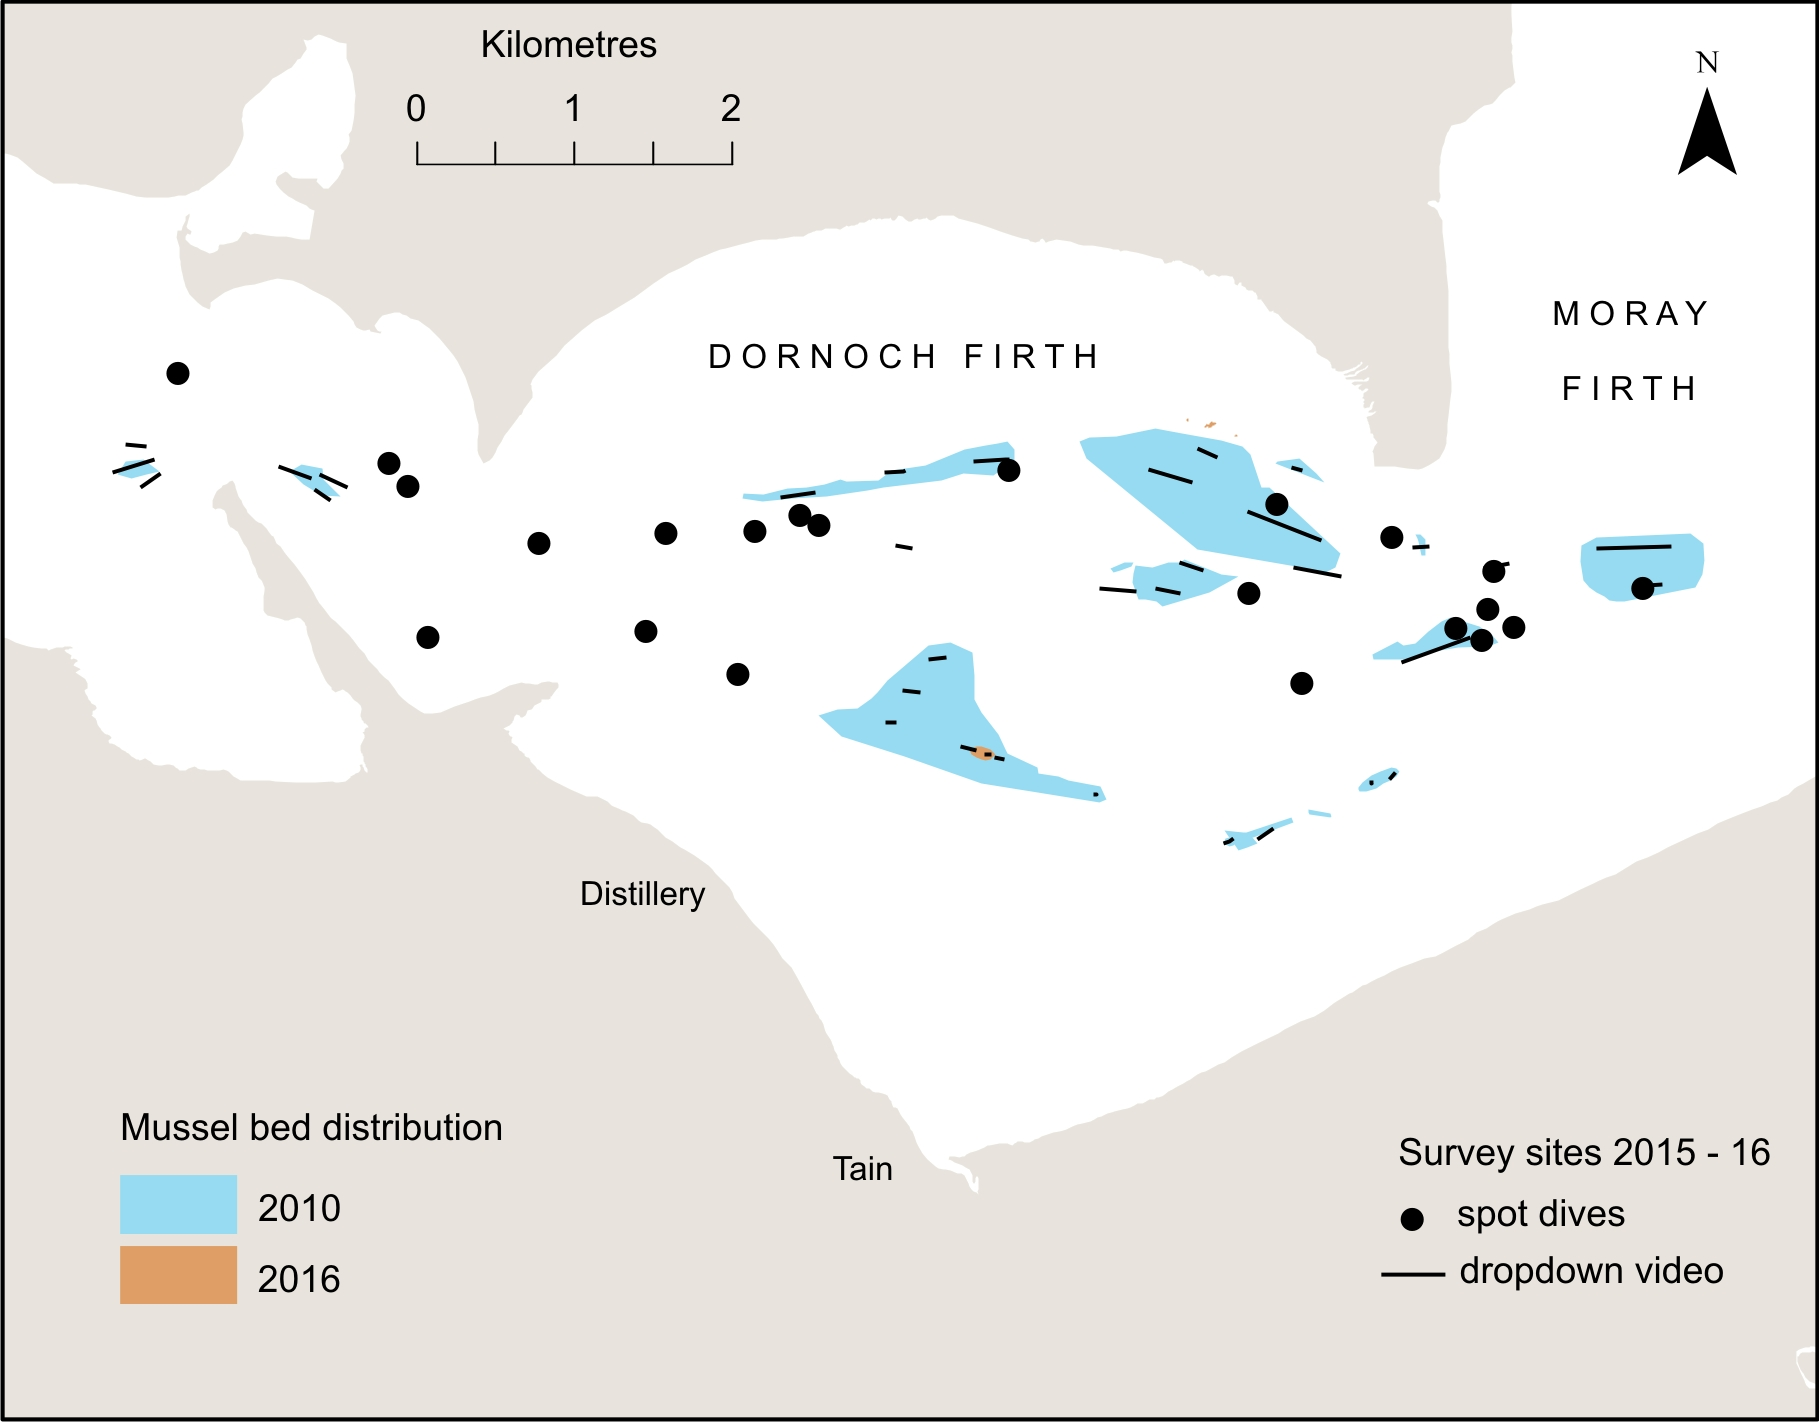
Figure e: Distribution of subtidal blue mussel beds in the Dornoch Firth in 2010 and 2016.
Other regions
Subtidal blue mussel beds are known from all other regions apart from Orkney Islands, North Coast and North East. Extent data are available for the large Tay bed (Forth and Tay Region) within the GeMS database, but no temporal trend data are available for any of the beds.
Maerl beds
Habitat loss
Due to a lack of historical and current measures of maerl bed extent it is difficult to assess the degree of habitat loss in Scottish waters. Inverse correlations between fishing intensity and maerl distribution around Arran (Clyde) (Moore, 2014a) and the Summer Isles (West Highlands) (Moore, 2014b) are indicative of habitat loss, and deterioration of the habitat is known to have taken place in Loch Ewe (West Highlands) (Moore, 2014b). Quantitative assessment of the current level of habitat degradation is generally impossible. However, in the Clyde region a 17.5 ha bed last recorded in 1999 (Hall-Spencer & Moore, 2000) was found to have disappeared by 2012 (Moore et al., 2013b), representing around 9% of the known extent of the habitat in the Clyde region. Of the three mapped beds in Argyll, temporal distributional data are only available for Taynish Rapids in Loch Sween. A bed extent of 2.7 ha was measured in 2012 (Moore et al., 2013a). Digitisation of a sketch of this bed following a 1984 survey by Lumb (1986) indicates coverage of 1.8 ha. No temporal comparisons of extent can be made for the remaining Scottish Marine Regions.
Habitat condition
Figure f shows Azti Marine Biotic Index (AMBI) scores for 29 Scottish maerl beds from six of the Scottish Marine Regions for which there are infaunal core sample data since 2011 and includes 12 sites where earlier data are also available. All sites fall within the good or high ecological status categories, indicating the presence of undisturbed or slightly disturbed communities. As there is uncertainty regarding the accuracy of the category boundaries for these maerl habitats, all sites are best regarded as simply showing little or no evidence of disturbance.
For the 12 sites where temporal trend data are available (West Highlands and Outer Hebrides), the mean AMBI is effectively static (1.47 pre-2011, 1.42 post-2011). The highest AMBI values relate to sites where anthropogenic disturbance is unexpected. One temporal trend that may be linked to human disturbance is the marked drop in AMBI (hence drop in disturbance) at site ML02 in Loch Laxford (Figure f). The bed is adjacent to a mussel farm, presumably responsible for the high density of mussel shells and dominance by the pollution-tolerant polychaete, Pseudopolydora paucibranchiata, in 2009 (Moore, Harries, Porter & Lyndon, 2010) but unrecorded in 2015 (Moore et al., 2017).
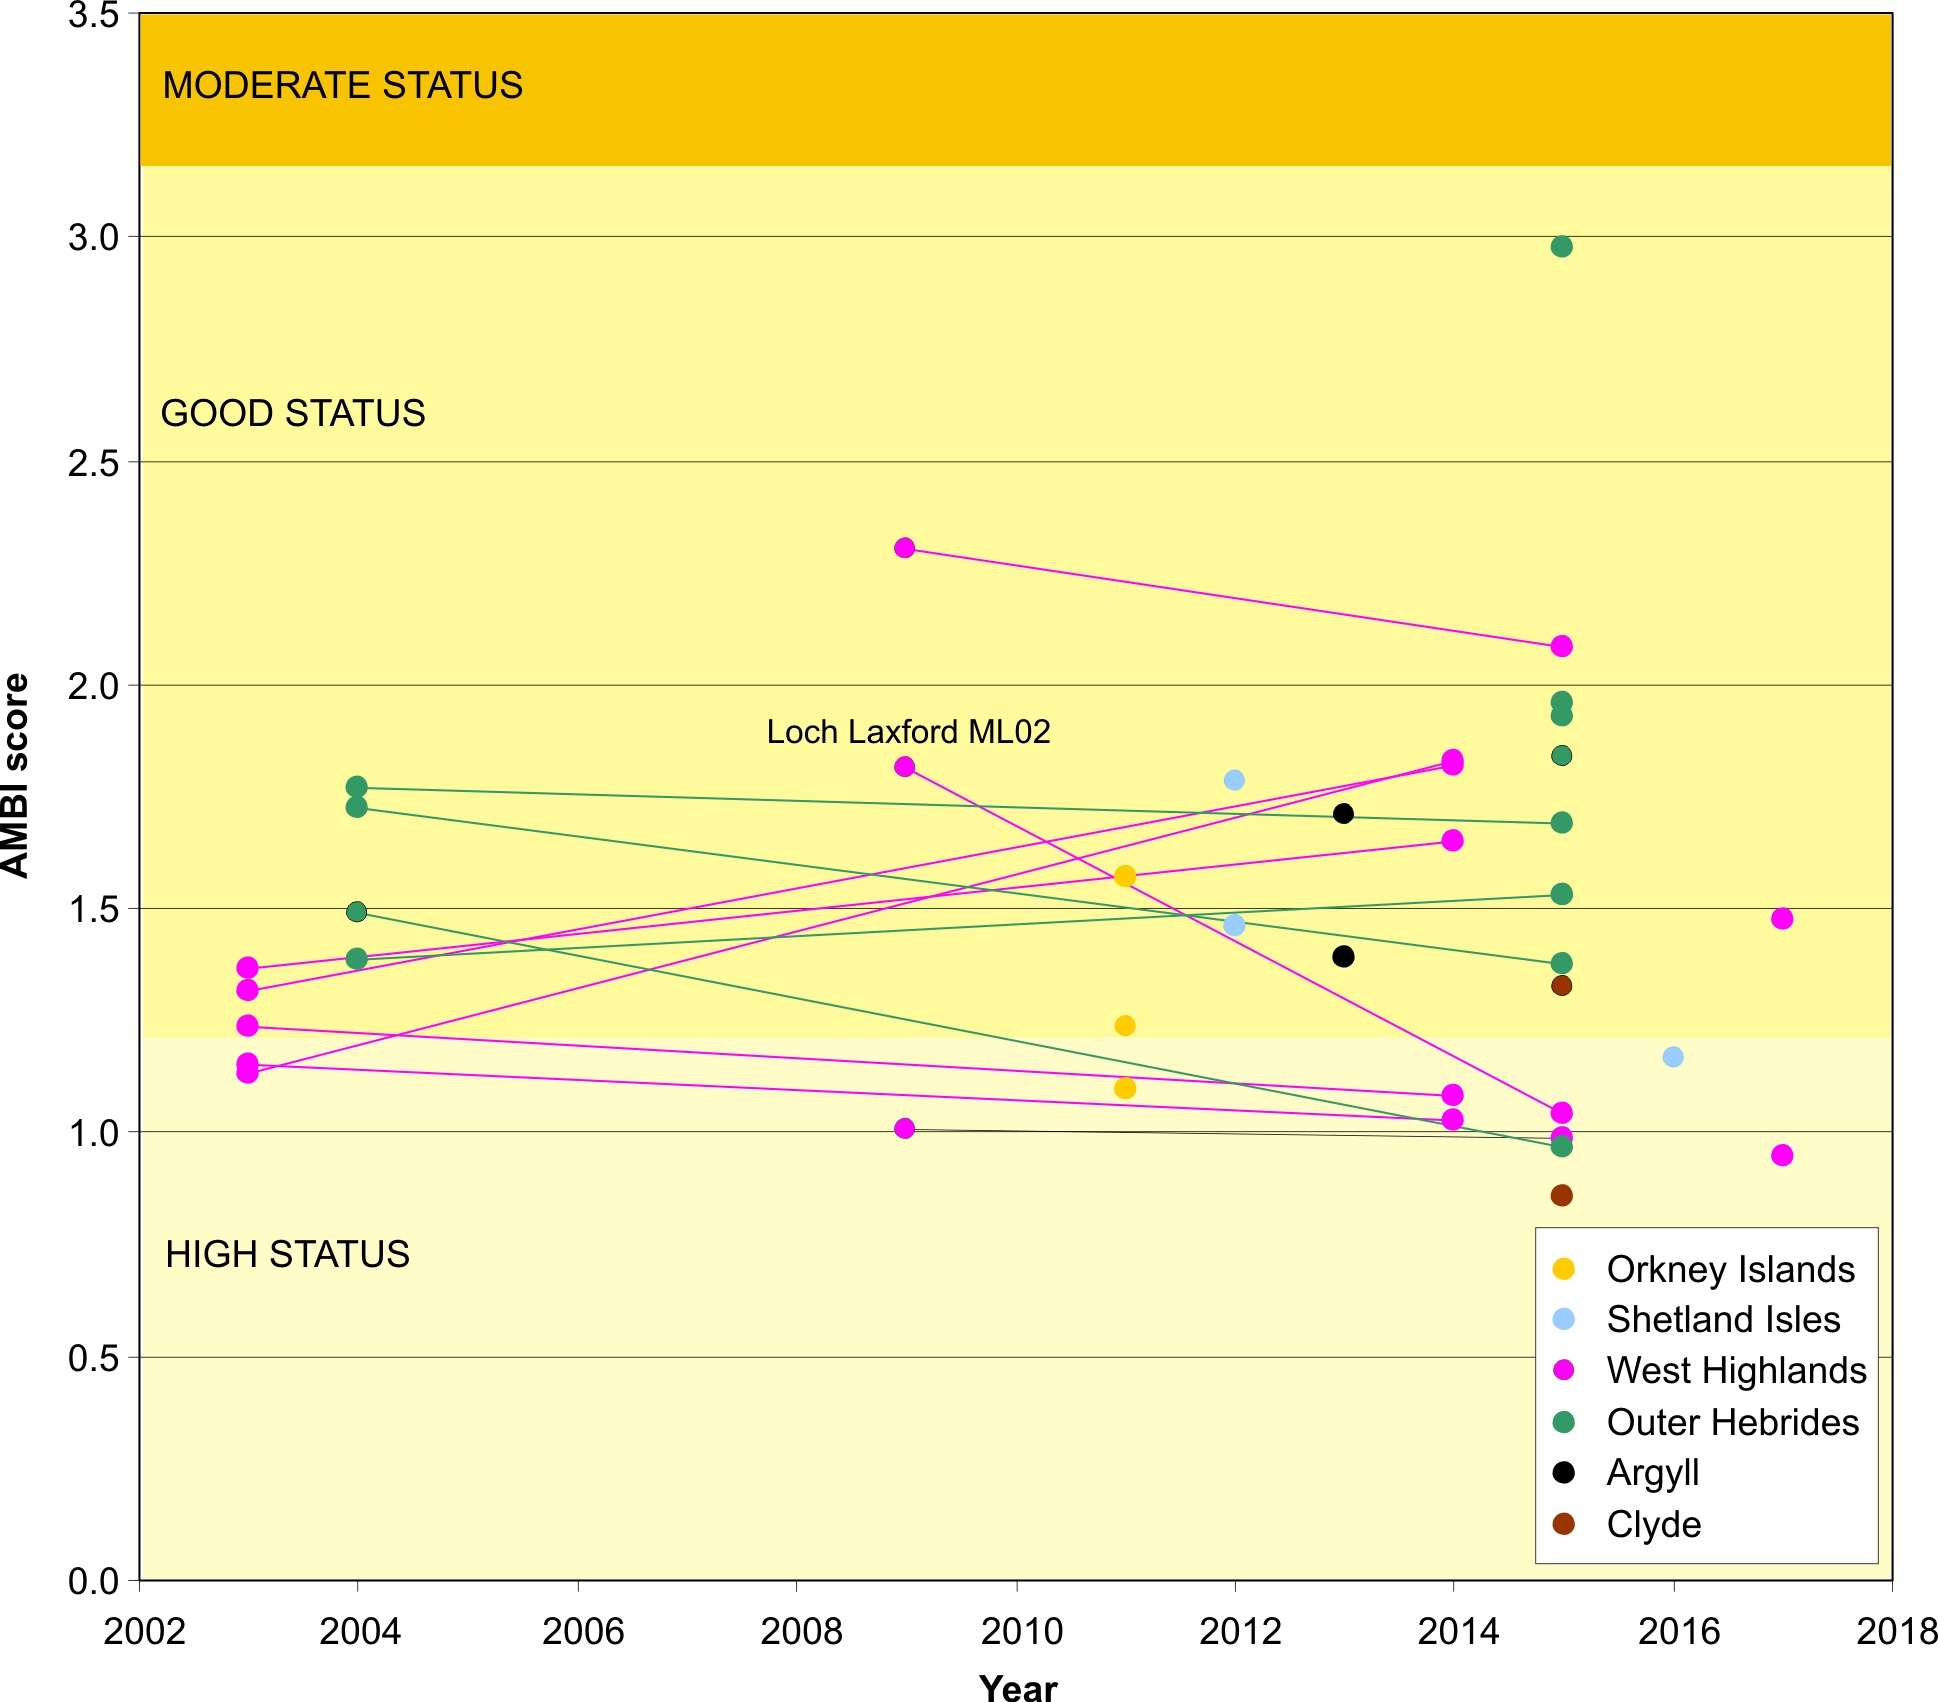
Figure f: Mean Azti Marine Biotic Index (AMBI) scores for infauna of 29 maerl beds sampled from 2011, with additional historical data for 12 of them. Ecological status categories of water bodies for the Water Framework Directive also shown (from Muxika, Borja & Bonne, 2005).
Extent assessments for all habitats
The baseline extent estimates for each habitat type are shown in Table a and losses recorded in 2011 to 2018 in Table b. The baseline estimates were derived from historical studies spanning a broad time period, but all predate the measures of extent recorded between 2011 and 2018 that have been used to assess habitat loss. The extent loss indicator was not used for the 2011 Atlas (Baxter et at., 2011) but as losses are assessed against historical baseline values, they can be considered to indicate temporal trends.
The AMBI scores have not been integrated with the habitat loss results to form a multi-metric indicator, but this would not have influenced the assessment outcomes. The scores do, however, indicate that the condition of the maerl beds examined from the six regions do not provide significant cause for concern, insofar as habitat condition is characterised by the infaunal community.
|
Scottish Marine Region
|
Habitat (ha)
|
|||||
|
Blue mussel
|
Flame shell
|
Horse mussel
|
Maerl
|
Seagrass
|
Serpulid aggs
|
|
|
Forth and Tay
|
324
|
-
|
?
|
-
|
?
|
-
|
|
North East
|
-
|
-
|
-
|
-
|
-
|
-
|
|
Moray Firth
|
(218)
|
-
|
785
|
-
|
?
|
-
|
|
Orkney Islands
|
-
|
?
|
(42)
|
538
|
-
|
-
|
|
Shetland Isles
|
?
|
-
|
22
|
13
|
?
|
-
|
|
North Coast
|
-
|
-
|
-
|
?
|
-
|
-
|
|
West Highlands
|
?
|
458
|
98
|
1230
|
24
|
17 (c.20)
|
|
Outer Hebrides
|
?
|
-
|
?
|
1326
|
285 (665)
|
-
|
|
Argyll
|
?
|
19 (75)
|
13
|
11
|
3 (?)
|
97 (108)
|
|
Clyde
|
?
|
50 (55)
|
?
|
158 (176)
|
82
|
-
|
|
Solway
|
?
|
-
|
-
|
101
|
?
|
-
|
|
Scottish Marine Region
|
Habitat loss (ha)
|
Total loss (ha)
|
|||||
|
Blue mussel
|
Flame shell
|
Horse mussel
|
Maerl
|
Seagrass
|
Serpulid aggs
|
||
|
Forth and Tay
|
?
|
-
|
?
|
-
|
?
|
-
|
?
|
|
North East
|
-
|
-
|
-
|
-
|
-
|
-
|
?
|
|
Moray Firth
|
217
|
-
|
Stable
|
-
|
?
|
-
|
217
|
|
Orkney Islands
|
-
|
?
|
?
|
?
|
?
|
-
|
?
|
|
Shetland Isles
|
?
|
-
|
?
|
?
|
?
|
-
|
?
|
|
North Coast
|
-
|
-
|
-
|
?
|
-
|
-
|
?
|
|
West Highlands
|
?
|
<1
|
?
|
?
|
?
|
20
|
20
|
|
Outer Hebrides
|
?
|
-
|
?
|
?
|
180
|
-
|
180
|
|
Argyll
|
?
|
40
|
Loss
|
?
|
Loss
|
38
|
>78
|
|
Clyde
|
?
|
5
|
?
|
18
|
?
|
-
|
23
|
|
Solway
|
?
|
-
|
-
|
?
|
?
|
-
|
?
|
Conclusion
Examples of habitat loss were recorded during the period 2011 to 2018 in five SMRs: Moray Firth, West Highlands, Outer Hebrides, Argyll and Clyde. There were insufficient data available to provide assessments for the remaining six regions or for all six biogenic habitats in any single region, with all six habitats currently only known to occur in West Highland and Argyll regions.
Recorded losses in the Clyde relate to flame shell and maerl beds at just one location (Loch Fyne). Marked losses in flame shell and serpulid aggregation habitats were principally responsible for the target not being met for Argyll, whereas seagrass and serpulid habitats were the significant contributors to loss in the Outer Hebrides and West Highlands respectively. Pronounced reduction of blue mussel beds in the Dornoch Firth were solely responsible for the recorded habitat loss in the Moray Firth.
Confidence in the assessment is low as a result of the small proportion of biogenic habitat for which records exist and the uncertainty regarding the extent to which habitat loss reflects anthropogenic drivers. The losses reported may be caused by a range of pressures including those associated with human activities or natural drivers of change including storm action and fluctuations in recruitment of the habitat-forming species.
The assessment is based on data from seabed surveys carried out mainly in Marine Protected Areas. In 2016, fisheries management measures were put in place to protect the most sensitive seabed habitats within most of these MPAs. It will take time for the benefits of these measures to be seen and for this to be reflected in the results of MPA monitoring work. Further work is underway to safeguard these habitats outside the MPA network.
The indicator (biogenic habitat extent loss) reveals reductions in extent of specific components of the biogenic habitats in five of the Scottish Marine Regions and hence failure to meet the UK target (UK Marine Strategy Part 1). The degree to which recorded habitat losses reflect the environmental quality of subtidal sediments (the assessment 2020 reporting category to which the biogenic habitats belong) is unknown, as the cause of loss is for the most part not understood.
The role of anthropogenic versus natural factors in contributing to habitat loss is also unclear, except for one case of dredge damage to a flame shell bed. For most of the habitats considered the evidence for habitat loss is derived from only a subset of the known and unknown occurrences of the habitat within a region. As such there is low confidence in conclusions drawn from extrapolation of the assessment to the whole region except in the case of serpulid aggregations and to a lesser extent flame shell beds.
Knowledge gaps
Whilst our knowledge-base has improved considerably over the last 10 years, a more detailed understanding of the distribution and extent of biogenic habitats within each of the Scottish Marine Regions is still required. Such data are needed to underpin any future application of a biogenic habitat extent indicator in Scottish waters (whether in the current combined format or perhaps a modified approach using habitat-specific assessments) and the continued use of the stringent UK ‘no loss’ target. Studies are also needed to determine the scale; nature and cause of natural temporal fluctuations in habitat extent and condition (compared with anthropogenic factors).
In identifying knowledge gaps, it is considered that this should relate to the broader issue of future assessment of the status of biogenic habitats rather than the narrow approach that has been adopted in the current assessment which deals specifically with habitat extent. Ideally, condition measures should also contribute to future quality assessments.
It is currently impossible to produce estimates of habitat loss for regions with a high degree of confidence because of the paucity of information on the distribution and extent of most of the biogenic habitats, particularly maerl, seagrass, blue mussel and horse mussel beds. An understanding of the scale and processes governing natural temporal fluctuations in extent and condition measures would help place recorded changes into context. Better correlation between observed changes and anthropogenic drivers are also required and this could be aided by inclusion of monitoring sites at clear risk of anthropogenic influence or where such pressures could be quantified (e.g. sites in the vicinity of fish farms or with fishing pressure data - for both mobile and static gear).
Status and trend assessment
|
Region assessed
|
Status with confidence
|
Trend with confidence
|
|---|---|---|
|
Argyll
|
 |
|
|
Clyde
|
|
|
|
Moray Firth
|
|
|
|
Outer Hebrides
|
|
|
|
West Highlands
|
|
|
This Legend block contains the key for the status and trend assessment, the confidence assessment and the assessment regions (SMRs and OMRs or other regions used). More information on the various regions used in SMA2020 is available on the Assessment processes and methods page.
Status and trend assessment
|
Status assessment
(for Clean and safe, Healthy and biologically diverse assessments)
|
Trend assessment
(for Clean and safe, Healthy and biologically diverse and Productive assessments)
|
||
|---|---|---|---|
 |
Many concerns |
No / little change |
|
| |
Some concerns |
Increasing |
|
 |
Few or no concerns |
Decreasing |
|
 |
Few or no concerns, but some local concerns |
No trend discernible |
|
 |
Few or no concerns, but many local concerns |
All trends | |
 |
Some concerns, but many local concerns |
||
 |
Lack of evidence / robust assessment criteria |
||
| Lack of regional evidence / robust assessment criteria, but no or few concerns for some local areas | |||
 |
Lack of regional evidence / robust assessment criteria, but some concerns for some local areas | ||
| Lack of regional evidence / robust assessment criteria, but many concerns for some local areas | |||
Confidence assessment
|
Symbol |
Confidence rating |
|---|---|
|
Low |
|
|
Medium |
|
|
High |

Assessment regions
 and the Scottish Offshore Marine Regions (OMRs, O1 – O10)")
Key: S1, Forth and Tay; S2, North East; S3, Moray Firth; S4 Orkney Islands, S5, Shetland Isles; S6, North Coast; S7, West Highlands; S8, Outer Hebrides; S9, Argyll; S10, Clyde; S11, Solway; O1, Long Forties, O2, Fladen and Moray Firth Offshore; O3, East Shetland Shelf; O4, North and West Shetland Shelf; O5, Faroe-Shetland Channel; O6, North Scotland Shelf; O7, Hebrides Shelf; O8, Bailey; O9, Rockall; O10, Hatton.
 Regions. These have been used as the assessment areas for hazardous substances.")
, Regions.")