
Background
Most shellfish species are relatively sedentary and live on the sea bed. Different species have different habitat requirements and species distribution is dependent on the availability of suitable substrates. The geographical distribution of different habitats around Scotland is highly complex, especially on the west coast, and as a consequence shellfish species populations are distributed patchily but in discrete aggregations. For many species numerous populations can be identified and where possible these are assessed separately.
Shellfish fisheries are of key economic importance in Scottish waters and fishing is likely to be the main pressure on the populations of these species. However, given their sedentary nature, other activities (such as pollution, gravel extraction, pipelines and wind farm development) which disturb the sea bed or have detrimental consequences for larval ecology and settlement could affect populations.
Shellfish stock assessments are carried out in order to inform sustainable fisheries management. Assessments of the state of the stock typically consist of estimating fishing pressure and stock size, and judging whether the fishery is sustainable and the stock healthy by comparing these measures to pre-defined reference points. Assessments are carried out for the main shellfish species: Nephrops norvegicus (often referred to as Nephrops, Norway lobster, langoustine, scampi or prawns), king scallops, brown and velvet crabs and lobsters. In general, the International Council for the Exploration of the Seas (ICES) and Marine Scotland shellfish stock assessment areas do not correspond to the Scottish Marine Regions.
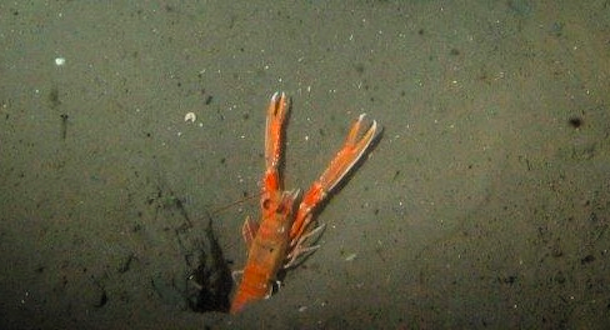
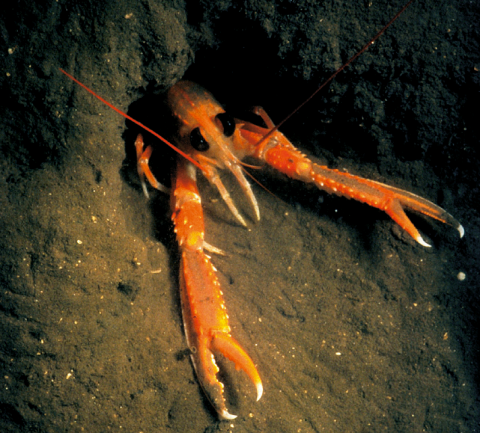
Figure 1: Nephrops in burrow. © Marine Scotland.
Shellfish fisheries are of key economic importance in Scottish waters, and landings of shellfish (both crustaceans and molluscs) represented almost one third of the value of all landings by Scottish vessels in 2018.
The most valuable shellfish species landed by Scottish fishing vessels is Nephrops norvegicus (Scottish landings worth £69 million at first sale in 2017). Nephrops inhabit muddy substrates (Figure 1) in the North Sea and to the west of Scotland, in open waters and sea lochs at depths ranging from a few metres down to over 500 m on the continental shelf edge, west of the Hebrides. Most Nephrops are caught by trawlers, but creel fisheries are also important, particularly in the inshore waters to the west of Scotland.
King scallops (Pecten maximus) are the second most valuable shellfish species (Scottish landings worth approximately £22 million at first sale in 2018) and the majority of the landings are taken by vessels towing dredges (Figure a). The fishing fleet comprises small vessels that tend to work locally in inshore waters and some larger vessels which are capable of moving between different fishing grounds around Scotland. In addition, there is a commercial dive fishery which is particularly important in Orkney and the inshore waters to the west of Scotland.

Brown crabs (Cancer pagurus) (Figure b) (also known as edible crabs), velvet swimming crabs (Necora puber) and lobsters (Homarus gammarus) are fished using baited creels. In addition to traditional inshore fisheries for these species, there are fisheries for brown crab in offshore waters to the north and west of Scotland which are prosecuted by large vessels with the capacity to store live animals.

These five shellfish species typically account for around 90% of the total value of Scottish shellfish landings. Fisheries for queen scallops (Aequipecten opercularis), razor fish (Ensis spp.), squid (Loligo forbesii) and whelks (Buccinidae spp.) make up most of the remainder.
Most shellfish species are relatively sedentary and live on the sea bed. Different species have different habitat requirements and species distribution is dependent on the availability of suitable substrates. The geographical distribution of different habitats is highly complex, especially on the west coast, and as a consequence shellfish species populations are distributed patchily but in discrete aggregations. For many species, numerous stocks can be identified and where possible these are assessed separately.
Shellfish stock assessments are carried out to support sustainable fisheries management. Assessments of the state of the stock typically consist of estimating fishing pressure and stock size, and judging whether the fishery is sustainable and the stock healthy by comparing these metrics to pre-defined reference points. The results can then be used by fishery managers to make decisions on sustainable exploitation rates and the management actions necessary to achieve them. Marine Scotland Science (MSS) conducts the assessments of crab, lobster and scallop stocks around Scotland while Nephrops assessments are carried out by ICES. No assessments are routinely carried out for other shellfish species.
For the main Nephrops and scallop stocks, data on stock size used in the assessments are collected on board research vessel surveys. MSS conducts annual underwater camera surveys for Nephrops (funded under the EU Data Collection Framework, DCF) (Figure c) and annual dredge surveys for scallops (MSS funded).
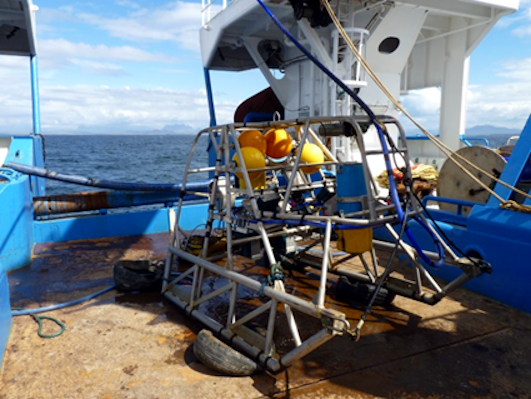
Figure c: Underwater camera sledge during Nephrops survey on MRV Scotia © Adrian Weetman, Marine Scotland Science.
The shellfish stock assessments all make use of data on the length (or age) composition of catches, which are obtained through regular sampling of commercial landings at ports, processors and harbours, conducted by MSS and funded by the EU DCF. Samples from the Shetland area are collected and provided by staff from North Atlantic Fisheries College (NAFC) Marine Centre under a Memorandum of Understanding between NAFC Marine Centre and MSS. Regular Nephrops catch sampling by observers on board commercial fishing boats to obtain length composition data for the discarded and landed components of the catch also occurs. The observers are employed by MSS and the Scottish Fishermen’s Federation and sampling is funded under the EU DCF.
The Scottish Inshore Fisheries Integrated Data System (SIFIDS) project, funded under the European Maritime and Fisheries Fund (EMFF), has piloted a number of additional data collection systems and schemes including: automated data collection in creel vessels (both fishing activity and catch sampling) and remote sensing methods for scallops surveys. In future such approaches may contribute additional data to the stock assessment process.
Nephrops
Nephrops stock assessments make use of size composition data from catches, combined with information on stock abundance obtained from underwater camera surveys. Underwater cameras are used on research vessel surveys to estimate Nephrops burrow density on the sea bed which is used to derive an estimate of stock abundance.
Fishing pressure is expressed as a harvest rate which is defined as the ratio of total catch to absolute abundance. The harvest rate and abundance are compared to pre-defined stock specific reference points (calculated from a time series of catch size composition and survey data) to determine whether they are being fished at a level consistent with FMSY (the fishing mortality expected to generate maximum sustainable yield) and whether the stock size is healthy (abundance reference point denoted by MSY Btrigger).
Assessments of the main Nephrops stocks are conducted annually by ICES and are fully documented in the relevant ICES assessment working group reports (ICES, 2018a; ICES, 2018b). Summaries of the assessments and resulting fisheries management advice can also be found on the ICES website.
ICES stock assessment methods undergo periodic external peer review while annual assessment results go through a thorough internal review process prior to publication (Introduction to ICES Advice for further details). Nephrops survey data collection follows protocols agreed by the ICES Working Group on Nephrops Surveys (ICES, 2018c) while details of the general approach to the Nephrops stock assessment process and provision of advice is documented in Leocádio et al., 2018.
Nephrops distribution is limited by the extent of suitable muddy sediment in which animals construct burrows. The patchy distribution gives rise to a number of separate stocks or functional units (FUs) which are assessed separately. There are three FUs to the west of Scotland (North Minch, South Minch and Clyde) and five, of relevance to Scotland, in the North Sea (Devil’s Hole, Firth of Forth, Fladen, Moray Firth, Noup) (Figure d).
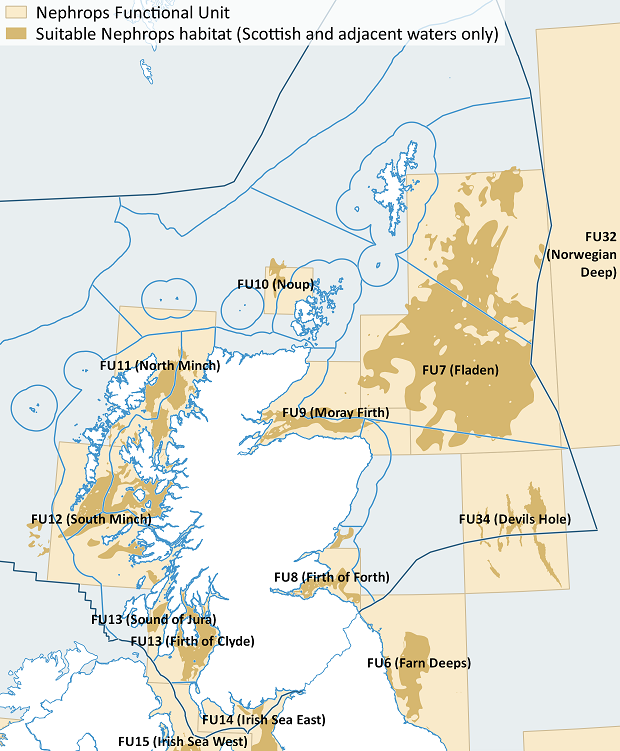
Figure d: Nephrops functional units and suitable habitats in Scottish waters.
In general, the spatial distribution of Nephrops stocks do not align with Scottish Marine Region (SMR) boundaries. Full quantitative assessments are conducted on an annual basis for each FU, with the exception of Noup and Devil’s Hole. There is insufficient data for these two FUs to provide annual assessments or calculate reference points and therefore ICES provides qualitative assessments of stock status on a biennial basis. Note that the Clyde FU consists of two sub-areas, but due to the practice of recording landings at the ICES statistical rectangle level, estimates of harvest rate cannot be derived for the two sub-areas separately.
Scallops
For scallops, an age-structured stock assessment model called TSA (Time Series Analysis) is used to provide a time series of annual estimates (with confidence intervals) of fishing mortality, spawning stock biomass (biomass of mature individuals in the stock) and recruitment (number of young fish entering the stock). TSA is a state space model with the state of the stock in a particular year described by a vector of stock numbers at age and fishing mortality numbers at age (the ‘state vector’). The method was first proposed by Gudmundsson (1994) and further developed by Fryer (2002), initially for use in the assessment of North Sea and West of Scotland demersal fish stocks.
The assessment model makes use of official landings data, age and length frequency data collected as part of the MSS market sampling programme and catch at age data from the annual MSS scallop dredge surveys which are conducted around the coast of mainland Scotland and Shetland. Data collection follows established MSS protocols.
There are currently no agreed biomass or fishing mortality reference points for scallop stocks. Assessments of stock status and management considerations are therefore provided on the basis of a comparison of estimates of current fishing mortality, recruitment and biomass in relation to historical values and perceptions of how the stock might develop. The assessments are conducted regularly by MSS and undergo an internal review process before being published online. The latest assessments were conducted in 2016, using landings data up to and including 2015 and survey data to 2016. (Dobby et al., 2017).
Scallops are distributed widely over sandy and gravely substrates. Stock assessments are carried out for areas (Figure e) which have been defined on the basis of the distribution of fisheries in the past (as a proxy for stock distribution) rather than on the basis of evidence of discrete populations. Currently there are insufficient data to conduct assessments for Orkney, Clyde or the Irish Sea (although note that an assessment of the Irish Sea, limited to Manx waters, is conducted by the University of Bangor). In general, the scallop assessment areas do not match the SMRs or the Offshore Marine Regions (OMRs) and results should not be extrapolated to areas without an assessment.

Further information can be found in the latest scallop stock assessment report (Scottish Government, 2017a).
Crabs and lobster
Crab and lobster assessments are conducted using length cohort analysis (LCA) which is a method that can be applied to data-limited stocks (Jones, 1984). The method uses the commercial catch size composition data (length frequency data) and estimates of growth parameters and natural mortality to estimate fishing mortality at length. Due to differences in these biological parameters, stock assessments are conducted separately for male and female crabs and lobsters.
The assessments provide an indication of whether or not increased yields could be expected by fishing at a reduced rate and leaving the animals in the sea for longer to allow them to grow more before capture. For data-limited stocks, such as crabs and lobsters, it is not possible to directly estimate the maximum sustainable yield (MSY) and so the fishing mortality which maximises the yield-per-recruit (FMAX) is used as a proxy for FMSY. Stocks fished above the FMSY proxy are considered to be overexploited. The changes that the LCA predicts are long term (equilibrium). The method does not provide any indication of short-term stock dynamics or recruitment over-fishing.
The population structure of crab and lobster stocks around Scotland, and the rest of the UK, is not well understood. The current assessment areas are based largely on past fishing patterns. For each species, there are a number of areas for which data are too limited to conduct a stock assessment. In general, the assessment areas (Figures q, r and s) do not match the SMRs or the OMRs and results should not be extrapolated to areas without an assessment.
MSS conducts and publishes assessments on a triennial basis with the latest assessments making use of landings length composition data from 2013 to 2015. The data are quality checked and aggregated according to internal MSS guidelines and the assessment undergoes an internal review process.
Further information can be found in the latest crab and lobster stock assessment report (Scottish Government, 2017b).
Results
Nephrops results are based on stock assessments conducted by ICES which are published annually. The latest (2019 published) presenting fishing mortality to 2018 and stock size to 2019. Results for crab, lobster and scallops are based on Marine Scotland triennial assessments, the latest available being up to 2015.
Nephrops
In the North Sea, the fishing mortality in the Moray Firth and Firth of Forth has declined since the 2011 Marine Atlas (Baxter et al., 2011), and all Nephrops stocks are fished below FMSY (the fishing mortality that results in the largest yield that can be taken from a stock in the long term) (Table 1). To the west of Scotland, fishing mortality has also declined, and stocks in this area are also fished below FMSY (Table 2). In all areas, the level of stock abundance is considered healthy.
Table 1: Nephrops stocks in the North Sea. Summary of the stocks relative to MSY reference points.
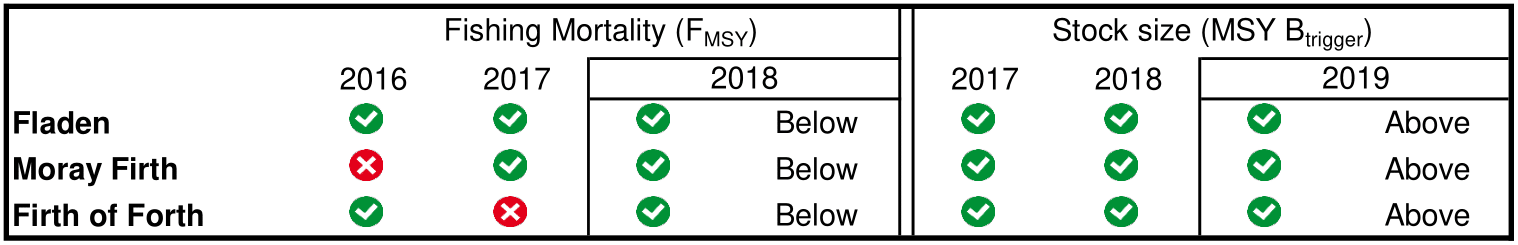
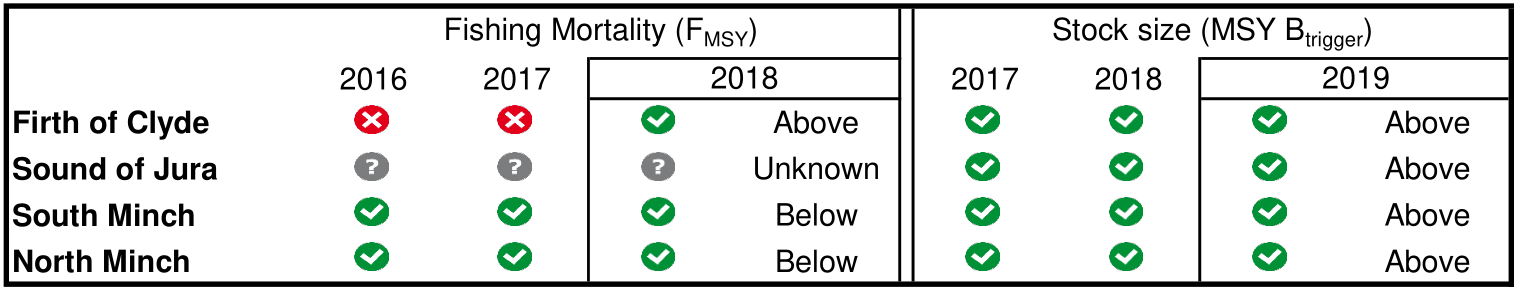
Table 2: Nephrops stocks to the West of Scotland. Summary of the stocks relative to MSY reference points.
Scallops
To the east of Scotland stocks are declining from a high level and exploitation has increased. To the west, stocks are stable or increasing and fishing mortality is relatively low.
Brown crab
In the most recent assessments, nine of the ten assessed areas were fished above FMSY for either males, females or both. Papa was the only assessment area for which recent fishing mortality was estimated at around FMSY or lower for both male and female brown crab.
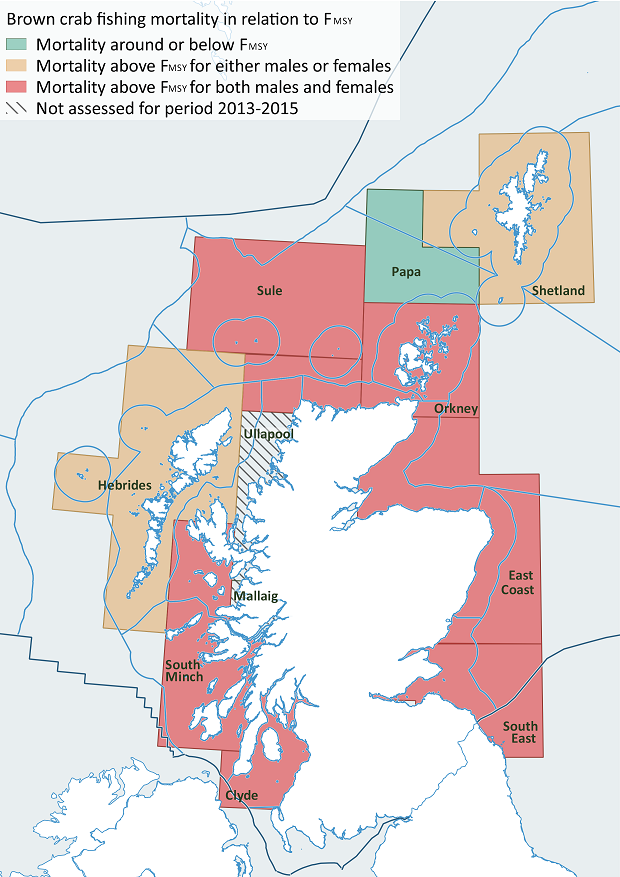
Figure 2: Brown crab stock assessment units and estimated fishing mortality in relation to FMSY, 2013-15.
Green – fishing mortality around or below FMSY, orange – fishing mortality above FMSY for either males or females, red – fishing mortality above FMSY for both males and females, grey hatch – not assessed for the period 2013-2015.
Velvet crab
In the Clyde, East Coast, Orkney and South Minch both males and females were fished at levels above FMSY. There were no assessment areas in which both males and females were estimated to be fished at around or below FMSY. In most areas there are no changes in stock status since the previously published assessments.
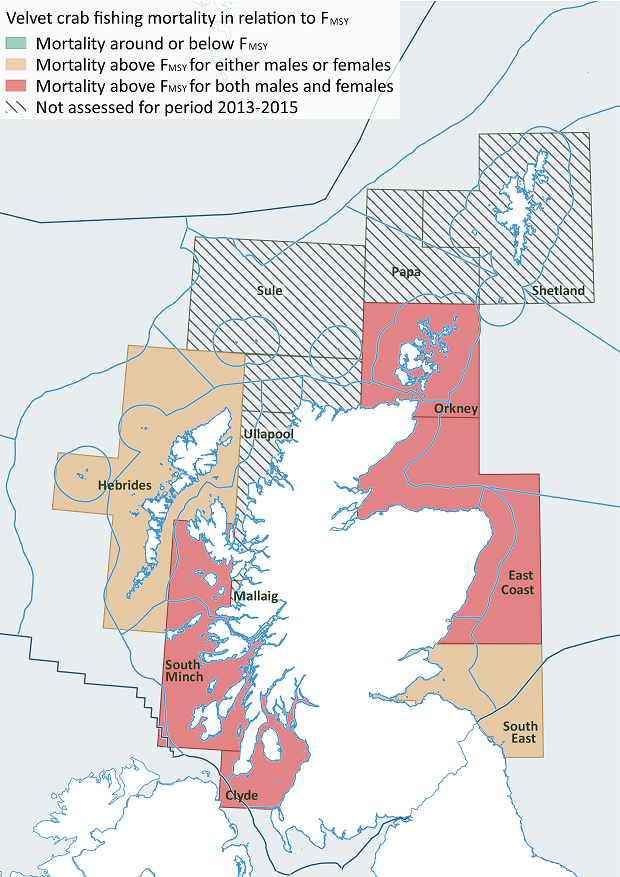
Figure 3: Velvet crab stock assessment units and estimated fishing mortality in relation to FMSY, 2013-15.
Green – fishing mortality around or below FMSY, orange – fishing mortality above FMSY for either males or females, red – fishing mortality above FMSY for both males and females, grey hatch – not assessed for the period 2013-2015.
Lobster
In all the assessed areas, fished mortality was estimated to be above FMSY for either males or females or both. In most areas there are no changes in stock status since the previously published assessments.
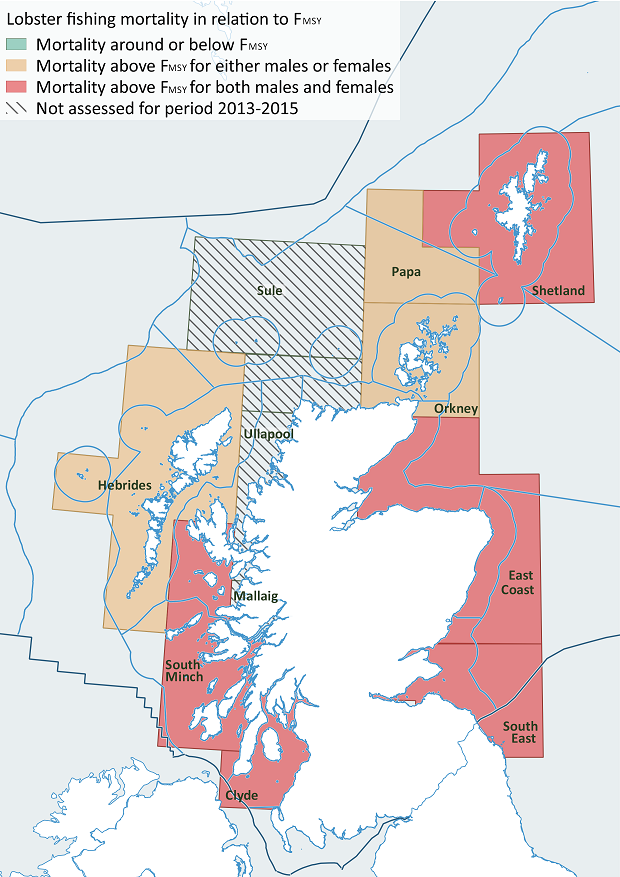
Figure 4: Lobster stock assessment units and estimated fishing mortality in relation to FMSY, 2013-15.
Green – fishing mortality around or below FMSY, orange – fishing mortality above FMSY for either males or females, red – fishing mortality above FMSY for both males and females, grey hatch – not assessed for the period 2013-2015.
More details about all the assessments are included in the extended section.
Nephrops
Fladen: The stock size has been above MSY Btrigger for most of the time-series. The harvest rate has declined since 2010 and remains well below FMSY.
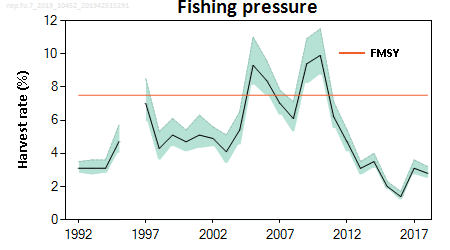
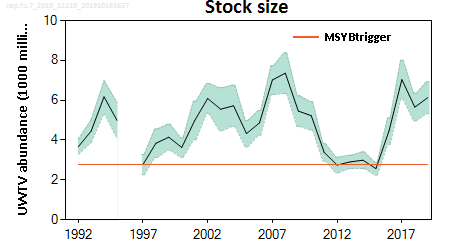
Figure f: Fladen Nephrops. Summary of the stock assessment. Harvest rate and survey abundance. Orange lines show proxies for FMSY and MSY Btrigger. Shaded areas are 95% confidence intervals. Harvest rates before 2006 may be unreliable due to underreporting of landings.
Firth of Forth: The stock size has been above MSY Btrigger for most of the time-series. The harvest rate is varying and is now below FMSY.

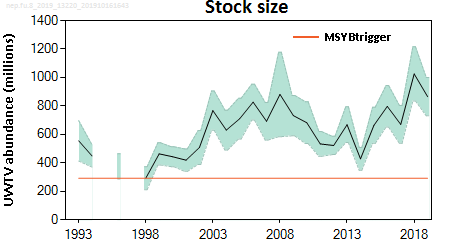
Figure g: Firth of Forth Nephrops. Summary of the stock assessment. Harvest rate and survey abundance. Orange lines show proxies for FMSY and MSY Btrigger. Shaded areas are 95% confidence intervals. Harvest rates before 2006 may be unreliable due to underreporting of landings.
Moray Firth: The stock has been above MSY Btrigger for the entire time-series. The harvest rate has fluctuated around FMSY in recent years and is now just below FMSY.
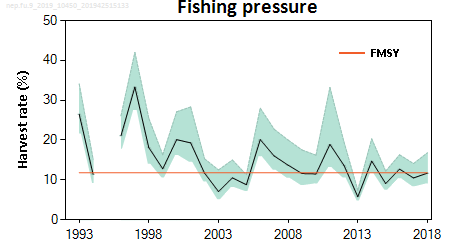
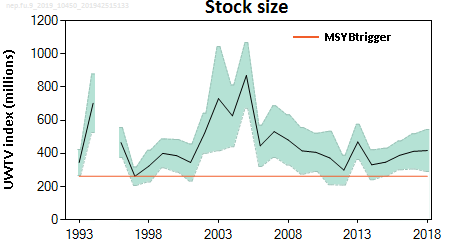
Figure h: Moray Firth Nephrops. Summary of the stock assessment. Harvest rate and survey abundance. Orange lines show proxies for FMSY and MSY Btrigger. Shaded areas are 95% confidence intervals. Harvest rates before 2006 may be unreliable due to underreporting of landings.
North Minch: The historical harvest rate has fluctuated around FMSY and has been below FMSY since 2013. The stock has been above MSY Btrigger since 1998.
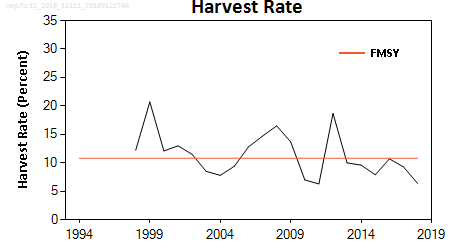
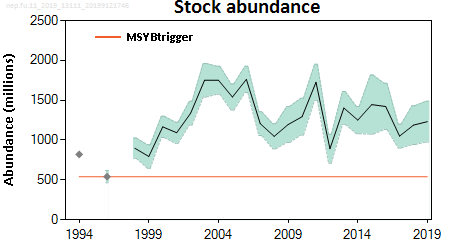
Figure i: North Minch Nephrops. Summary of the stock assessment. Harvest rate and survey abundance. Orange lines show proxies for FMSY and MSY Btrigger. Shaded areas are 95% confidence intervals. Harvest rates before 2006 may be unreliable due to underreporting of landings.
South Minch: The harvest rate has been below FMSY since 2013 and is now at its lowest value. The stock abundance has generally fluctuated above MSY Btrigger.
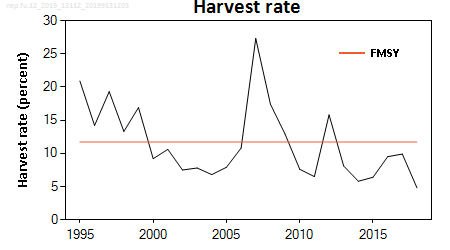
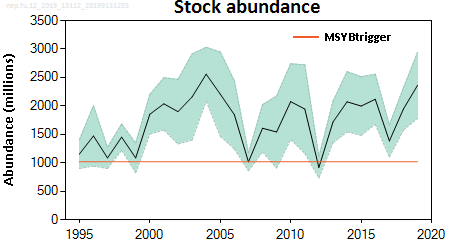
Figure j: South Minch Nephrops. Summary of the stock assessment. Harvest rate and survey abundance. Orange lines show proxies for FMSY and MSY Btrigger. Shaded areas are 95% confidence intervals. Harvest rates before 2006 may be unreliable due to underreporting of landings.
Clyde: The combined harvest rate (Firth of Clyde + Sound of Jura) is considered to be more representative for the Firth of Clyde than for the Sound of Jura; it has fluctuated around FMSY (defined for the Firth of Clyde) since 2009 and is now below FMSY. The abundance had been fluctuating above the MSY Btrigger in both the Firth of Clyde and the Sound of Jura since 1996.
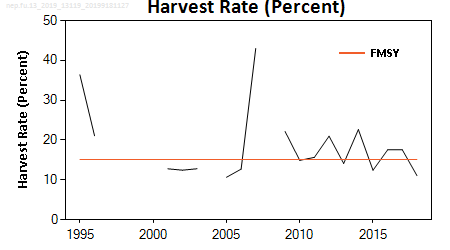
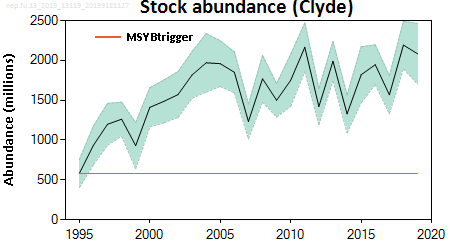
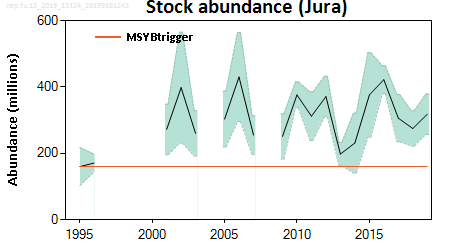
Figure k: Clyde Nephrops. Summary of the stock assessment. Harvest rate and survey abundance. Orange lines show proxies for FMSY and MSY Btrigger. Shaded areas are 95% confidence intervals. Harvest rates before 2006 may be unreliable due to underreporting of landings.
Scallops
MSS assessments indicate differences in stock dynamics in different areas. A summary for each of the assessed areas (as shown in Figure d) is given here with more detail available in Dobby et al., 2017.
East Coast: Relatively high recruitment has maintained SSB and landings above average between 2005 and 2014. Current estimates of recruitment for 2015 and 2016 are, however, particularly low and SSB has declined since 2013. The decreasing stock size coupled with the relatively high landings results in a generally increasing trend in F since 2011.
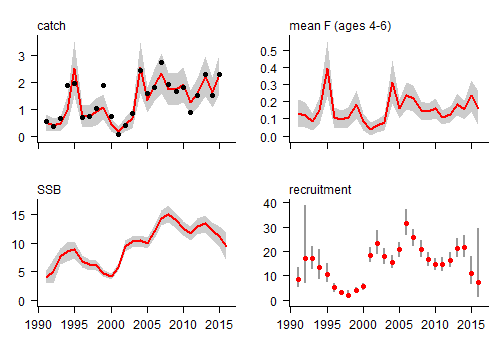
Figure l: East Coast stock summary showing observed and estimated catch (000 t), SSB (000 t), recruitment at age three (millions) and annual fishing mortality averaged over ages four to six.
North East: SSB has declined sharply in recent years after a period of relatively stable/increasing SSB. Recruitment has declined over the last five years and current estimates for 2015 and 2016 are particularly low. Fishing mortality in this area increased rapidly during the late 1980s and early 1990s. In the last ten years it has fluctuated without trend, but with significant uncertainty surrounding the estimates throughout the time period.
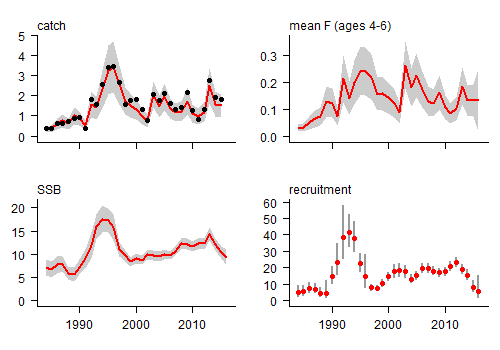
Figure m: North East stock summary showing observed and estimated catch (000 t), SSB (000 t), recruitment at age three (millions) and annual fishing mortality averaged over ages four to six.
North West: Following a period of lower recruitment in the mid-2000s, estimated recruitment has increased and has been above the long term average since 2010. As a result of this and moderate landings, estimated SSB has increased steadily over this period. The resulting estimates of recent fishing mortality are fairly stable at around the long term average.
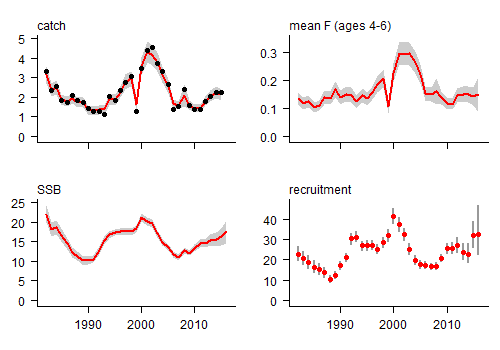
Figure n: North West stock summary showing observed and estimated catch (000 t), SSB (000 t), recruitment at age three (millions) and annual fishing mortality averaged over ages four to six.
Shetland: Following a number of very strong year classes during the mid-2000s, recruitment is estimated to be more moderate in recent years. The SSB increased during the 2000s to a maximum in 2010, but has been declining since 2012. Fishing mortality has increased since 2009, in line with the increase in landings, but is still at around the long term average.
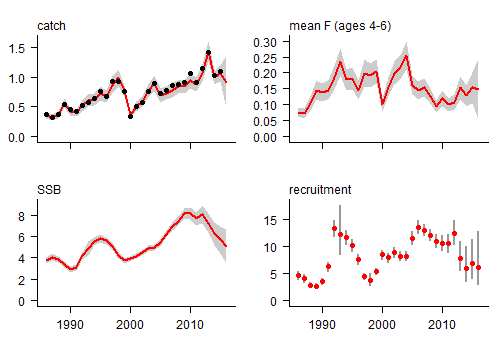
Figure o: Shetland stock summary showing observed and estimated catch (000 t), SSB (000 t), recruitment at age three (millions) and annual fishing mortality averaged over ages four to six.
West of Kintyre: Recruitment is estimated to have increased substantially since 2000 resulting in the highest estimated SSB of the time series in 2012. Since then the stock has remained relatively stable at a high level. This increase in stock size means that despite some very high landings since 2011, fishing mortality has remained relatively low.
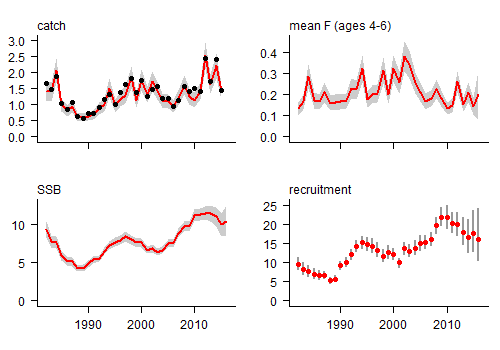
Figure p: West of Kintyre stock summary showing observed and estimated catch (000 t), SSB (000 t), recruitment at age three (millions) and annual fishing mortality averaged over ages four to six.
Crabs and lobster
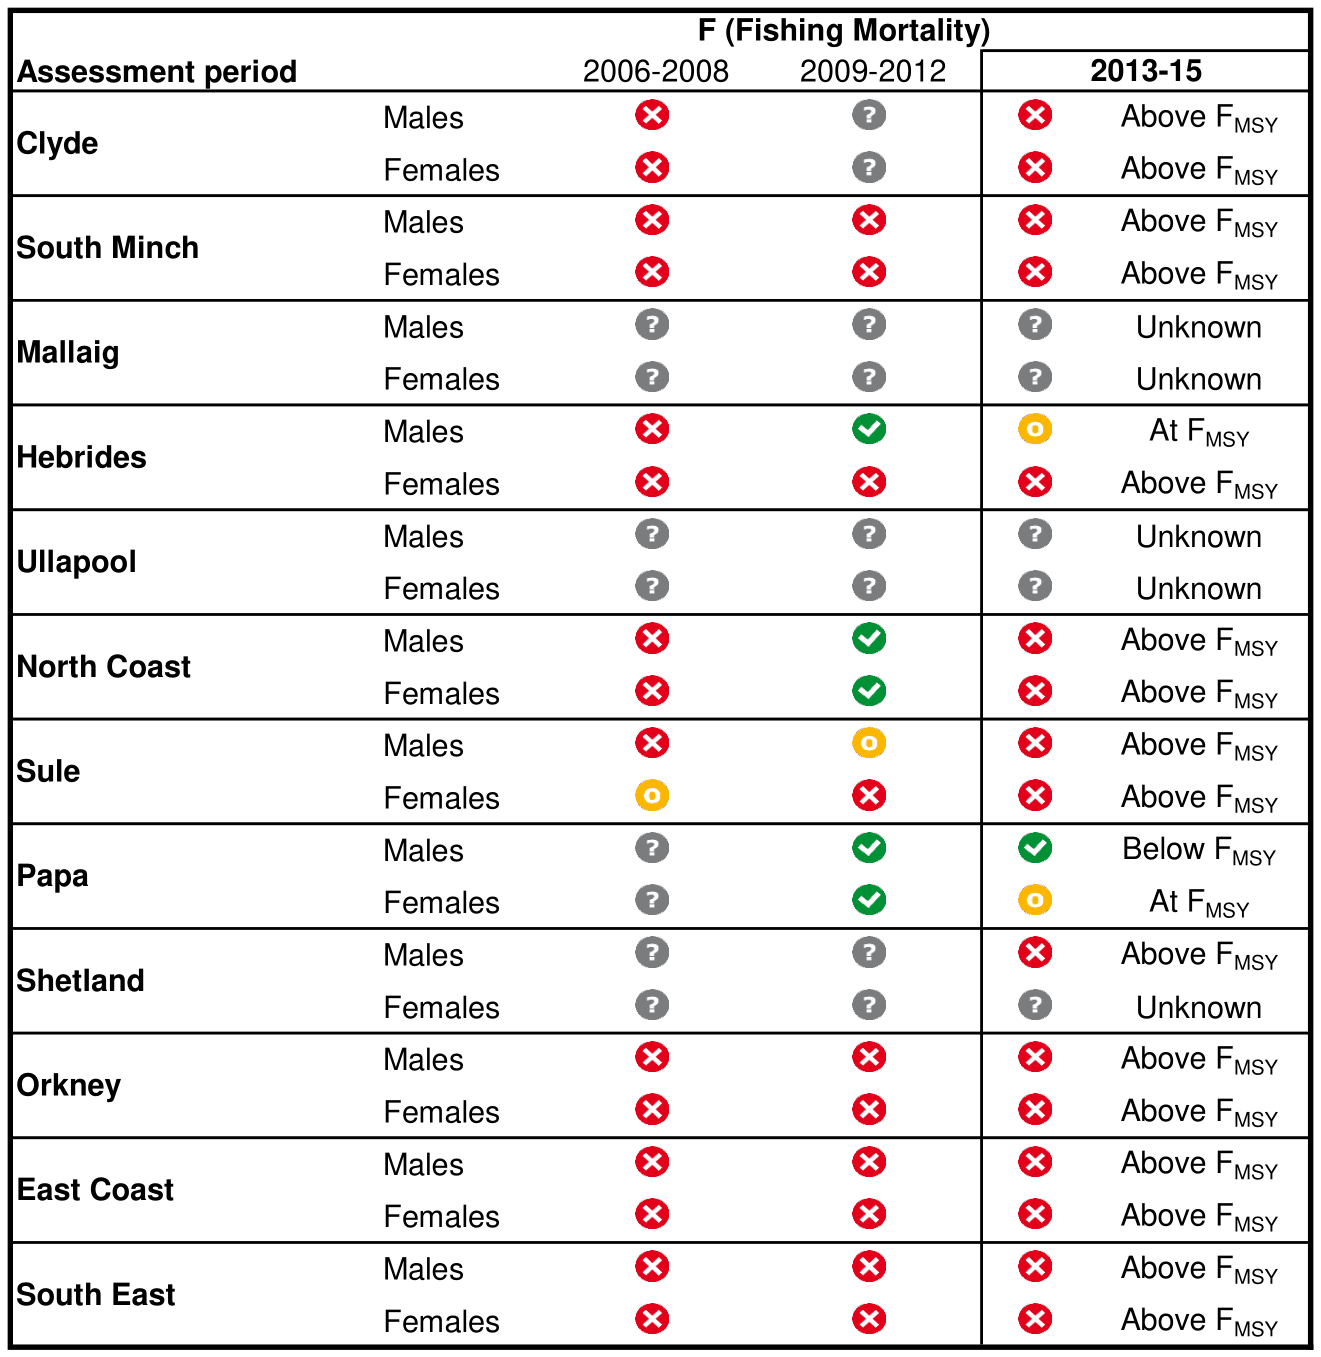
Brown crab: In the most recent assessments, nine of the ten assessed areas were fished above FMSY to some extent (Table a and Figure 2). Fishing mortality for both males and females was estimated to be above FMSY in the Clyde, East Coast, North Coast, Orkney, South East, South Minch and Sule areas. Papa was the only assessment area for which recent fishing mortality was estimated at around FMSY or lower for both males and females. In Ullapool and Mallaig there was insufficient data available to carry out an assessment.
In most areas, estimated F has increased (or is unchanged) since the last published crab and lobster assessment. The main changes in status in relation to FMSY are evident in the North Coast (both sexes) and Sule (males) which were previously at or below FMSY and are now fished above FMSY.
Table a: Brown crab stock status, relationship between F and FMSY for 2006-08, 2009-12 and 2013-15.
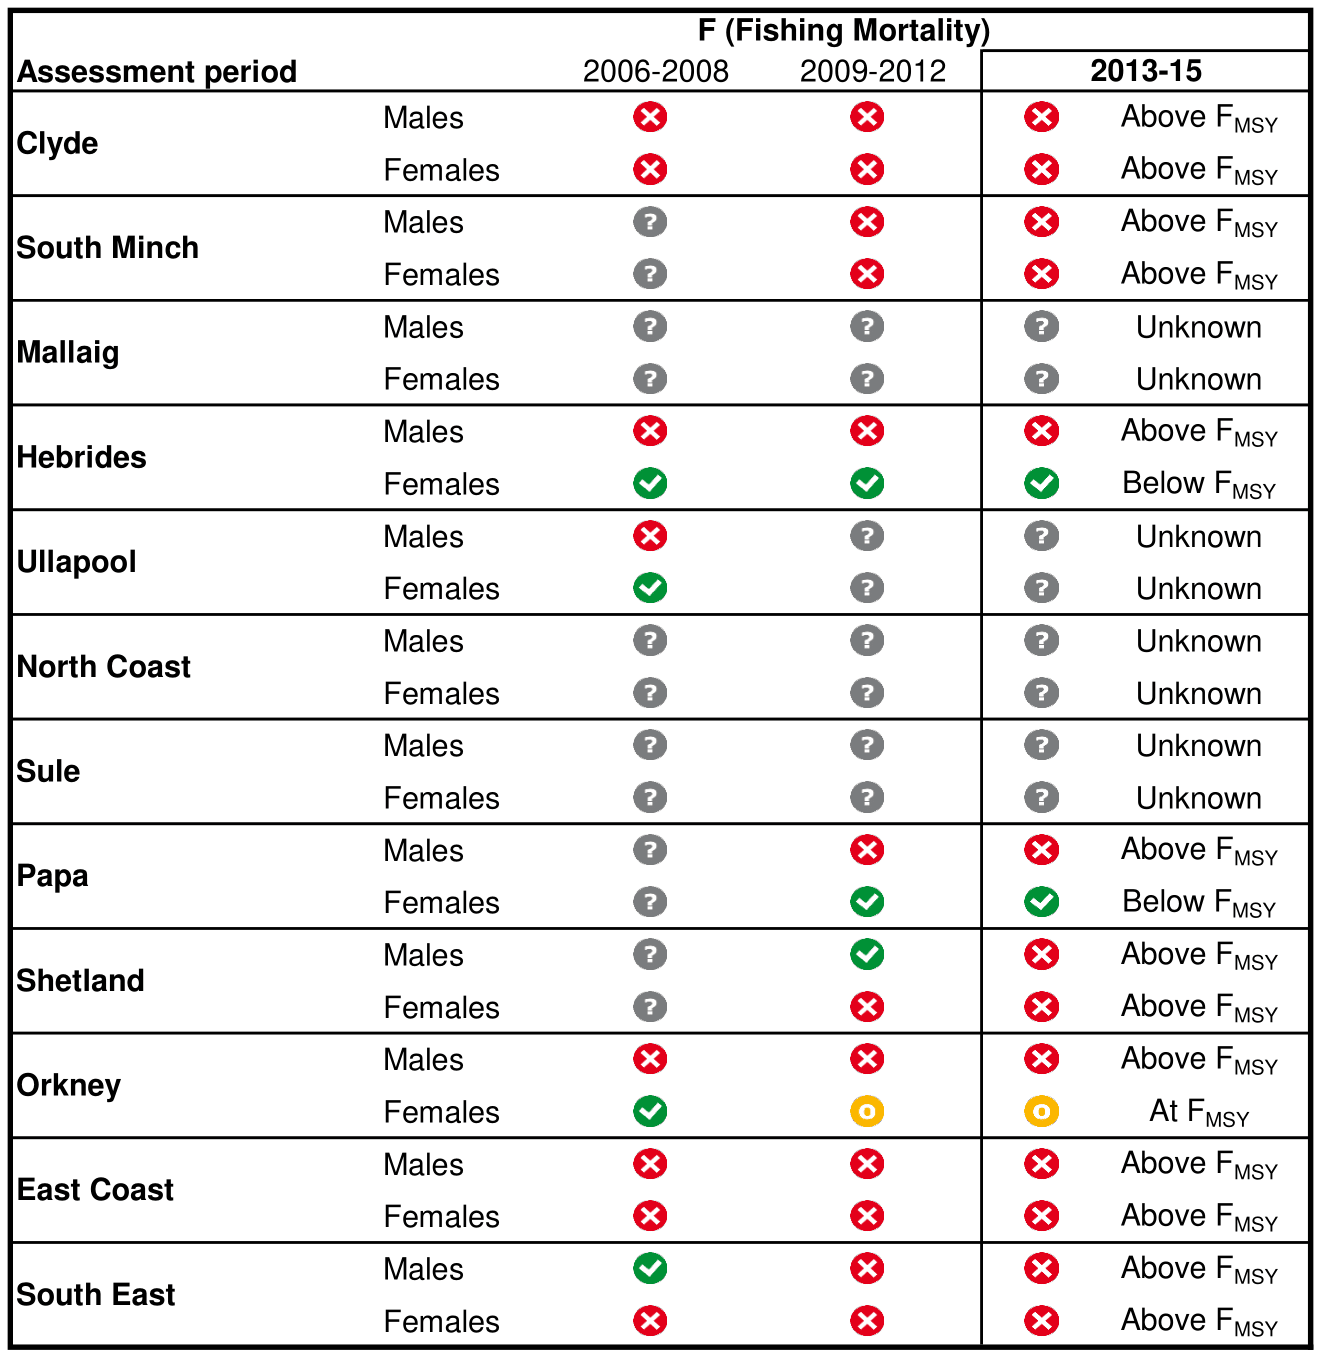
Velvet crab: In the Clyde, East Coast, Orkney and South Minch both males and females were fished at levels above FMSY. There were no assessment areas in which both males and females were estimated to be fished at around or below FMSY. In most areas there are no changes in stock status since the previously published assessments.
Table b: Velvet crab stock status, relationship between F and FMSY for 2006-08, 2009-12 and 2013-15.

Lobster: In all the assessed areas, fished mortality was estimated to be above FMSY for either males or females or both. In most areas there are no changes in stock status since the previously published assessments.
Table c: Lobster stock status, relationship between F and FMSY for 2006-08, 2009-12 and 2013-15.
Conclusion
No changes have been made to the assessment methods for any of the stocks since 2011. Current stock assessments can be compared to previously published shellfish stock assessments.
Nephrops
In the North Sea, the fishing mortality on Moray Firth and Firth of Forth has declined since the last Marine Atlas publication, and all Nephrops stocks are fished below FMSY. To the west of Scotland, fishing mortality has also declined and stocks in this area are also fished below FMSY. In all areas, the level of stock abundance is considered healthy.
Scallops
To the east of Scotland stocks are declining from a high level and exploitation has increased. To the west, stocks are stable or increasing and fishing mortality is relatively low.
Crabs and lobster
Most stocks are fully exploited or overexploited.
Knowledge gaps
For some shellfish stocks there are insufficient data (either fishery sampling and/or survey data) to conduct assessments.
The other main uncertainties are associated with limitations in biological knowledge or stock structure.
Extensive discussion of the uncertainties and knowledge gaps in these stock assessments for commercial shellfish are fully documented elsewhere in the relevant stock assessment reports and publications. Only summaries are provided here.
There are other shellfish species which are commercially exploited (queen scallops, razor fish, squid & whelks) but currently lack sufficient data and/or appropriate methods for stock assessment. Of those listed above, MSS currently has a programme of data collection for razor fish with the aim of conducting stock assessments in the future.
Nephrops
Population abundance is derived from estimates of Nephrops density from underwater camera surveys and the spatial extent of each stock. The spatial extent of the stocks are typically derived from British Geological Survey (BGS) sediment data. The areas to the West of Scotland are less well mapped by BGS resulting in greater uncertainty around the spatial extent of the stocks in this area.
There are also uncertainties associated with converting relative Nephrops burrow density estimates to absolute estimates of population density which are based on limited experimental work, simulation modelling and expert judgement (Leocádio et al., 2018).
The derivation of reference points makes use of stock specific biological parameters. Many of the currently used parameters are based on limited experimental work conducted largely on the west coast of Scotland. Analysis presented in Leocádio et al. (2018) shows reference points to be particularly sensitive to natural mortality and growth parameters. Additional work to confirm these parameters would be useful.
The calculation of reference points and the provision of advice also requires an estimate of discard survival. The survival rate of discarded Nephrops is highly variable and depends on a number of factors, including the amount of damage incurred during capture and post-capture handling, air temperature, the level of predation by seabirds, fish, and other marine predators during their return to the sea bed and the type of ground to which they are returned. Based on studies conducted on the west coast of Scotland (Wileman et al., 1999), a value of 25% is used by ICES.
Since the implementation of the EU landing obligation, additional experimental work has been conducted and more discard survival experiments indicate that the trawl discard survival may be greater than 50% (Fox & Albalat, 2018). However, this study has not yet been evaluated by ICES.
Scallops
In some assessment areas sampling levels of the commercial catch have fallen in recent years. Although a single year with poor sampling is unlikely to significantly affect the conclusions of the assessment, continued poor sampling levels are likely to result in less precise and potentially biased results. In other areas (Clyde, Orkney and Irish Sea) there are insufficient data to conduct stock assessments.
MSS dredge surveys are an essential component of the assessment in that they provide fishery independent indices of abundance. They provide reasonably good coverage of the fished areas as indicated by scallop dredge VMS data (over the period for which these data are available) except in the West of Kintyre assessment area. This could potentially result in biased abundance indices. Additional (or a redistribution of) survey stations in this area may provide a more representative index.
The population structure of Scottish scallop stocks is not well understood. The assessment areas were defined in relation to the characteristics of the fisheries in the past and may not take account of any connectivity between scallop populations or be the most appropriate management units given modern day fishing patterns. Research which combines hydrodynamic and population modelling could provide insights into the nature and extent of connectivity between scallop populations around Scotland and represents a significant area of further work.
There are no agreed biomass or fishing mortality reference points for Scottish scallop stocks. MSS’ advice for assessed stocks is provided on the basis of estimates of recent fishing mortality, recruitment and biomass in relation to historical values. Options for the development of MSY reference points or MSY proxies are discussed in Dobby et al. (2017) and it is hoped to investigate these ahead of the next assessment scheduled for 2019/2020.
For further discussion of assessment uncertainties and limitations, see Dobby et al. (2017), published on the MS website.
Crabs and lobster
The population structure and some aspects of the biology of crab and lobster are not well understood and some of the assessment areas as currently defined may be inappropriate. Brown crab tagging studies are currently underway in Orkney and these may provide further evidence regarding the structure of brown crab stocks to the north of Scotland. Ideally, such studies should be followed up by population genetics /morphology studies and consideration of larval dispersal.
The currently used growth parameter estimates for crustaceans in Scotland were derived from tagging studies which took place in the 1970s in a few selected areas. More recent studies were carried out in Shetland and these show some relevant differences to those values previously estimated. Given the sensitivity of the assessment results to the input growth parameters, further work in this area is required. Field studies based on tagging methods (using tags retained on moult) and subsequent evaluation of parameters would be desirable.
The assessments provide an indication of whether or not increased yields could be expected by fishing at a reduced rate and leaving the animals in the sea for longer in order for allow them to grow more before capture. For data limited stocks such as crabs and lobsters it is not possible to directly estimate the maximum sustainable yield (MSY) and hence, the fishing mortality which maximises the yield-per-recruit (FMAX) is used as a proxy for FMSY. Stocks fished above the FMSY proxy are considered to be overexploited. The changes that the LCA predicts are long term (equilibrium). The method does not provide any indication of short-term stock dynamics or recruitment over-fishing.
LCA provides long term equilibrium predictions and assumes constant recruitment and exploitation rates. It is therefore advisable to complement the outputs with additional data which can provide information on trends in abundance, typically catch per unit effort data. Currently such data series are not available in Scotland (with the exception of Shetland). Recent changes to reporting on the FISH1 form include the introduction of a mandatory field for the number of creels hauled. This should provide new effort data for vessels under 10 m fishing and should allow for calculation of LPUE indices in the future.
For further discussion of assessment uncertainties and limitations, see Mesquita et al. (2017), published on the MS website.
Status and trend assessment
Overall assessment
|
|
Overall status with confidence
|
Overall trend with confidence
|
|
All commercial shellfish
|
 |
|
|
Nephrops
|
 |
|
|
Scallops
|
|
|
|
Crabs and lobster
|
 |
|
|
Others
|
 |
In general the shellfish stock assessment areas do not correspond to the Scottish Marine Regions. In order to provide assessments at the SMR/OMR level, an approximate matching of SMR/OMR to shellfish assessment areas was done (possible for some, but not all SMR/OMRs).
Nephrops
|
SMR assessed
|
Status with confidence
|
Trend with confidence -
fishing mortality (2014 onwards)
|
Trend with confidence -
stock size (2014 onwards)
|
Comment
|
|
Clyde
|
|
|
|
Based on the assessment for Firth of Clyde
|
|
Argyll
|
|
|
|
Based on the assessments of North Minch and South Minch Nephrops – 2 stocks
|
|
Outer Hebrides
|
||||
|
West Highlands
|
||||
|
Moray Firth
|
|
|
|
Based on the assessment for Moray Firth
|
|
Forth and Tay
|
|
|
|
Based on the assessment for Firth of Forth
|
|
Fladen and Moray Firth Offshore (OMR)
|
|
|
|
Based on the assessment for Fladen
|
Scallops
|
SMR assessed
|
Status with confidence
|
Trend with confidence -
fishing mortality (2014 onwards)
|
Trend with confidence
- stock size (2014 onwards)
|
Comment
|
|
Forth and Tay, East Coast
|
|
|
|
Based on the assessment for East Coast
|
|
Moray Firth, Fladen and Moray Firth Offshore
|
|
|
|
Based on the assessment for North East
|
|
West Highland, Outer Hebrides
|
|
|
|
Based on the assessment for North West
|
|
Shetland
|
|
|
|
Based on the assessment for Shetland
|
|
Argyll
|
|
|
|
Based on the assessment for West of Kintyre
|
All other SMRs have unknown status.
Brown crab
|
SMR assessed
|
Status with confidence
|
Trend with confidence
- fishing mortality, assessments conducted on 2013-15 data compared with previous assessments of 2009-2012 data
|
Comment (there are no estimates of stock size)
|
|
Clyde
|
|
NA
|
Based on the assessment for Clyde
|
|
Argyll
|
|
|
Based on the assessments for South Minch
|
|
Outer Hebrides
|
|
|
Based on assessment for Hebrides |
|
West Highlands
|
|
Multiple stock assessment areas with differing status | |
|
North Coast, North and West Shetland Shelf (OMR)
|
|
|
Based on assessment for North Coast and Sule |
|
Shetland Isles
|
|
Based on assessment for Shetland
|
|
|
Orkney Islands
|
|
|
Based on assessment for Orkney
|
|
Moray Firth
|
|
|
Based on assessment of South East and East Coast stocks
|
|
North East
|
|||
|
Forth and Tay
|
|||
|
Fladen and Moray Firth Offshore (OMR)
|
|||
| Long Forties (OMR) |
Velvet crab
|
SMR assessed
|
Status with confidence
|
Trend with confidence
- fishing mortality, assessments conducted on 2013-15 data compared with previous assessments of 2009-2012 data
|
Comment (there are no estimates of stock size)
|
|
Clyde
|
|
|
|
|
Argyll
|
|
|
Based on assessment for South Minch |
|
Outer Hebrides
|
|
|
Based on assessment for Hebrides |
|
West Highlands
|
|
||
|
North Coast, North and West Shetland Shelf (OMR)
|
|
||
|
Shetland Isles
|
|
|
|
|
Orkney Islands
|
|
|
Based on assessment for Orkney
|
|
Moray Firth
|
|
|
Based on assessment for East Coast
|
|
North East
|
|||
|
Forth and Tay
|
|
NA | Based on assessment for South East |
Lobster
|
SMR assessed
|
Status with confidence
|
Trend with confidence
- fishing mortality, assessments conducted on 2013-15 data compared with previous assessments of 2009-2012 data
|
Comment (there are no estimates of stock size)
|
|
Clyde
|
|
|
|
|
Argyll
|
|
|
Based on assessment for South Minch |
|
Outer Hebrides
|
|
|
Based on assessment for Hebrides |
|
West Highlands
|
|
||
|
North Coast, North and West Shetland Shelf (OMR)
|
|
||
|
Shetland Isles
|
|
|
Based on assessment for Shetland |
|
Orkney Islands
|
|
|
Based on assessment for Orkney
|
|
Moray Firth
|
|
|
Based on assessment for East Coast
|
|
North East
|
|||
|
Forth and Tay
|
|
|
Based on assessment for South East |
This Legend block contains the key for the status and trend assessment, the confidence assessment and the assessment regions (SMRs and OMRs or other regions used). More information on the various regions used in SMA2020 is available on the Assessment processes and methods page.
Status and trend assessment
|
Status assessment
(for Clean and safe, Healthy and biologically diverse assessments)
|
Trend assessment
(for Clean and safe, Healthy and biologically diverse and Productive assessments)
|
||
|---|---|---|---|
| |
Many concerns |
No / little change |
|
| |
Some concerns |
Increasing |
|
| |
Few or no concerns |
Decreasing |
|
 |
Few or no concerns, but some local concerns |
No trend discernible |
|
 |
Few or no concerns, but many local concerns |
All trends | |
 |
Some concerns, but many local concerns |
||
| |
Lack of evidence / robust assessment criteria |
||
| Lack of regional evidence / robust assessment criteria, but no or few concerns for some local areas | |||
 |
Lack of regional evidence / robust assessment criteria, but some concerns for some local areas | ||
| Lack of regional evidence / robust assessment criteria, but many concerns for some local areas | |||
Confidence assessment
|
Symbol |
Confidence rating |
|---|---|
|
Low |
|
|
Medium |
|
|
High |

Assessment regions
 and the Scottish Offshore Marine Regions (OMRs, O1 – O10)")
Key: S1, Forth and Tay; S2, North East; S3, Moray Firth; S4 Orkney Islands, S5, Shetland Isles; S6, North Coast; S7, West Highlands; S8, Outer Hebrides; S9, Argyll; S10, Clyde; S11, Solway; O1, Long Forties, O2, Fladen and Moray Firth Offshore; O3, East Shetland Shelf; O4, North and West Shetland Shelf; O5, Faroe-Shetland Channel; O6, North Scotland Shelf; O7, Hebrides Shelf; O8, Bailey; O9, Rockall; O10, Hatton.
 Regions. These have been used as the assessment areas for hazardous substances.")
, Regions.")