
Sections
Key message

Background
Polychlorinated biphenyls (PCBs) are a group of man-made industrial chemicals which were used mainly in electrical equipment. PCBs are persistent, bioaccumulative and toxic and due to concerns about their environmental impact they were banned in many countries in the mid-1980s, with their disposal closely regulated. However, PCBs can still enter the marine environment following the destruction and disposal of industrial plants and equipment or from emissions from construction materials and old electrical equipment (for example from landfill sites).
PCBs often end up in marine sediment, where they may be trapped in lower layers unless the sediments are disturbed. PCBs can also accumulate in fish (Figure 1) and shellfish, because they are taken in either directly from the marine environment or indirectly through food consumption. Marine mammals, occupying the upper trophic levels and possessing large lipid reserves, can accumulate high concentrations of PCBs. PCBs are extremely toxic to animals and humans, causing reproductive and developmental problems, damage to the immune system, interference with hormone function, and can also cause cancer.
Analysis of PCBs in sediment and biota (fish and shellfish) is required for the OSPAR Coordinated Environmental Monitoring Programme (CEMP) and the Marine Strategy Framework Directive (MSFD). To fulfil these monitoring commitments analyses of CBs are undertaken as part of the UK Clean Seas Environment Monitoring Programme (CSEMP) for 4 biogeographic regions (Figure 2): Irish Sea (Clyde and Solway), Minches and Western Scotland, Scottish Continental Shelf and Northern North Sea. See Assessment Introduction for more about the areas used.
 – PCBs can also accumulate in fish, because they are taken in either directly from the marine environment or indirectly through food consumption")
The monitoring of contaminants and their effects is undertaken in Scottish coastal and offshore areas as part of the UK Clean Seas Environment Monitoring Programme (CSEMP). CSEMP operates a coordinated monitoring programme across the United Kingdom. CSEMP contaminant and biological effects data are submitted to the UK Marine Environment Monitoring and Assessment National database (MERMAN) and from there to the International Council for the Exploration of the Sea (ICES) Environmental database.
The main focus of the CSEMP to date has been to meet the temporal trend monitoring requirements of the OSPAR Convention and compliance with EC Directives such as Water Framework Directive and the Marine Strategy Framework Directive (MSFD) (Directive 2008/56/EC). The UK monitors substances detailed in the OSPAR Coordinated Environmental Monitoring Programme (CEMP) in sediment, fish and shellfish. The CEMP includes the monitoring of polycyclic aromatic hydrocarbons (9 parent PAHs), polychlorinated biphenyls (ICES7 PCBs), polybrominated diphenyl ethers (9 PBDE congeners) and heavy metals (Hg, Cd and Pb) in sediment and biota and tributyltin (TBT) in sediment. A range of biological effects in flatfish (mainly dab, but including flounder and plaice) are also monitored as part of CSEMP.
The OSPAR Strategy for Hazardous Substances has a strategic objective which is to ‘Move towards the cessation of discharges, emissions and losses of hazardous substances by 2020 with the ultimate aim of achieving concentrations in the marine environment of near background for naturally occurring substances and close to zero for man-made substances’. Descriptor 8 (contaminants and their effects) is one of the eleven MSFD qualitative descriptors for determining Good Environmental Status (GES). To monitor compliance with GES for Descriptor 8, common indicators for contaminants and biological effects should be measured in environmental samples and compared to assessment criteria.
Commercial formulations of polychlorinated biphenyls (PCBs), such as Aroclor mixtures, were widely used in the past in transformers, capacitors, hydraulic fluids and as plasticisers in paints, plastics and sealants. It has been estimated that across the globe 1.3 million tonnes of PCB compounds have been produced (Breivik, Sweetman, Pacyna & Jones, 2007). Historically the main sources of PCBs to the marine environment included energy production, combustion industries, production processes and waste (landfill, incineration, waste treatment and disposal). Due to concerns about the environmental impact of PCBs, production in Western Europe and North America ceased in the late 1970s and in the early 1990s in Eastern Europe and Russia. However, authorisation for use in closed systems continued until 1986 when sales of PCB formulations finally stopped in the UK.
PCBs can still enter the marine environment following the destruction and disposal of industrial plants and equipment, or from emissions from old electrical equipment (for example from landfill sites). In Scotland, the release of PCBs through various waste streams is currently regulated by the Scottish Environment Protection Agency (SEPA) under the Environmental Protection (Disposal of Polychlorinated Biphenyls and other Dangerous Substances) (Scotland) Regulations 2000. This regulation will be updated to reflect changes coming from the recast EU Persistent Organic Pollutants regulation (that relate to the deadline for decommissioning of electrical equipment and the maximum concentration and minimum volume of PCB-containing fluids to which the regulation applies).
Theoretically 209 individual PCB congeners can be produced, depending on the number and position of chlorine that is substituted onto the biphenyl moiety. Individual congeners are generally named according to the short-hand system Ballschmiter and Zell (1980) developed for PCB congeners. For this naming system a number from 1 to 209, often prefixed with “CB”, was applied to each congener after the congeners had been sorted on the basis of their structural names. This system was summarized more recently by Mills, Thal & Barney (2007). The seven ICES PCBs (CB28, 52, 101, 118, 153, 138, and 180) were recommended for monitoring by the European Union Community Bureau of Reference; these PCBs were selected as indicators due to their relatively high concentrations in technical mixtures and their wide chlorination range (3–7 chlorine atoms per molecule). The ICES7 PCBs have been part of the OSPAR CEMP since 1998.
Of the 209 PCB congeners, the most toxic are the so-called ‘dioxin-like’ PCBs (DL-PCBs). The DL-PCBs are the four non-ortho (CB77, 81, 126 and 169) and eight mono-ortho (CB105, 114, 118, 123, 156, 157, 167 and 189) PCBs that also have chlorines in both para and at least two meta positions. The non-ortho PCBs can obtain a planar configuration and the mono-ortho PCBs can obtain a near planar configuration. As a result, the twelve DL-PCBs are stereochemically similar to 2,3,7,8-tetrachlorodibenzo-p-dioxin (TCDD) and therefore have similar toxic and biological responses to those of dioxins (Safe et al., 1985; Kannan, Tanabe, Ono & Tatsukawa, 1989). However, they are normally found at much lower concentrations when compared to the ortho-PCBs. CB118 is the only DL-PCB required to be monitored as part of CSEMP.
Chronic, long-term effects of PCBs (and their metabolites) reported in laboratory animals include endocrine disruption, immunosuppression and vitamin A deficiency (Brunstrom, Hakansson & Lundberg, 1991; Clark et al., 1983; Leece, Denomme, Towner & Li, 1985; Tilson, Jacobson, & Rogan, 1990). PCBs are not easily metabolised by aquatic organisms and bioaccumulate (Echarri, Nerin, Wells, Domeno & Cacho, 1998; McKenzie, 1999). PCBs are persistent (half-life of CB126 = 2.7 years, half-life of CB169 =13 years) and have the potential for long-range atmospheric transportation and are, therefore, ubiquitous in the marine environment. PCBs can also accumulate in fish and shellfish, because they are taken in either directly from the marine environment or indirectly through food consumption.
Marine mammals, occupying the upper trophic levels and possessing large lipid reserves, can accumulate high concentrations of PCBs with concentrations often exceeding the marine mammal toxicity threshold (17 µg g-1 lipid weight for sum of PCBs). There is no evidence that concentrations in top predators have decreased in recent years, and evidence presented in peer-reviewed publications have indicated that population declines may be due to these high concentrations (Jepson et al., 2016).
PCB monitoring in sediment and shellfish is undertaken in Scottish coastal (SEPA and Marine Scotland Science (MSS)) and offshore areas (MSS) as part of the CSEMP. SEPA and MSS PCB data in sediment and shellfish are submitted to MERMAN and have been used in this assessment.
The 2019 assessment of CSEMP data (1999 – 2018) describes the trends and status of contaminant concentrations at sediment and biota monitoring stations in the four Scottish biogeographic regions that could be assessed. Assessments are made for many time series, each of a single contaminant at a single monitoring station. This section describes how the results of the individual time series are synthesised to assess status and trends at the biogeographic regional level (Table a). The ICES7 PCBs, for which assessment criteria were available, were assessed for status and trends (Table b).
Assessment scales
Status and trends assessments were conducted for the 4 Scottish biogeographic regions that could be assessed. Figure 2a and b shows all the monitoring stations where there are suitable data for shellfish, sediment and fish, with the magenta dots showing stations used for trend and status assessments and cyan dots showing stations where there is only status information. The areas delineated by the grey lines are the biogeographic regions. The number of stations in each biogeographic region is given in Table a.
|
Scottish Biogeographic Region
|
Sediment
|
Biota (shellfish and fish liver)
|
||
|
Trends
|
Status
|
Trends
|
Status
|
|
|
Irish Sea (Clyde and Solway)
|
9
|
11
|
17
|
19
|
|
Minches and Western Scotland
|
6
|
6
|
5
|
8
|
|
Scottish Continental Shelf
|
0
|
1
|
2
|
5
|
|
Northern North Sea
|
13
|
17
|
21
|
30
|
Assessment of concentrations of PCBs in sediment and biota (shellfish and fish)
PCBs are monitored in sediment, fish and shellfish as part of the CSEMP. Sampling and chemical analysis methodologies met the relevant OSPAR requirements (OSPAR, 2008). Statistical assessments of status and trends were also based on OSPAR methodologies using the assessment criteria shown in Table b (OSPAR, 2009).
|
|
Sediment
|
Shellfish
|
Fish liver
|
|||
|
BAC
(μg kg-1 dw)
|
EAC
(μg kg-1 dw)
|
BAC
(μg kg-1 dw)
|
EAC
(μg kg-1 lw)
|
BAC
(μg kg-1 ww)
|
EAC
(μg kg-1 lw)
|
|
|
CB28
|
0.22
|
1.7
|
0.75
|
67
|
0.10
|
67
|
|
CB52
|
0.12
|
2.7
|
0.75
|
108
|
0.08
|
108
|
|
CB101
|
0.14
|
3.0
|
0.70
|
121
|
0.08
|
121
|
|
CB118
|
0.17
|
0.6
|
0.60
|
25
|
0.10
|
25
|
|
CB138
|
0.15
|
7.9
|
0.60
|
317
|
0.09
|
317
|
|
CB153
|
0.19
|
40
|
0.60
|
1585
|
0.10
|
1585
|
|
CB180
|
0.10
|
12
|
0.60
|
469
|
0.11
|
469
|
-
BACs and EACs in sediment are normalised to 2.5% organic carbon.
-
BACs and EACs for biota are converted to other bases (wet, dry or lipid weight) using species-specific conversion factors.
-
the EACs are based on partitioning theory and are sometimes known as EACpassive.
-
there is at least one year with data in the period 2013 to 2018.
-
there are at least three years of data over the whole-time series.
-
a parametric model can be fitted to the data and used to estimate the mean concentration in the final monitoring year (or, occasionally, if a non-parametric test of status is applied).
-
there are at least five years of data over the whole-time series.
-
a parametric model can be fitted to the data and used to estimate the trend in mean concentrations.
Information on how the individual time series are assessed for status and trends can be found here https://www.bodc.ac.uk/projects/data_management/uk/merman/assessments_and_data_access/csemp/
For the regional assessment, the results from the individual time series are combined. Essentially, a summary measure of status or trend is obtained from each time series. These are then modelled, using a linear mixed model, to estimate the mean status, or the mean trend in each biogeographic region. Only biogeographic regions with at least three monitoring stations with good geographic spread are considered in the regional assessment.
The trend analysis is further restricted to time series from monitoring stations that are classified as ‘representative’. ‘Baseline’ stations (those with near pristine conditions or only subject to very diffuse inputs) are omitted because any trends there will likely be caused by different processes to those at representative stations. Similarly, ‘impacted’ stations (those close to a point source) are omitted because trends there will likely reflect changes due to the point source, and will be ‘unrepresentative’ at the regional level. There are no restrictions on the time series used in the status analysis based on the classification of the monitoring station; time series from baseline, representative and impacted stations are all included.
Results
PCB concentrations were measured in sediment, fish and shellfish samples, taken between 1999 and 2018 from four biogeographic regions (Figure 2), in cycles varying from annually to every six years. Only biogeographic regions with at least three stations with a reasonable geographic spread were included in the regional assessment of status and trends. Shellfish (blue mussel) were collected in coastal and estuarine areas only whilst sediment and fish were collected from coastal and more offshore areas.
PCB concentrations in sediment and biota (blue mussels and fish liver) were compared to the OSPAR Background Assessment Concentration (BAC). BACs are used to assess whether concentrations are close to zero for man-made occurring substances, such as PCBs. In addition, PCB concentrations in biota and sediment were compared to Environmental Assessment Criteria (EACs). Adverse effects on marine organisms are rarely observed when concentrations are below the EAC.
PCB concentrations in sediment and biota were lowest in the Minches and Western Scotland region and highest in the Irish Sea (Clyde and Solway), which includes the Clyde, the most industrialised and urbanised Scottish sea area. However, across all PCB compounds, the status assessment for sediment and biota was the same for all regions assessed, with mean regional concentrations being above the BAC but below the EAC (Figure 3). Therefore adverse biological effects in marine species are unlikely. However, a number of sites (sediment and biota) in all assessed regions gave unacceptable concentrations (> EAC) for at least one PCB, so there may be some localised impacts. Furthermore, the most toxic (dioxin-like) PCB compound (CB118) gave a regional mean concentration above the EAC for sediment and biota in the Irish Sea (Clyde and Solway).
Trends in PCB concentrations were assessed in biogeographic regions where there were at least five years of data (Figure 4). Three regions were assessed for trends in biota and sediment. Across all PCBs, the mean % yearly changes were negative (improving) in biota in all 3 regions, with the Minches and Western Scotland and Northern North Sea regions showing significant downward trends. For sediment there were no significant trends for the three regions.
The Scottish Continental Shelf had insufficient number of time series or spread of stations for a regional status and trend assessment of sediment and biota. However, PCB concentrations at the few sites in this area were below EACs with no significant trends.
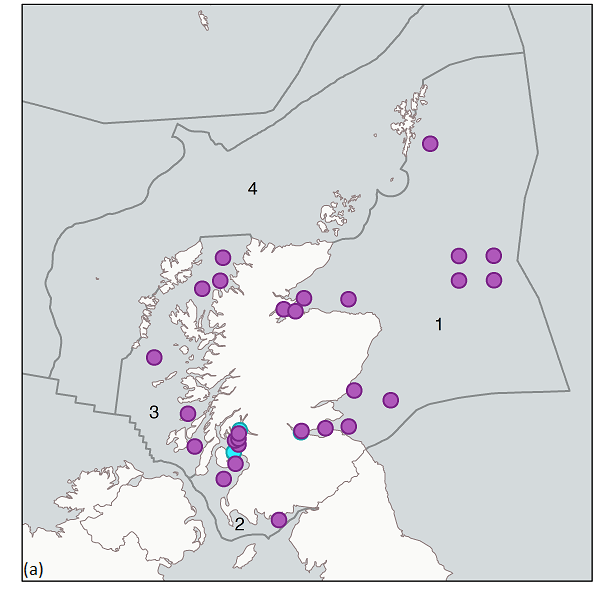
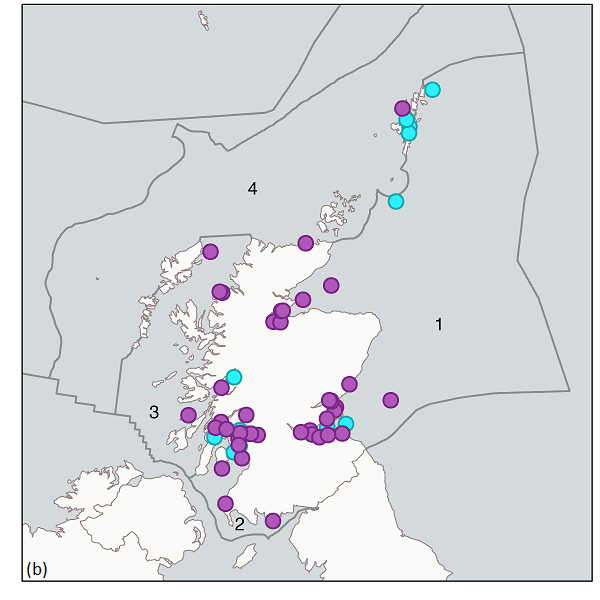
Figure 2: Monitoring stations used to assess CB concentrations in (a) sediment and (b) biota (shellfish and fish) per biogeographic region (grey lines). Magenta dots = stations used for trend and status assessments. Cyan dots = stations used for status assessment only. 1, Northern North Sea; 2, Irish Sea (Clyde and Solway); 3, Minches and Western Scotland; 4, Scottish Continental Shelf.

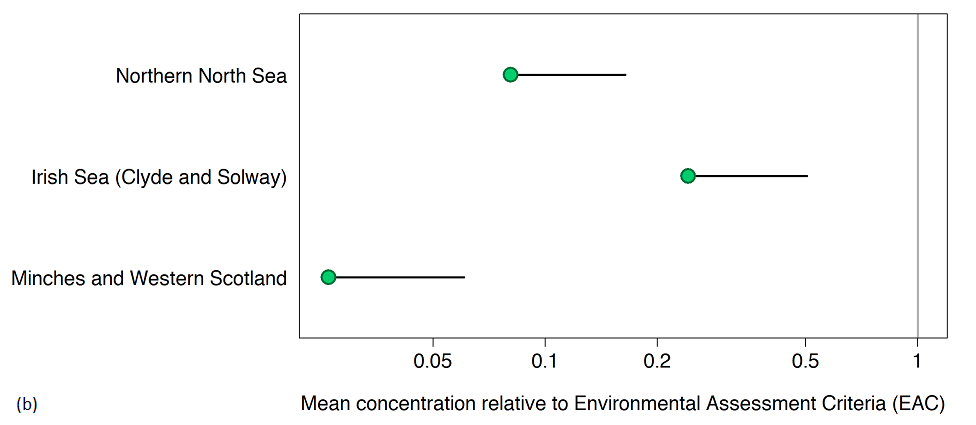
Figure 3: Status assessment; mean PCB concentrations in (a) sediment and (b) biota in each Scottish biogeographic region relative to the EAC (with 95 % confidence limits), where the EAC value is 1. Concentrations are significantly below the EAC if the upper confidence limit is below 1. Blue = statistically significantly below the BAC. Green = at or above the BAC but statistically significantly below the EAC.
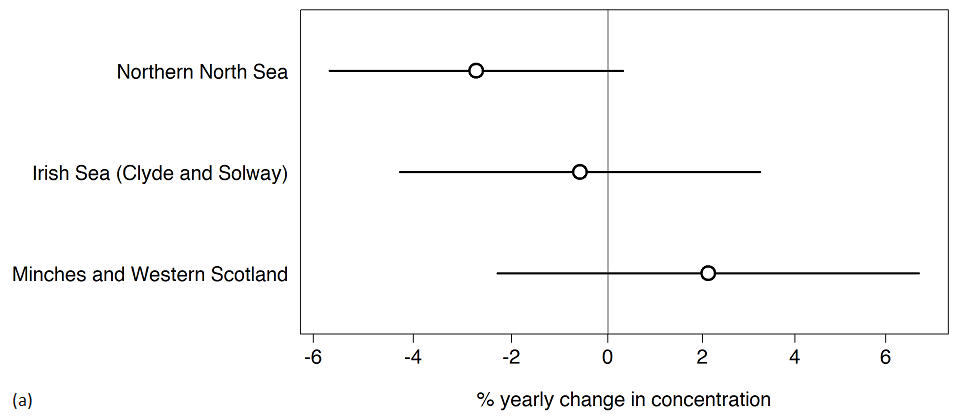
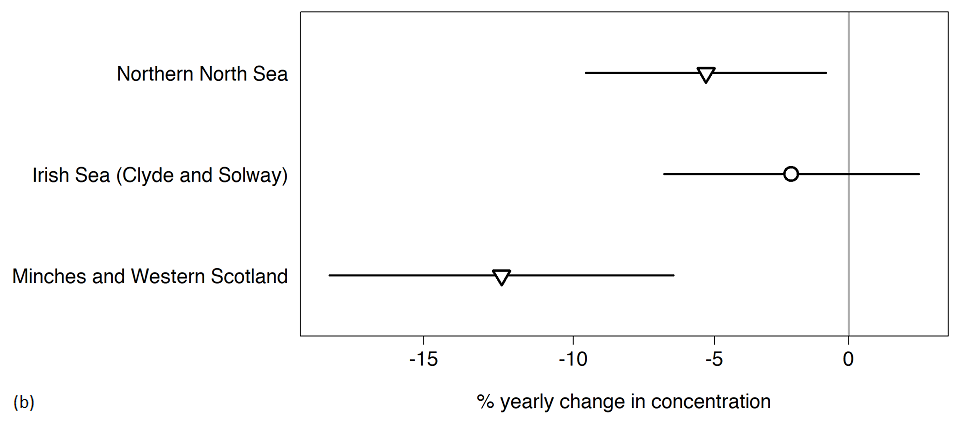
Figure 4: Trend assessment; percentage yearly change in PCB concentrations in each Scottish biogeographic region assessed for (a) sediment and (b) biota. There is a significant trend if the confidence limits does not cut the vertical line at 0. Upward trends (upwards triangle), downward trends (downwards triangle), no change (circle) and 95 % confidence limits (lines).
MSS and SEPA PCB data were used in the assessment, with laboratories complying with ISO 17025, being UKAS accredited (for most determinands) and participating in the QUASIMEME proficiency testing scheme. Therefore, there is high confidence in the quality of the data used in this assessment. The data have been collected over many years using established sampling methodologies. In addition, established and internationally recognised protocols for monitoring and assessment are used, therefore there is also high confidence in the methods. The assessment methodology has been developed and improved since the assessment for Scotland’s Marine Atlas (Baxter et al., 2011), with a regional assessment being undertaken and presented here rather than the individual station assessment presented in the 2011 Atlas.
The number of stations assessed for status and trends in each of the 4 biogeographic regions is shown in Table a. Although overall the regional status assessment showed adverse biological effects in marine species are unlikely, a number of sites (sediment and biota) gave unacceptable concentrations (> EAC) for at least one PCB, so there may be some localised impacts. Figure a shows mean individual PCB concentrations (normalised to organic carbon for sediment) relative to the EAC for sediment and biota in each biogeographic region. The most toxic (dioxin-like) PCB compound (CB118) gave a regional mean concentration above the EAC for sediment and biota in the Irish Sea (Clyde and Solway). Furthermore for biota, the EAC was exceeded for 16% of assessments in the Northern North Sea, 6% in the Minches and Western Scotland, 7% in the Scottish Continental Shelf and 31% in the Irish Sea (Clyde and Solway). For sediment the EAC was exceeded for 17% of assessments in the Northern North Sea, 10% for the Minches and Western Scotland and for 20% in the Irish Sea (Clyde and Solway).
Although a regional assessment of status was not undertaken for the Scottish Marine Atlas in 2011, the status of PCB concentrations in sediment and biota were similar to this assessment with most sites having concentrations being below the EAC for all PCB compounds except CB118. In the 2011 assessment CB118 exceeded the EAC in all mussel sites and for sediments in the inner Firth of Clyde and for some sites in the Forth, Moray Firth, and Minch Malin. For this assessment there appears to have been some improvement with CB118 being below the EAC at many sites and with the regional mean only exceeding the EAC for sediment and biota in the Irish Sea (Clyde and Solway).
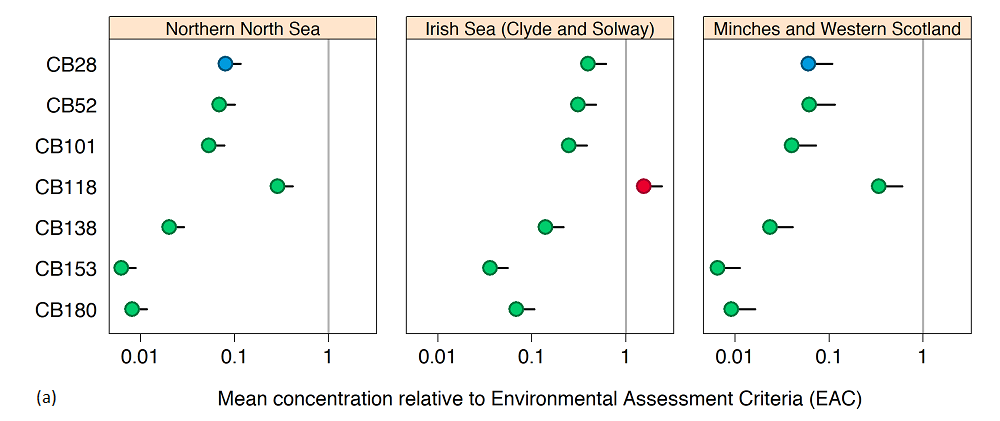
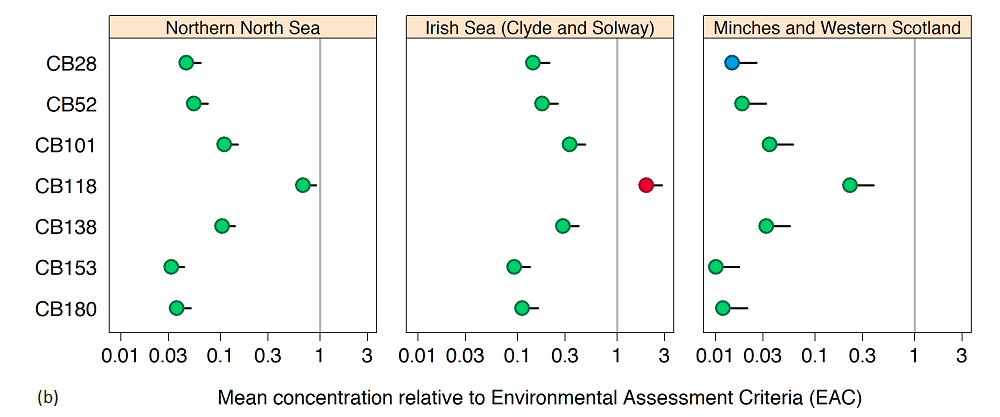
Figure a: Status assessment; mean PCB concentration in (a) sediment and (b) biota (fish and shellfish) in each Scottish biogeographic regions, relative to the EAC (with 95 % confidence limits) where the EAC value is 1. Concentrations are significantly below the EAC if the upper confidence limit is below 1. Blue = statistically significantly below the BAC. Green = at or above the BAC but statistically significantly below the EAC. Red = statistically significantly above the EAC.
Trends in PCB concentrations were also assessed in regions where there were at least five years of data. The %-yearly change for individual PCB congener in each Scottish biogeographic region assessed is shown in Figure b.
For sediment there were significant downwards trends for CB138 and CB101 in the Northern North Sea, however across all PCBs, concentrations in sediment were stable with a mean % yearly decrease of 2.73%. The Irish Sea (Clyde and Solway) also showed negative yearly changes, although none were significant, with a mean decrease of 0.59%. In contrast the mean % yearly change for all PCBs were positive for the Minches and Western Scotland, with a mean % yearly change of 2.12%.
For biota there were significant downward trends in all three regions assessed, with most decreasing trends being observed in the Minches and Western Scotland region. Regional mean % yearly decreases in biota were 12.4%, 5.3% and 2.2% for Minches and Western Scotland, Northern North Sea and Irish Sea (Clyde and Solway), respectively. Only the Irish Sea (Clyde and Solway) not showing a significant trend across all PCBs (Figure 4b).
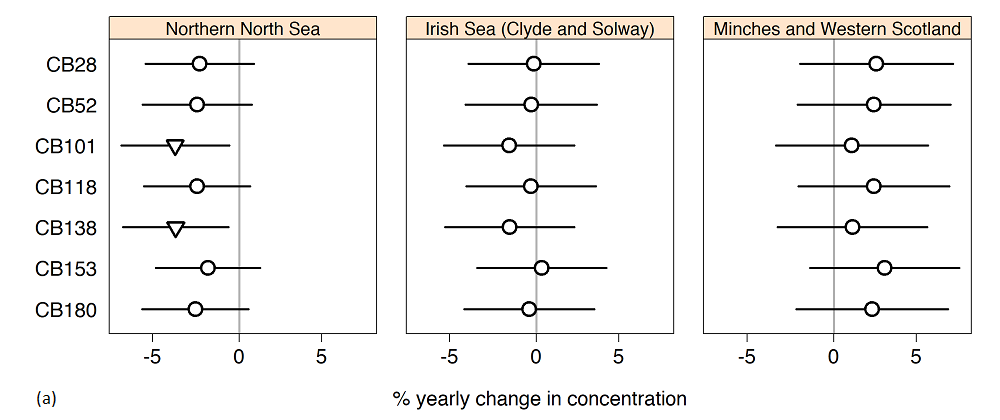
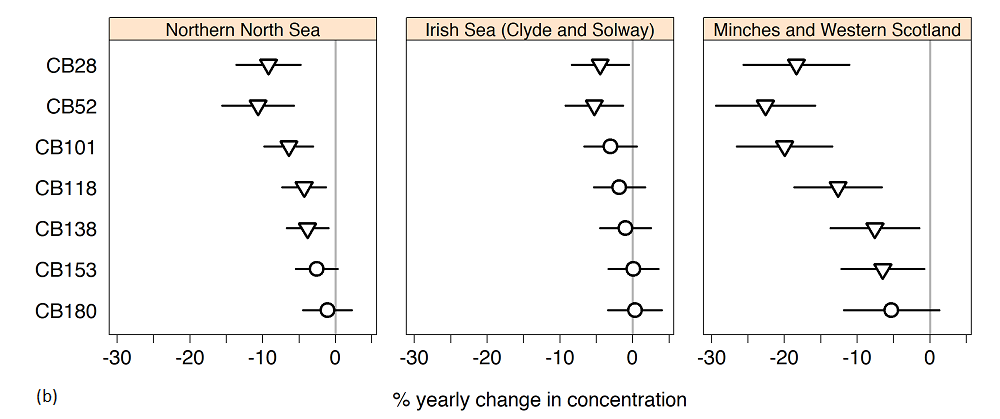
Figure b: Trend assessment; mean annual trends in PCB concentrations in (a) sediment and (b) biota (fish and shellfish) by biogeographic region and compound. There is a significant trend if the confidence limits does not cut the vertical line at 0. Upward trends (upwards triangle), downward trends (downwards triangle), no change (circle) and 95 % confidence limits (lines).
Scotland’s Marine Atlas (2011) did not present any information on the trends of PCBs in sediment and biota either by individual site or by Scottish Sea Area. The overall conclusion for trends of hazardous substances in the 2011 Atlas was that concentrations in water, sediment and mussels were decreasing, but remained high in industrialised areas such as the Clyde and Forth.
Scottish Marine Regions
Eleven Scottish Marine Regions (SMRs) were created by The Scottish Marine Regions Order 2015 which cover sea areas extending out to 12 nm. Regional assessments, to support Regional Marine Plans are required to be developed for each SMR by the relevant Marine Planning Partnership.
The CSEMP sampling design is based on the biogeographic regions used within UK and MSFD assessments and therefore there are insufficient data for a regional assessment for all SMRs. In particular, some SMRs have no or few (<3) monitoring stations. For sediment, four of the eleven SMRs might have sufficient data for a regional assessment; Clyde, Forth and Tay, Moray Firth and West Highland. For biota, eight of the eleven SMRs (all but Orkney, North Coast and North East) might have sufficient data for a regional assessment. Further work is needed to undertake an assessment at the SMR level.
However, each SMR is contained within a biogeographic region or, in some cases, straddles two biogeographic regions (Shetland and Outer Hebrides). Table c shows the SMR and the biogeographic region(s) they are in. Using the biogeographic assessment of PCBs it is likely that overall PCB concentrations in biota and sediment will be above background but below the EAC in all SMRs, except for the Clyde, and Forth and Tay. At least one PCB congener exceeded the EAC at a number of sediment and biota stations in the Clyde, and Forth and Tay. Concentrations for CB118 in biota exceeded the EAC at all but one station in the Forth and Tay and all but 2 stations in the Clyde whilst for sediment CB118 was > EAC at all but one stations in the Clyde and all but 3 in the Forth & Tay. Only CB153 did not exceed the EAC at any sediment or biota station. Concentrations are also likely to be stable or decreasing in all SMRs.
Additional monitoring stations would be required to enable regional assessments in each SMR. This might be achievable for biota if the monitoring stations are increased. It is less likely to occur for sediment as it will be harder in some SMRs to find muddy areas suitable for contaminant monitoring. For example, much of the sediment in the Outer Hebrides, Orkney, North Coast and North East are sand, gravel or rock.
|
SMR
|
Biogeographic region
|
|
Argyll
|
Minches and Western Scotland
|
|
Clyde
|
Irish Sea (Clyde and Solway)
|
|
Forth and Tay
|
Northern North Sea
|
|
Moray Firth
|
Northern North Sea
|
|
North Coast
|
Scottish Continental Shelf
|
|
North East
|
Northern North Sea
|
|
Outer Hebrides
|
Scottish Continental Shelf
Minches and Western Scotland
|
|
Orkney Islands
|
Scottish Continental Shelf
|
|
Shetland Isles
|
Northern North Sea (east Shetland)
Scottish Continental Shelf (west Shetland)
|
|
Solway
|
Irish Sea (Clyde and Solway)
|
|
West Highlands
|
Minches and Western Scotland
|
Conclusion
Mean PCB concentrations in sediment and biota (mussels and fish liver) were above background concentrations in the assessed Scottish biogeographic regions but below the EAC and therefore PCB concentrations are unlikely to cause adverse effects in marine organisms. However, for the most toxic PCB compound of the seven measured the EAC was exceeded in some areas, with the regional mean for this compound being above the EAC in sediment and biota from the Irish Sea (Clyde and Solway). Adverse effects on marine organisms may still be possible in these areas.
Due to past industrial uses and the persistence of PCBs it will take several more decades before concentrations in sediment and biota will disappear. Whilst there are still breaches of the EAC in some locations trends in PCBs in many regions are downward, reflecting the UK wide ban on PCBs in 1981 and subsequent regulation in Scotland that requires safe disposal.
The EAC was exceeded in some areas for the most toxic, dioxin-like PCB congener (CB118). Concentrations for CB118 in sediment and biota exceeded the EAC at some stations in all regions, and the regional mean was above the EAC in biota and sediment from the Irish Sea (Clyde and Solway). Therefore, adverse effects on marine organisms may still be possible in these areas. Due to past industrial uses and the persistence of PCBs it will take several more decades before concentrations in sediment and biota will disappear.
The assessment methodology has been developed and improved since Scotland’s Marine Atlas (2011). Therefore a direct comparison to the 2011 assessment was not possible. The assessment criteria used were the same but the regional assessment model was not used and concentrations at individual sites were compared directly to assessment criteria and there was no statistical assessment of trends undertaken for PCBs.
The 2011 assessment also showed that PCB concentrations at most sites were above the BAC but below the EAC, except for CB118 in biota which exceeded the EAC at all sites. Only the status assessments for CB52, CB153 and CB118 were presented in the 2011 assessment and no attempt was made to combine individual PCB assessments to give an overall PCB assessment of status and trends.
The CSEMP sampling design was based around the biogeographic regions used in OSPAR and MSFD assessments, therefore there are insufficient data for status and trend assessments of all SMRs. Each SMR will be within a biogeographic region. In some SMRs there will be no or few stations, particularly for sediment, and regional assessments will not be possible without additional sampling.
Knowledge gaps
There are a lack of monitoring data, particularly for sediment and biota in the Scottish Continental Shelf. This is partly due to difficulties sampling in this area and the sediment type which is mainly sandy or rock and therefore not suitable for contaminant monitoring. In addition, there are not enough monitoring data to assess at the SMR scale.
There were insufficient data for the assessment of all SMRs. Since Scotland’s Marine Atlas (2011) and OSPAR Quality Status Report (2010) the focus for annual CSEMP contaminant monitoring has been to establish sufficient coverage to make regional assessments at the biogeographic scale for OSPAR and MSFD assessments.
Additional sampling and analysis would be required if regional assessments were to be made for all SMRs. However the sediment type may not be suitable for contaminant analysis in all SMRs. In addition, shellfish sampling in all SMRs might not be possible, due to the lack of mussels in some areas. It may be possible to use PCB data for scallops to improve the spatial coverage for regional assessments, MSS is currently investigating this.
Status and trend assessment
This status and trend assessment is an overall assessment for Contaminants in sediment and biota (PAHs, PCBs, PBDEs and metals in sediment and biota) and Biological effects of contaminants.
|
Region assessed
|
Status with confidence
|
Trend with confidence
|
Comments
|
|---|---|---|---|
|
Irish Sea (Clyde and Solway)
|
 |
|
Green square with red triangle for status indicates few or no concerns as a whole, but many local concerns, particularly in the Clyde, with some sites exceeding the EAC/EAC-proxy. Two stars for confidence in the status is due to lack of suitable assessment criteria for some determinands (metals in biota and some biological effects measurements)
|
|
Minches and Western Scotland
|
 |
|
Two stars for confidence in the status is due to lack of suitable assessment criteria for some determinands (metals in biota and some biological effects measurements). In addition there is limited fish sites which impacts on the ability to make biological effects assessments.
|
|
Northern North Sea
|
|
|
Two stars for confidence in the status is due to lack of suitable assessment criteria for some determinands (metals in biota and some biological effects measurements)
|
|
Scottish Continental Shelf
|
|
|
One star for confidence in the status is due to lack of suitable assessment criteria for some determinands (metals in biota and some biological effects measurements). In addition this region could not be assessed for all determinand/matrix combinations due to the lack of sites
|
This Legend block contains the key for the status and trend assessment, the confidence assessment and the assessment regions (SMRs and OMRs or other regions used). More information on the various regions used in SMA2020 is available on the Assessment processes and methods page.
Status and trend assessment
|
Status assessment
(for Clean and safe, Healthy and biologically diverse assessments)
|
Trend assessment
(for Clean and safe, Healthy and biologically diverse and Productive assessments)
|
||
|---|---|---|---|
 |
Many concerns |
No / little change |
|
 |
Some concerns |
Increasing |
|
 |
Few or no concerns |
Decreasing |
|
 |
Few or no concerns, but some local concerns |
No trend discernible |
|
| |
Few or no concerns, but many local concerns |
All trends | |
 |
Some concerns, but many local concerns |
||
 |
Lack of evidence / robust assessment criteria |
||
| Lack of regional evidence / robust assessment criteria, but no or few concerns for some local areas | |||
 |
Lack of regional evidence / robust assessment criteria, but some concerns for some local areas | ||
| Lack of regional evidence / robust assessment criteria, but many concerns for some local areas | |||
Confidence assessment
|
Symbol |
Confidence rating |
|---|---|
|
Low |
|
|
Medium |
|
|
High |

Assessment regions
 and the Scottish Offshore Marine Regions (OMRs, O1 – O10)")
Key: S1, Forth and Tay; S2, North East; S3, Moray Firth; S4 Orkney Islands, S5, Shetland Isles; S6, North Coast; S7, West Highlands; S8, Outer Hebrides; S9, Argyll; S10, Clyde; S11, Solway; O1, Long Forties, O2, Fladen and Moray Firth Offshore; O3, East Shetland Shelf; O4, North and West Shetland Shelf; O5, Faroe-Shetland Channel; O6, North Scotland Shelf; O7, Hebrides Shelf; O8, Bailey; O9, Rockall; O10, Hatton.
 Regions. These have been used as the assessment areas for hazardous substances.")
, Regions.")