
Background
Eutrophication in the marine environment is the excessive growth of phytoplankton in response to enrichment by nutrients (nitrogen (N) and phosphorus (P)) resulting in an undesirable disturbance in the marine ecosystem. The consequences are often wide ranging, with overall impacts on the diversity and abundance of flora and fauna resulting from the depletion of oxygen in the water column, increases in water turbidity and behavioural changes in larger fauna.
Nitrogen and phosphorus can enter the sea from a number of natural and anthropogenic sources: direct discharges (e.g. sewage, aquaculture etc.), inputs from rivers, land runoff and atmospheric deposition.
The decomposition of excessive phytoplankton growth has the potential to lower the levels of dissolved oxygen (DO) in the water column. Above 6 mg l-1, DO concentrations are able to support healthy marine ecosystems, whereas when DO concentrations fall below 2 mg l-1 hypoxic conditions are created that have detrimental effects on marine life. In between these two thresholds there may be some sub-lethal and lethal impacts on sensitive species such as salmonids.
Dissolved oxygen levels can also be affected by changes in salinity and temperature. Increasing water temperatures, as a consequence of greenhouse gas emissions, may result in degassing and lower dissolved oxygen concentrations.
This indicator assesses the levels of DO within each of the Scottish Marine Regions (SMRs) and Offshore Marine Regions (OMRs) as an indirect indicator of nutrient enrichment. It is assessed in two different ways. Firstly, results from Water Framework Directive (WFD) water body classification are presented for transitional and coastal water bodies within SMRs. Secondly, seabed DO data collected offshore were assessed against OSPAR and the Marine Strategy Framework Directive (MSFD) assessment thresholds.

Dissolved oxygen (DO) is essential for marine ecosystem functioning. The impacts of lowered oxygen levels range from avoidance by certain species, to an increase in abundance of low oxygen tolerant species and to the death of marine organisms. DO concentrations vary naturally with the seasons, particularly with seasonal stratification. However, there are a number of causes of unnatural depletion such as climate change and eutrophication that bring oxygen levels below those which support healthy ecosystem function (6 mg l-1). The exact cause of oxygen depletion can often be hard to disentangle.
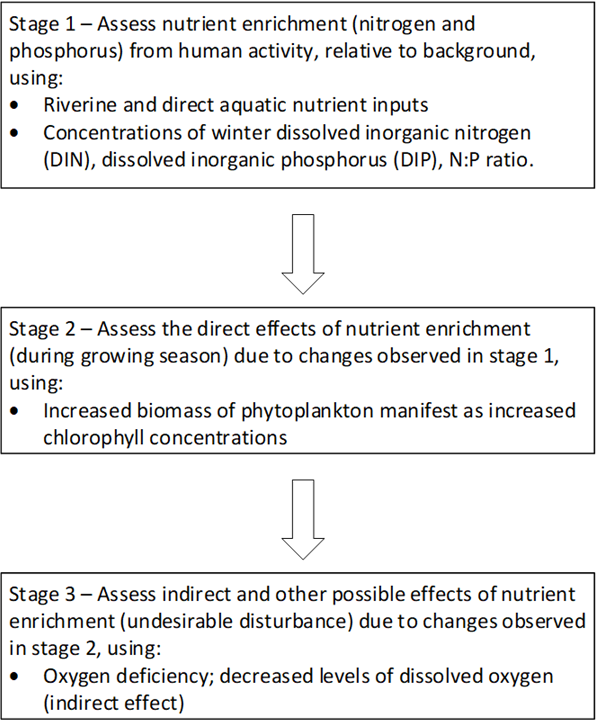
The assessment of eutrophication is split into indicators of nutrient enrichment, direct eutrophication effects and indirect eutrophication effects as per the OSPAR and MSFD eutrophication assessment methodology. The components of the OSPAR and MSFD eutrophication assessment methodology that are used are shown in Figure a.
Eutrophication is a problem if there is evidence of nutrient enrichment (Stage 1; inputs & winter nutrients), direct effects of nutrient enrichment (Stage 2; elevated chlorophyll concentration, increased blooms) and indirect effects of nutrient enrichment (Stage 3; oxygen deficiency, biomass changes). This indicator assessment aims to understand the dissolved oxygen levels in the marine environment as an indirect effect of nutrient enrichment.
 |
|
Figure a: The three stages of eutrophication assessment used in the Scottish Marine Assessment. |
Dissolved oxygen (DO) has been assessed using two different approaches depending on where data have been collected. Inshore and transitional waters fall under the EU Water Framework Directive (WFD) and were therefore assessed against WFD DO standards. Waters outside of WFD areas were assessed against the thresholds and processes outlined by OSPAR and MSFD. Both of these approaches are outlined in more detail below.
WFD Assessment
DO is used as a classification parameter for the EU Water Framework Directive. Standards have been derived for the classification bands: Bad, Poor, Moderate, Good and High at the UK level by the United Kingdom Technical Advisory Group (UKTAG) according to impacts on fish species. The DO standards are based on the 5th percentile DO concentrations in a waterbody collected over the duration of a year. The standards derived for the UK are shown in Table a as set out in the Scotland River Basin District (Standards) Directions 2014.
|
Classification Band
|
5th Percentile Dissolved Oxygen (mg l-1) coastal water where salinity >34.5
|
5th Percentile Dissolved Oxygen (mg l-1) coastal and transitional water where salinity <34.5
|
Description
|
|---|---|---|---|
|
High
|
5.7
|
7 - (0.0037 * salinity)
|
Protects all life-stages of salmonid fish
|
|
Good
|
4
|
5 - (0.0029 * salinity)
|
Resident salmonid fish
|
|
Moderate
|
2.4
|
3 - (0.0017 * salinity)
|
Protects most life-stages of non-salmonid adults
|
|
Poor
|
1.6
|
2 - (0.0011 * salinity)
|
Resident non-salmonid fish, poor survival of salmonid fish
|
In waters where salinity is <34.5 (salinity ranges from around 0 to 35, from fresh to seawater), standards vary due to the relationship between oxygen solubility and salinity within this salinity range.
At the SMR scale the WFD data collected by the Scottish Environment Protection Agency (SEPA) were used to make an assessment of waterbodies within each SMR using the WFD classification approach.
It is important to note that SEPA does not collect WFD data in every waterbody. Data are collected throughout the year at a small subset of locations that are representative of groups of waterbodies of similar typologies. There are cases where the representative location of a waterbody sits within a different SMR to the waterbody being assessed.
OSPAR/MSFD Assessment
These standards broadly align with thresholds set out in the OSPAR common procedure and MSFD, where near seafloor DO concentrations >6 mg l-1 are considered to have minimal impacts on marine life (comparable with the High WFD class band). Concentrations <2 mg l-1 are considered to cause severe problems (comparable to the Poor WFD class band). Average DO concentrations in the lowest quartile from samples collected within 10 m of the seabed at sites <500 m in depth are used in the OSPAR and MSFD assessments.
Data were filtered for the period 1st July to 31st October when the sea was more likely to be stratified (i.e. exhibiting layering caused by gradients in temperature and/or salinity that restrict mixing between surface and deeper water) and therefore DO concentrations lowest. Years with less than five data points within a region were removed from the analysis for robustness.
Data to be assessed against the OSPAR and MSFD thresholds were obtained from the International Council for the Exploration of the Seas (ICES) database from 1990 to 2017. Available data are shown in Figure b. Note – this is data availability before data points were removed from the analysis if there were less than five data points in a region per year
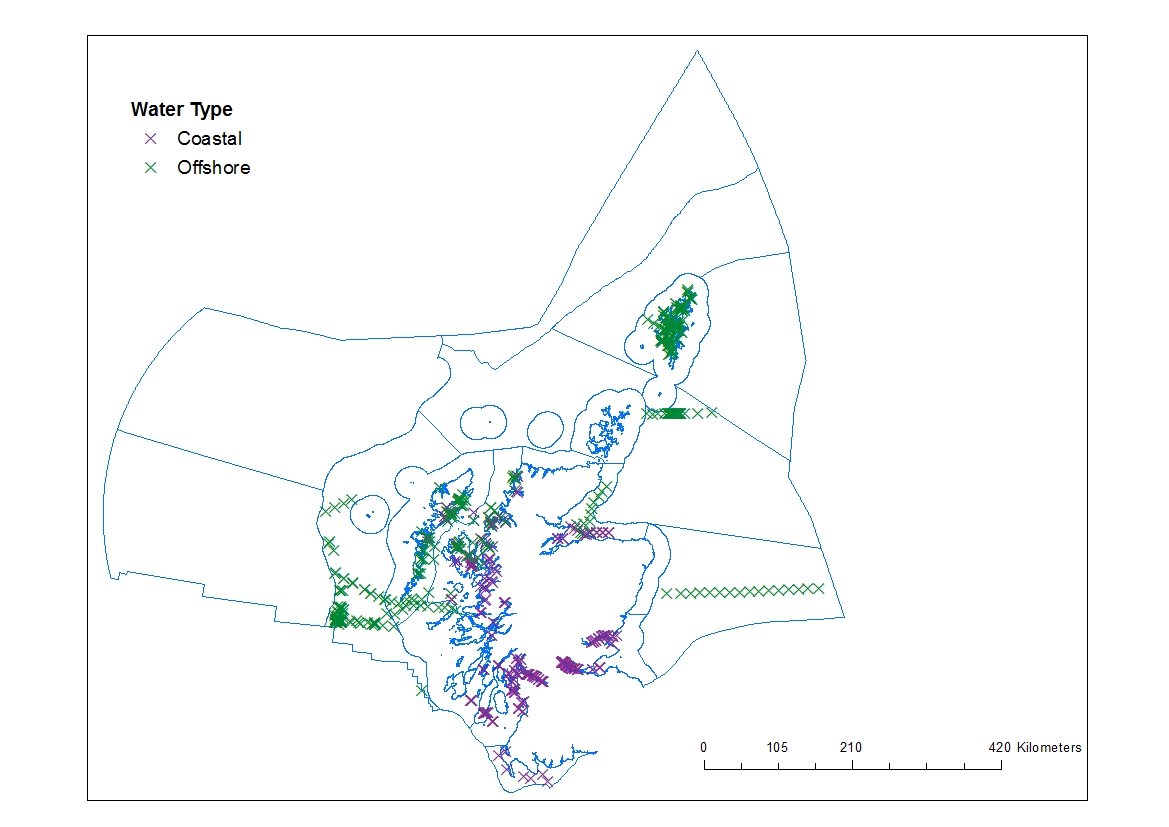
Figure b: Map showing where near-bed DO data (1st July - 31st October) on DO were available, 1990 to 2017. X = sampling locations at coastal (purple) and offshore (green) sites
Data availability within each region for the decades assessed are shown in Table b.
|
SMR
|
1990-1999
|
2000-2009
|
2010-2017
|
|
Solway
|
0
|
11
|
4
|
|
Clyde
|
0
|
94
|
132
|
|
Argyll
|
2
|
23
|
16
|
|
West Highlands
|
6
|
114
|
23
|
|
Outer Hebrides
|
4
|
72
|
3
|
|
Orkney Islands
|
0
|
5
|
3
|
|
Shetland Isles
|
0
|
96
|
49
|
|
North Coast
|
0
|
1
|
0
|
|
Moray Firth
|
0
|
3
|
39
|
|
North East
|
0
|
1
|
2
|
|
Forth & Tay
|
0
|
79
|
179
|
|
OMR
|
|
|
|
|
Hatton
|
0
|
0
|
0
|
|
Bailey
|
0
|
0
|
0
|
|
Rockall
|
4
|
7
|
0
|
|
Hebrides Shelf
|
192
|
11
|
0
|
|
North Scotland Shelf
|
0
|
1
|
0
|
|
North and West Shetland Shelf
|
0
|
0
|
9
|
|
Faroe Shetland Channel
|
0
|
1
|
0
|
|
East Shetland Shelf
|
0
|
0
|
2
|
|
Fladen and Moray Firth Offshore
|
0
|
0
|
29
|
|
Long Forties
|
0
|
0
|
16
|
Data availability was insufficient to able to conduct robust trend analysis.
Results
In the latest WFD classification (2017) 499 of the 504 transitional and coastal water bodies classified were at a High status for DO. Of the remaining five waterbodies, four were classified as Good and one was Moderate (Inner Clyde Estuary). Waterbodies below High status are detailed in Table 1. The predominant cause of DO pressures in the Inner Clyde Estuary is from the decomposition of excess organic material released from municipal wastewater and diffuse pollution sources by microorganisms that use DO.
|
Waterbody
|
SMR
|
Status
|
|
Inner Clyde Estuary
|
Clyde
|
Moderate
|
|
Loch Striven
|
Clyde
|
Good
|
|
Loch Long (South)
|
Clyde
|
Good
|
|
Loch Long (North)
|
Clyde
|
Good
|
|
Upper Forth Estuary
|
Forth and Tay
|
Good
|
This classification demonstrates an improving picture since WFD classification started in 2007 when three waterbodies were classified as Poor.
Seabed data assessed against OSPAR and MSFD thresholds presents a similar result. Figure 2 presents the DO data by decade for each SMR and OMR. All regions are above the assessment level of 6 mg l-1 in the decades where data were available, with the exception of the Clyde Coastal data which are below the assessment level but above what is considered to be hypoxic.
There are also a number of cases where the lowest values within the range of data used to undertake the assessment fall below the assessment threshold e.g. Forth & Tay, and West Highlands. Looking at the annual data (not shown), these appear to be related to sampling within a specific year (West Highlands, Outer Hebrides) or year to year fluctuations around the threshold level (Forth & Tay).
There are however a number of data gaps in all SMRs, with no SMR having a full complement of data for both water types across the three decades.
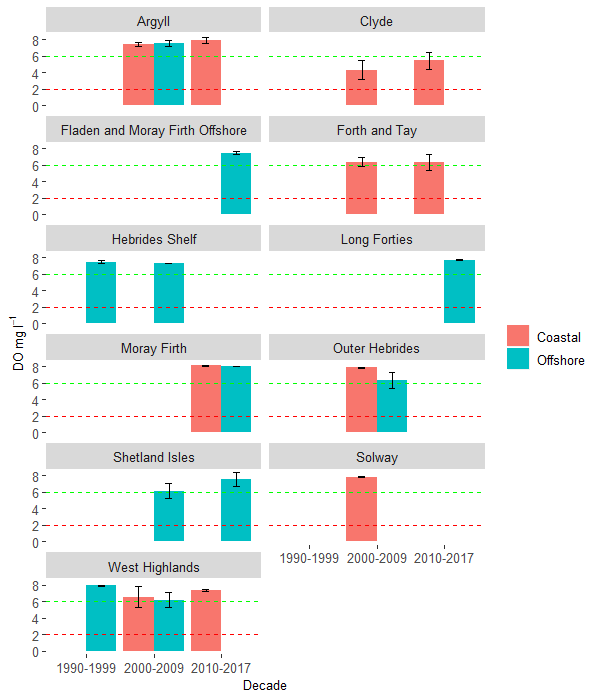
Figure 2: Average concentrations of DO (mg l-1, as average values in the lowest quartile of the data) near the seabed in each SMR and OMR, 1990-2017.
The green line shows the threshold value (6 mg l-1) used in assessments of status and red line shows the value (2 mg l-1) below which detrimental ecosystem impacts are likely. Black error bars demonstrate standard deviation. Note: Only SMRs and OMRs that meet the threshold for data availability are shown in the plot (minimum of 5 data points per year).
Trend assessment
There were insufficient data in each region to be able to undertake robust trend assessment for near bed DO. For WFD water bodies there has been an increase in the number of waterbodies classified as High status from 476 in 2007 to 499 in 2018. However, only a small fraction of these waterbodies are sampled for DO as detailed in the assessment methods.
Previous studies have suggested increasing trends in hypoxic zones across the globe, including Scotland (e.g. Diaz & Rosenberg, 2008; Breitburg et al., 2018). However, the ‘hypoxic areas’ identified in Scotland from these two publications are from studies that date back to the 1970s and 1980s, and are reflective of localised episodic hypoxic events. Results from this current assessment, the MSFD assessment and the OSPAR intermediate assessment (OSPAR, 2017) show that regionally, seabed DO concentrations are above threshold levels in most regions.
In the last marine assessment (Baxter et al., 2011) only data from the Forth and the Clyde estuaries were presented as a trend analysis from 1970-2010. Both estuaries showed an improving trend in response to enhancements in municipal wastewater treatment that aimed to reduce loads of organic material in effluents. Although trend assessment was not possible at the SMR scale in this assessment, mean lower quartile DO in the Clyde was higher in the 2010-2017 period than in the preceding 2000-2010 period, suggesting a continued improvement.
Confidence in the data quality is high, both SEPA and Marine Scotland Science (MSS) laboratories conform to ISO 17025 and are UKAS accredited. Confidence in the assessment for many regions is, however, low due to poor data availability.
Conclusion
DO concentrations near the seabed have consistently met assessment levels in most SMRs and OMRs where monitored. The exception to these are coastal waters in the Clyde region which fall below the assessment level but above concentrations deemed to be hypoxic.
WFD assessments also show similar results, with only one waterbody (Inner Clyde Estuary) exhibiting DO concentrations below the minimum Good WFD threshold. Pressures within the Clyde are well understood and efforts are underway to reduce nutrient loading.
Knowledge gaps
The relationship between biological and physical processes near the seafloor is poorly understood. Robust assessments of oxygen deficiency require improved availability of near-bed data on DO concentrations together with salinity, depth and temperature measurements.
Data on seabed DO are only collected consistently within a subset of the regions. At the SMR and OMR scale, this presents a number of data gaps as shown in the results. In addition, WFD classification is based on monitoring in representative locations meaning DO is not routinely monitored in all water bodies. It is hoped that autonomous monitoring methodologies such as those outlined in the AlterECO case study will provide more data in the future to improve our understanding seabed DO.
To better understand trends in dissolved oxygen in relation to climate change more data are required than those which are currently available. There may, therefore, be a requirement to expand the monitoring network to all regions to ensure long-term changes are captured.
Status and trend assessment
The status and trend assessment is for eutrophication and includes, nutrient inputs, winter nutrient concentrations, chlorophyll concentrations and dissolved oxygen concentrations.
|
Region assessed |
Status with confidence |
Trend with confidence |
Comments |
|---|---|---|---|
|
Argyll |
 |
|
Status and trends have been given a confidence of 2 stars because there is limited dissolved oxygen data available in the region and this has been acknowledged as a knowledge gap in the current assessment of overall Eutrophication status. |
|
Clyde |
 |
|
The status green box with blue circle is due to a localised issue within the inner Clyde estuary where the dissolved oxygen is failing. Status and trends have been given a confidence of 2 stars because there is limited dissolved oxygen data available in the region and this has been acknowledged as a knowledge gap in the current assessment of overall Eutrophication status. |
|
Forth and Tay |
|
|
Status and trends have been given a confidence of 2 stars because there is limited dissolved oxygen data available in the region and this has been acknowledged as a knowledge gap in the current assessment of overall Eutrophication status. There is a localised issue with the trend assessment due to increasing chlorophyll concentrations, but trend not reflected in other eutrophication parameters. |
|
Moray Firth |
|
|
Status and trends have been given a confidence of 2 stars because there is limited dissolved oxygen data available in the region and this has been acknowledged as a knowledge gap in the current assessment of overall Eutrophication status. |
|
North Coast |
|
|
Status and trends have been given a confidence of 2 stars because there is limited dissolved oxygen data available in the region and this has been acknowledged as a knowledge gap in the current assessment of overall Eutrophication status. |
|
North East |
|
|
The status green box with blue circle is due to a localised issue within the Ythan Estuary which is categorised as being eutrophic. The rest of the SMR is not impacted and not considered to be Eutrophic. Status and trends have been given a confidence of 2 stars because there is limited dissolved oxygen data available in the region and this has been acknowledged as a knowledge gap in the current assessment of overall Eutrophication status. |
|
Orkney Islands |
|
|
Status and trends have been given a confidence of 2 stars because there is limited dissolved oxygen data available in the region and this has been acknowledged as a knowledge gap in the current assessment of overall Eutrophication status. There is a localised issue of increasing nutrient inputs in the region associated with increasing aquaculture. This increasing input is not impacting nutrients across the SMR with no statistically significant trend in winter DIN observed. |
|
Outer Hebrides |
|
|
There is a localised issue of increasing nutrient inputs in the region associated with increasing aquaculture. This increasing input is not impacting nutrients across the SMR with no statistically significant trend in winter DIN observed. Status and trends have been given a confidence of 2 stars because there is limited dissolved oxygen data available in the region and this has been acknowledged as a knowledge gap in the current assessment of overall Eutrophication status. |
|
Shetland Isles |
|
|
Status and trends have been given a confidence of 2 stars because there is limited dissolved oxygen data available in the region and this has been acknowledged as a knowledge gap in the current assessment of overall Eutrophication status. |
|
Solway |
|
|
Status and trends have been given a confidence of 2 stars because there is limited dissolved oxygen data available in the region and this has been acknowledged as a knowledge gap in the current assessment of overall Eutrophication status. |
|
Western Islands |
|
|
Status and trends have been given a confidence of 2 stars because there is limited dissolved oxygen data available in the region and this has been acknowledged as a knowledge gap in the current assessment of overall Eutrophication status. |
This Legend block contains the key for the status and trend assessment, the confidence assessment and the assessment regions (SMRs and OMRs or other regions used). More information on the various regions used in SMA2020 is available on the Assessment processes and methods page.
Status and trend assessment
|
Status assessment
(for Clean and safe, Healthy and biologically diverse assessments)
|
Trend assessment
(for Clean and safe, Healthy and biologically diverse and Productive assessments)
|
||
|---|---|---|---|
 |
Many concerns |
No / little change |
|
 |
Some concerns |
Increasing |
|
 |
Few or no concerns |
Decreasing |
|
| |
Few or no concerns, but some local concerns |
No trend discernible |
|
 |
Few or no concerns, but many local concerns |
All trends | |
 |
Some concerns, but many local concerns |
||
 |
Lack of evidence / robust assessment criteria |
||
| Lack of regional evidence / robust assessment criteria, but no or few concerns for some local areas | |||
 |
Lack of regional evidence / robust assessment criteria, but some concerns for some local areas | ||
| Lack of regional evidence / robust assessment criteria, but many concerns for some local areas | |||
Confidence assessment
|
Symbol |
Confidence rating |
|---|---|
|
Low |
|
|
Medium |
|
|
High |

Assessment regions
 and the Scottish Offshore Marine Regions (OMRs, O1 – O10)")
Key: S1, Forth and Tay; S2, North East; S3, Moray Firth; S4 Orkney Islands, S5, Shetland Isles; S6, North Coast; S7, West Highlands; S8, Outer Hebrides; S9, Argyll; S10, Clyde; S11, Solway; O1, Long Forties, O2, Fladen and Moray Firth Offshore; O3, East Shetland Shelf; O4, North and West Shetland Shelf; O5, Faroe-Shetland Channel; O6, North Scotland Shelf; O7, Hebrides Shelf; O8, Bailey; O9, Rockall; O10, Hatton.
 Regions. These have been used as the assessment areas for hazardous substances.")
, Regions.")