
Background
On short time scales, sea level changes globally and locally because of the tide and the effect of storm surges. On longer time scales, sea level is affected by global climate change (ocean temperatures and the amount of land-based ice) and the vertical movement of land masses relative to the sea due to the Earth’s crust rebounding following the last ice age.
Variations in sea level impact our shorelines. Tides cause sea level variability on predictable time scales in relatively short time scales, while storm surge and mean sea level rise due to climate change impact sea level extremes. Mean and extremes in sea level are important for protecting our coasts against flooding and erosion.
This assessment presents information on sea level change due to tides and long-term change in mean sea level (sea level rise). Some information on storm surge has been included.
Tides
Information on the tidal range in Scottish waters was obtained from the Scottish Shelf Model (De Dominicis et al., 2018). This assessment presents the mean spring tidal range as the combined amplitude of the semi-diurnal lunar (M2) and solar (S2) tide (in metres) as determined from a harmonic analysis of the Scottish Shelf Model output of seawater elevation.
Sea level rise
This assessment uses data from the UK Tide Gauge Network stations around Scotland (obtained through the Permanent Service for Mean Sea Level; PSMSL) and from the UKCP18 outputs from the Meteorological Office Hadley Centre.
The UK National Tide Gauge Network has nine gauges, located at Leith, Aberdeen, Wick, Lerwick, Ullapool, Kinclochbervie, Stornoway, Tobermory and Millport (Figure a). These tide gauge stations around the Scottish coast have been used to show what is happening with sea level at a local scale.
 around Scotland from the Permanent Service for Mean Sea Level.")
Trends in mean sea level were assessed using a basic linear regression. Statistical significance of the trends was calculated using the non-parametric Mann-Kendall test for a trend (Mann, 1945).
UKCP18 (UK Climate Projection 2018) published 21st century regional time-mean sea level projections, and these data have been used within this assessment. The UKCP18 dataset stems from the projections of global mean sea level (GMSL) that were presented in the Intergovernmental Panel on Climate Change (IPCC) Fifth Assessment Report (AR5), but have been regionalised for the UK. For further information on the methods used to create the UKCP18 sea level projections please see the UKCP18 Marine Report (Palmer et al., 2018)
Results
Tides
The difference between mean high and low water at spring tide, the spring tidal range, for Scottish waters from the Scottish Shelf Model (De Dominicis et al., 2018) shows the sea level variations due to the tides (Figure 1).

The maximum tidal range (the difference between low and high water) occurs during spring tides, when tide generating forces due to the sun and moon align (i.e. new moon and full moon). At neap tides, the forces due to the sun and moon aren’t aligned, and the tidal range is smaller (not shown).
The mean spring tidal range around the coast is generally between 4 and 5 m (Figure 1). The highest tidal ranges between 7 and 8 m are found in the Solway Firth. The smallest tidal ranges occur in areas known as amphidromic points. One of these occurs between Islay and the Mull of Kintyre; another is found in the north-eastern North Sea.
Tidal ranges decrease generally with distance offshore, and in the deep ocean tidal ranges are much smaller than on the shallower continental shelf.
Sea level rise
Trends in sea level vary greatly around our coasts, mainly due to different rates at which the land is moving relative to the sea.
Annual mean sea level observations from the tide gauge network show that sea level rose at all sites since records began (Table 1).
In Aberdeen, the oldest measurement site (started in 1932) trend analysis shows a 9.7 mm per decade increase from then until 2014. Estimates from around Scotland are generally in agreement with the UK and global estimates of long-term sea level rise (14 mm per decade and 18 mm per decade respectively). To compare trends between sites, a common 20 year period 1992-2011 is used. These trends range between 25 and 46 mm per decade.
UK Tide Gauge Network measurements (Figure 2) show the observed annual anomaly. To allow for comparison between sites, these have all been standardised relative to the 1992-2011 average.
 from UK Tide Gauge Network measurement sites. Anomalies are calculated relative to the 1992 - 2011 average. Regions with no data are left white.")
UKCP18 data (climate model output) show that since 2007, most Scottish Marine Regions (SMRs) have shown an increase in mean sea level (Figure 3).
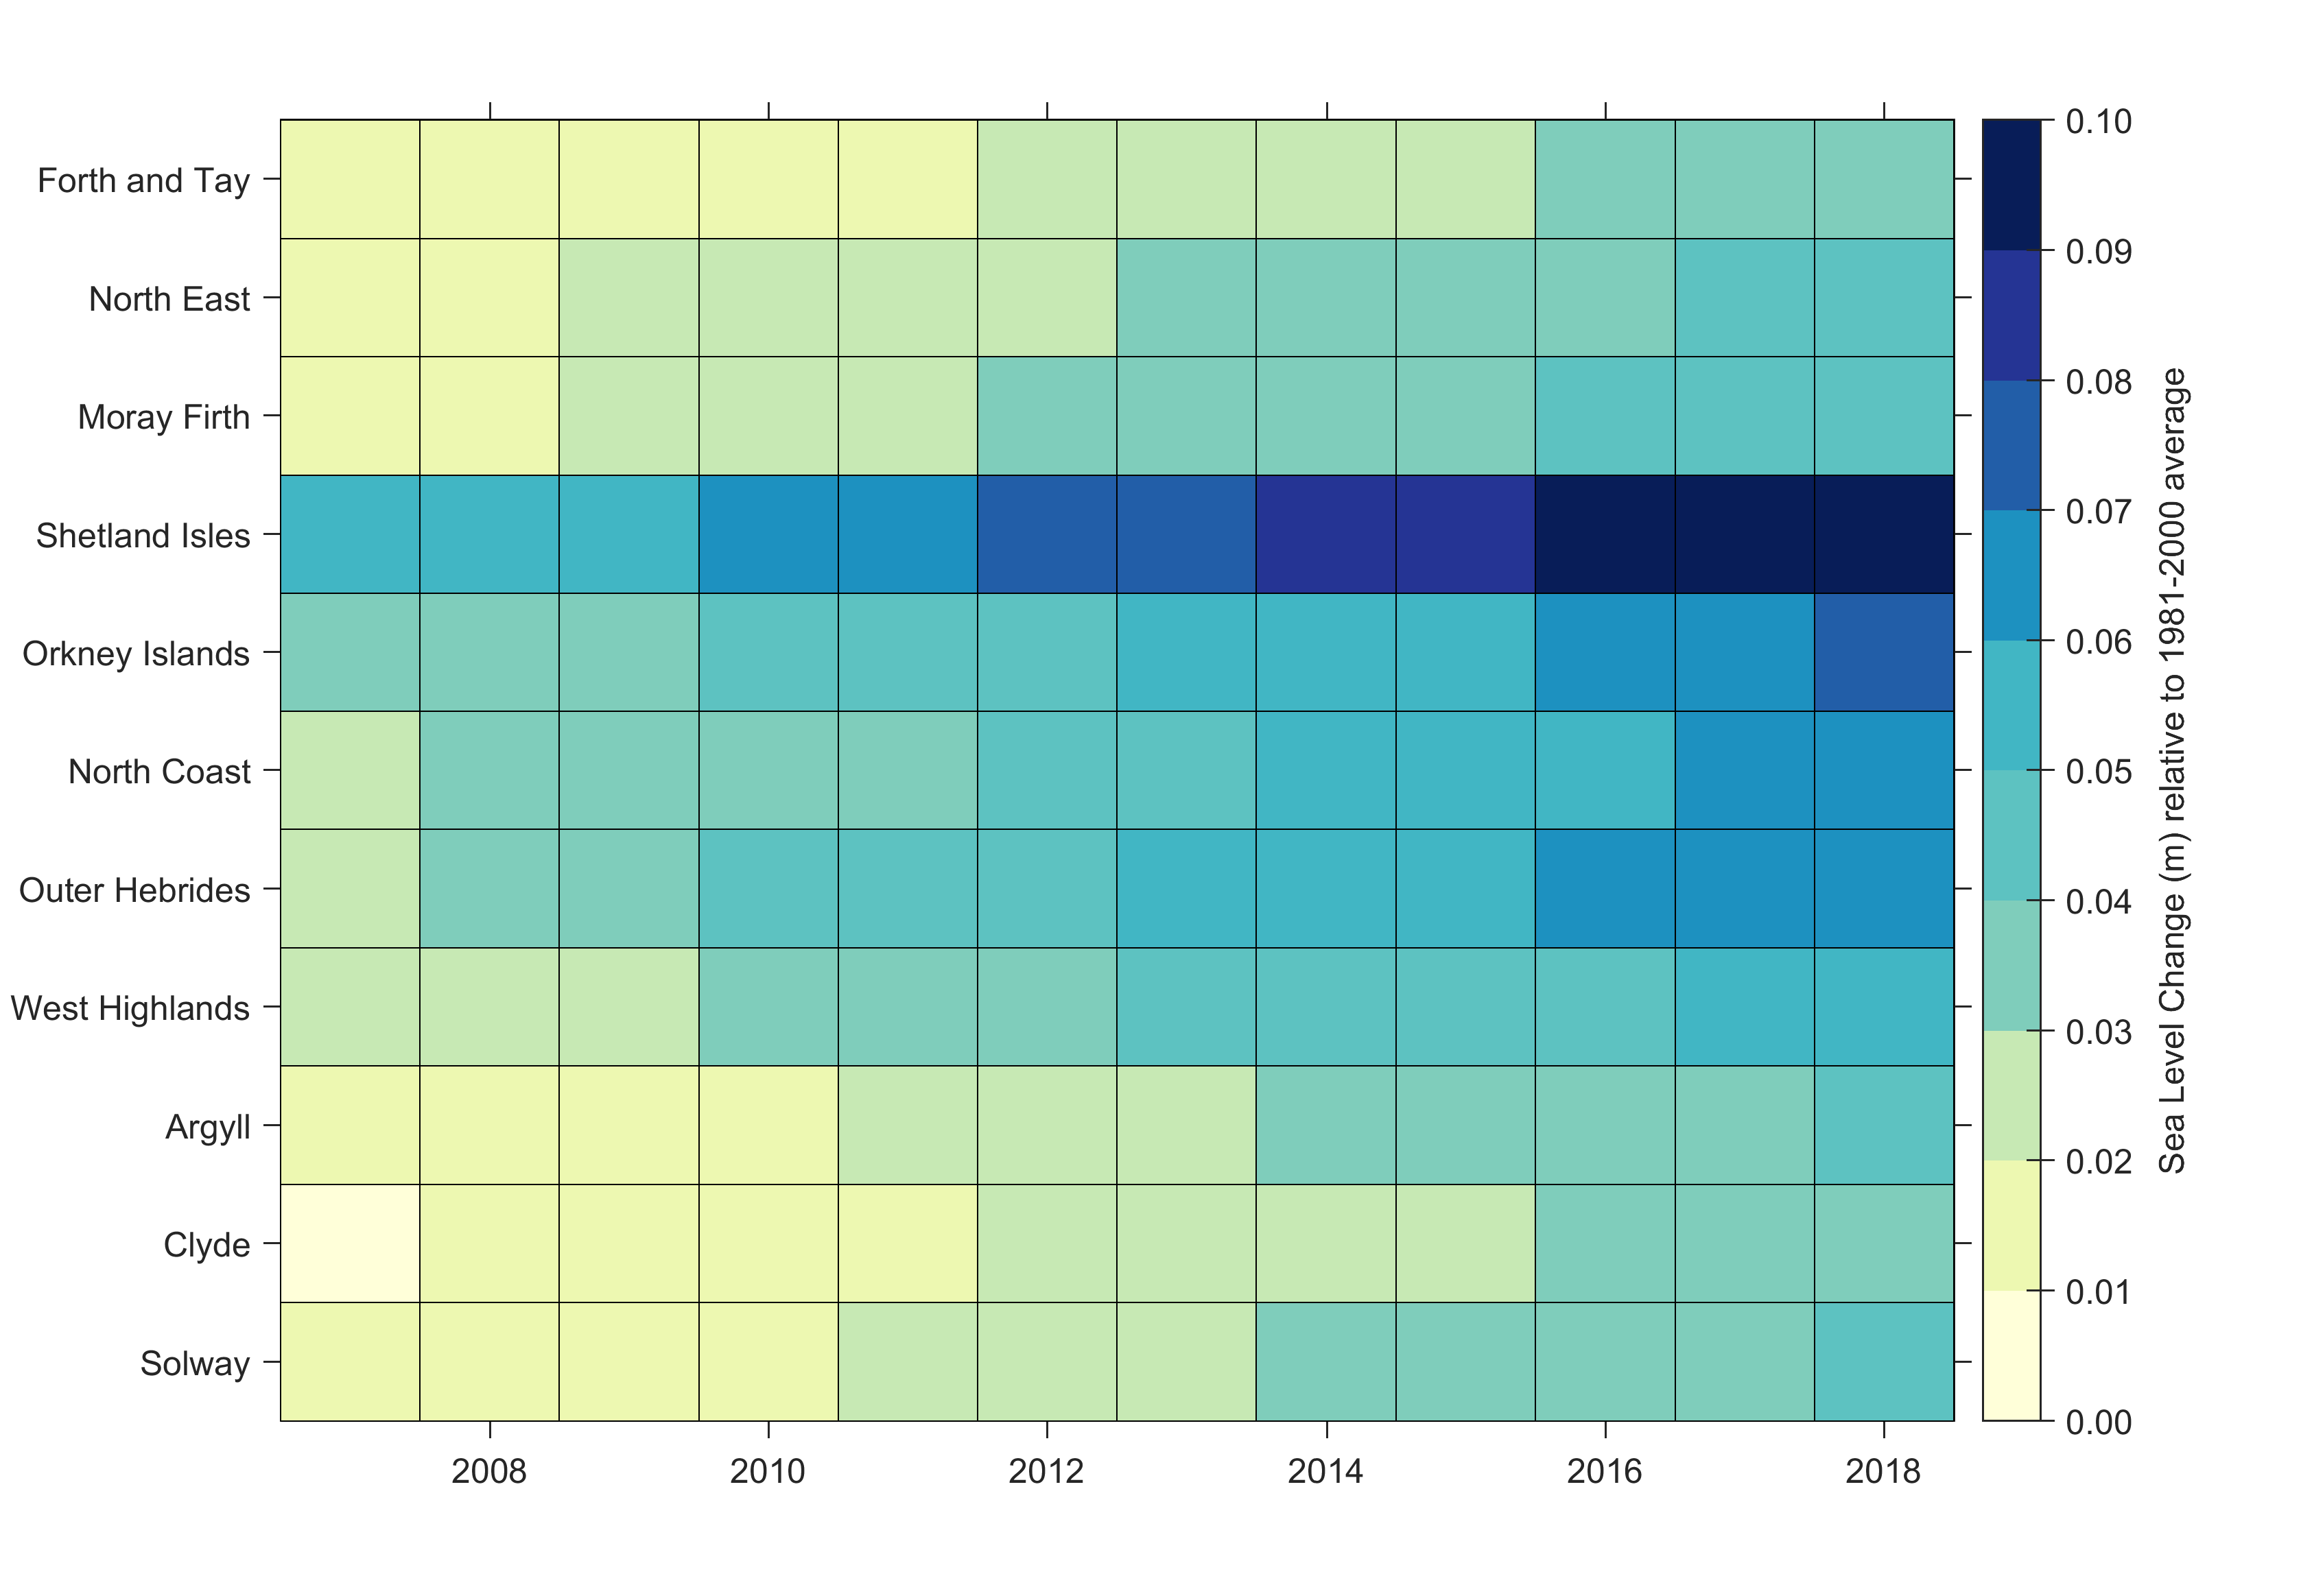
Figure 3: Mean sea level change (m) for 2007-2018 from the UKCP18 climate model baseline scenario (RCP2.6). Change is calculated relative to the 1981 - 2010 sea level.
Due to climate change, sea level is expected to rise due to increased contributions of freshwater from melting of land-based ice (glaciers and the polar ice caps) and due to thermal expansion (IPCC, 2019). For a low emission scenario, the sea level in Edinburgh is expected to rise by 0.08 m to 0.49 m, and for a high emission scenario 0.30 m to 0.90 m by the end of the century (when compared to 1981- 2000) (Met Office Hadley Centre, 2019).
|
Sites
|
Linear trend (1992-2011)
|
Linear trend time series
|
|
|
mm/decade
|
mm/decade
|
Time series used to calculate trend
|
|
|
Aberdeen
|
37.7
|
9.7
|
1932-2014
|
|
Kinlochbervie
|
35.3
|
31.9
|
1992-2019
|
|
Leith
|
31.1
|
24.0
|
1989-2017
|
|
Lerwick
|
37.4
|
n.s.
|
1957-2015
|
|
Millport
|
24.7
|
14.9
|
1969-2018
|
|
Stornoway
|
45.9
|
23.3
|
1977-2019
|
|
Tobermory
|
n.s.
|
21.0
|
1989-2019
|
|
Ullapool
|
n.s.
|
18.8
|
1983-2015
|
|
Wick
|
n.s.
|
15.7
|
1988-2018
|
Sea level rise
To study sea level changes over longer time scales, annual mean sea level (the height of the sea averaged over a year) is used. Scotland’s temperate location causes seasonal mean sea level changes by approx. 10 cm (range) because of thermal expansion of water (the same mass of warmer water takes up a larger volume than colder water) and is maximum in late summer
Regional variations are due to the influence of glacial isostatic adjustment, or ‘post-glacial rebound’. Following the last glacial maximum, the land once under and around the ice is still responding to the lifting of those ice sheets. Bradley et al. (2009) outline the predictions of uplift rate based on model data, which aligns well to the regional sea-level database (Shennan et al., 2006). The centre of the uplift is positioned in central Western Scotland, with an uplift magnitude of about 0.6 mm yr-1, indicating sea level fall relative to land.
Storm surge
Local sea level changes on short time scales also happen due to waves and storms. Storm surges happen mostly along the North Sea coastline. However, they are less significant in Scotland than in regions further south in the North Sea, because the surge grows as it travels south into shallower waters.
A notable storm surge example was in 1953 when surge levels of 0.60 to 0.83 m were recorded in Aberdeen and Leith, respectively. During the same event, the surge level reached 2.97 m in southern England (King’s Lynn) and 3.36 m in the Netherlands.
Changes in storm surge are more uncertain in terms of the frequency of events; however, Palmer et al. (2018) estimate that changes in mean extreme sea level due to storm surge will be an order of magnitude smaller than changes in extreme sea level due to changes in mean sea level.
Conclusion
Sea level varies due to tides and storm surge (over short time scales) and due to landmass and global climate change (over longer time scales). Mean sea level around the coast is increasing in all marine regions, with the largest changes in the last 30 years observed at Stornoway, Kinlochbervie and Lerwick. Sea level is expected to increase continually due to global climate change, due to both increases from the melting of land-based ice mass (glaciers, Arctic and Antarctic land ice) and due to the thermal expansion of water.
To quantify regional sea level rise, and inform adaptation to projected changes in mean sea level, it will be critical to continue observations of mean sea level at coastal sites. Research to improve understanding of regional variations of global sea level change, and the physical processes that affect mean sea level and its extremes on shorter time scales (e.g. storm surge), should be continued. There is a need for developing reliable numerical tools that integrate the effects of short-term variability (tidal and storm surge), to provide a coastal flooding early warning system for end users and emergency responders.