Background
Seabirds include those groups of birds that spend most of their life at sea or along the coast. Most have special adaptations for surviving in the marine environment and some only ever come to land to breed. In Scotland, this group of birds includes the petrels and shearwaters (Procellariiformes); gannets and cormorants (Suliformes); skuas, gulls, terns and auks (Charadriiformes) (Figure 1).
Scotland’s seabirds are of international importance (Mitchell et al., 2004). Twenty-four species of seabird regularly breed in Scotland. Of these, Scotland hosts 56% of the world’s breeding population of great skua, 16% of the world’s Manx shearwater and 20% of the world’s northern gannet. Within Europe, Scotland also has 12% of the continent’s northern fulmar, 11% of the black-legged kittiwake and 43% of Europe’s common guillemot. For many other species Scotland holds between 1 and 10% of the European breeding population.
Globally seabirds are considered the most vulnerable group of birds and within the UK 22 breeding species are now on the red or amber lists of Birds of Conservation Concern. Of these, 21 breed in Scotland, and Scotland hosts the bulk of the populations of most of these species. Birds of Conservation Concern 4: the Red List for Birds, published in 2015, is the latest iteration of the multi-agency produced assessment of the status of the UK’s birds.
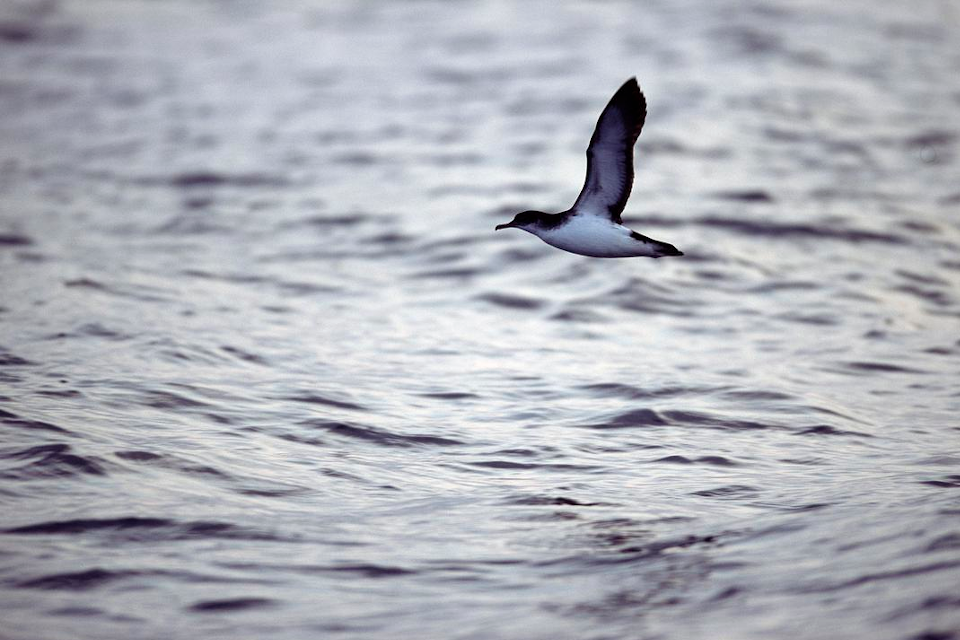
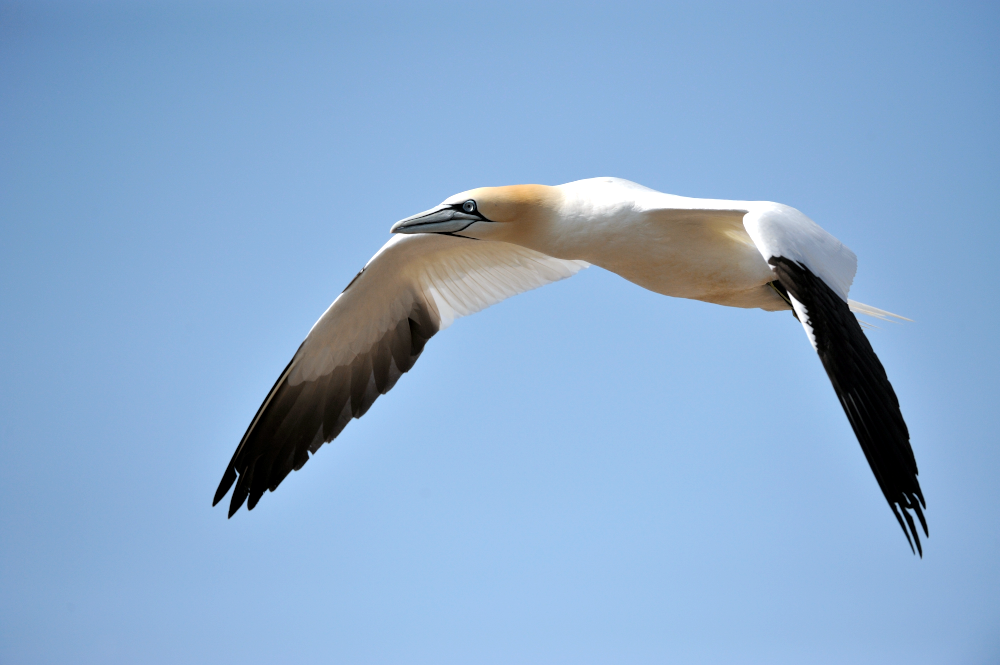
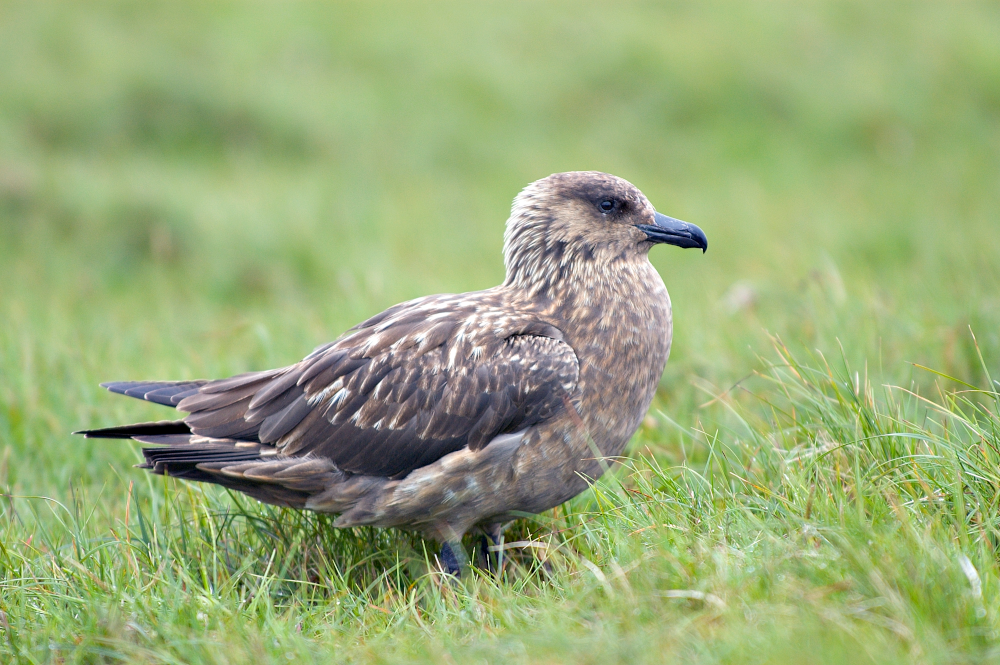

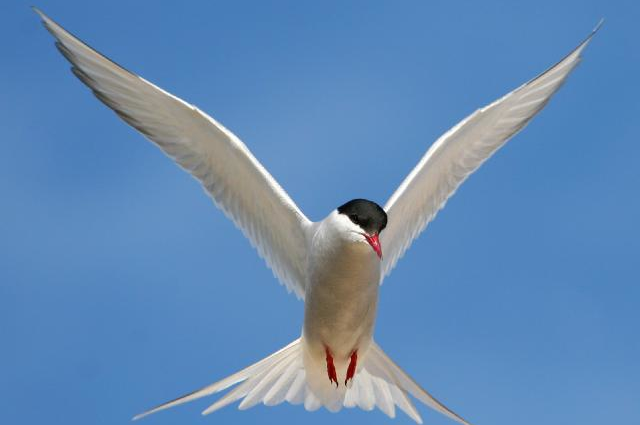
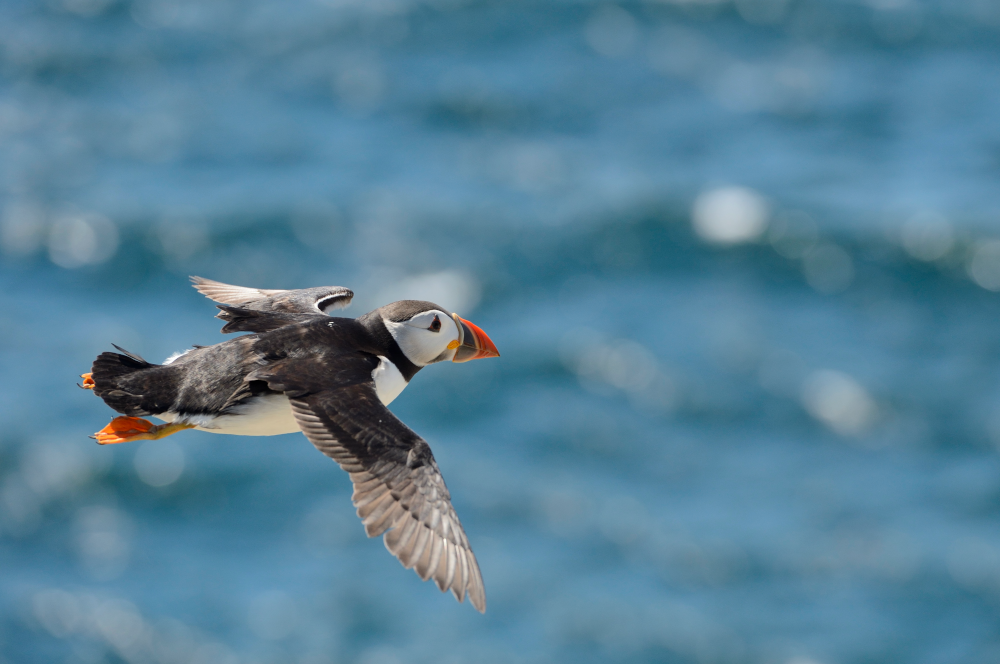


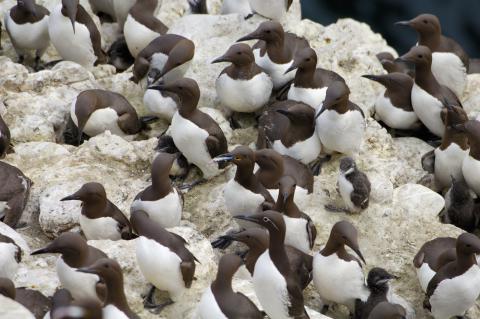
Figure 1: Examples of seabird species found in Scottish seabird colonies. Manx shearwater © Laurie Campbell/NatureScot; Arctic tern © Martina Cross; European storm petrel © Chris Gomersall; European shag © David Pickett; All other images © Lorne Gill/NatureScot.
Breeding numbers and breeding success of seabirds in the UK are monitored through the UK Seabird Monitoring Programme (SMP). The SMP is an ongoing annual monitoring programme, established in 1986 (SMP homepage). Twenty-four seabird species that regularly breed in Scotland (Table a) are monitored as part of this programme. The SMP aims to ensure that data on breeding numbers (defined as the count of breeding adult birds attending colonies, although actual units vary between groups) and breeding success (defined as the number of young fledging per registered breeding attempt per year) of seabirds for a sample of sites are collected each year, both regionally and nationally, to enable their conservation status to be assessed.
The SMP is a partnership project led and coordinated by Joint Nature Conservation Committee (JNCC). There are 19 organisations in the partnership including, in Scotland, NatureScot, the Royal Society for the Protection of Birds (RSPB), the British Trust for Ornithology, the National Trust for Scotland, Scottish Wildlife Trust, Shetland Oil Terminal Environmental Advisory Group, the Centre for Ecology and Hydrology (CEH), and the Seabird Group. Breeding colonies are monitored by professional and volunteer ornithologists who submit their data to JNCC for inclusion in the SMP database.
Data from the SMP are used to produce The Scottish biodiversity indicator S005 ‘The numbers and breeding success of seabirds’. The indicator is based on breeding numbers and/or breeding success for 16 of the 24 species that breed in Scotland. It shows the average trend in breeding numbers for 11 species (Arctic skua; Arctic tern; black guillemot; black-legged kittiwake; common gull; common tern; European shag; great black-backed gull; common guillemot; herring gull; northern fulmar) and breeding success for 12 species of seabird (Arctic skua; Arctic tern; Atlantic puffin; black-legged kittiwake; common tern; great skua; common guillemot; herring gull; little tern; northern fulmar; northern gannet; Sandwich tern).
|
Common name
|
Scientific name
|
|
Northern fulmar*
|
Fulmarus glacialis
|
|
European storm-petrel
|
Hydrobates pelagicus
|
|
Leach’s storm-petrel
|
Oceanodroma leucorhoa
|
|
Arctic skua*
|
Stercorarius arcticus
|
|
Great Skua*
|
Stercorarius skua
|
|
Black-legged kittiwake*
|
Rissa tridactyla
|
|
Black-headed gull
|
Chroicocephalus ridibundus
|
|
Common gull*
|
Larus canus
|
|
Great black-backed gull*
|
Larus marinus
|
|
Lesser black-backed gull
|
Larus fuscus
|
|
Herring gull*
|
Larus argentatus
|
|
Arctic tern*
|
Sterna paradisaea
|
|
Little tern*
|
Sternula albifrons
|
|
Common tern*
|
Sterna hirundo
|
|
Roseate tern
|
Sterna dougallii
|
|
Sandwich tern*
|
Sterna sandvicensis
|
|
Manx shearwater
|
Puffinus puffinus
|
|
Northern gannet*
|
Morus bassanus
|
|
European shag*
|
Phalacrocorax aristotelis
|
|
Great cormorant
|
Phalacrocorax carbo
|
|
Common guillemot*
|
Uria aalge
|
|
Razorbill
|
Alca torda
|
|
Black guillemot*
|
Cepphus grylle
|
|
Atlantic puffin*
|
Fratercula arctica
|
In addition to the annual breeding monitoring surveys at individual colonies a periodic national census is undertaken. The latest (4th Britain and Ireland) census is underway with results due in 2022. The census will allow an accurate picture of change to be assessed across Scotland.
Although seabirds have been counted at individual sites for a long time, the first coordinated census in Scotland was as part of the Great Britain and Ireland census ‘Operation Seafarer’ from 1968 to 1970, the results of which were published in Cramp et al. (1974). Operation Seafarer was organised by the charity ‘The Seabird Group’ which was formed in 1966 to promote the study of seabirds. However, during Operation Seafarer not all Great Britain and Ireland’s breeding seabirds were counted, as it was confined to coastal areas and did not include areas of Shetland and Caithness. There were also issues identified in counting some species, particularly European storm petrel, razorbill, common guillemot, black guillemot and Atlantic puffin. Manx shearwater and European storm petrel were not counted during Operation Seafarer at all.
The second census ran from 1985 to 1988 and was titled the ‘Seabird Colony Register’ (SCR). It was the first census initiated by The Nature Conservancy Council (the predecessor of the JNCC and the various countryside agencies). This included complete coastal coverage and coverage of inland sites for breeding seabirds too. It also included bespoke surveys for species such as black guillemot and employed new standardised techniques. The only species not included in the SCR surveys were Manx shearwater and European storm petrel. It was not until Seabird 2000 that all species were enumerated in the census.
The coverage of the SCR provides the first true, almost comprehensive, picture of UK seabird population numbers and as such, is regarded as the most reliable starting baseline for a figure of breeding seabirds in Britain and Ireland. Whilst 1986 forms the starting date for the index of seabird abundance and breeding success used in this assessment, it is important to also recognise that it does not represent the population status (i.e. what the population should be). Human activities have been having an impact on seabird populations for hundreds of years, both detrimentally and beneficially. This means the baseline populations could be reflecting a recovering, declining or stable population. Seabird populations also fluctuate naturally and at any fixed point in time, including 1986, individual species populations may naturally be high, low or average for the species. The baseline provides a comparison of seabird populations from 1986 until present day but does not confirm how this compares with seabird populations prior to 1986 or the scale of natural variability over time.
The SCR informed the selection of Special Protection Areas (SPAs) for seabirds. SPAs are protected areas for birds designated under European Council Directive 2009/147/EC on the conservation of wild birds, known as the Birds Directive. SPAs protect rare and vulnerable birds (as listed on Annex I of the Birds Directive), and regularly occurring migratory species. Forty-eight breeding seabird colony SPAs and 31 marine extensions for seabirds are classified in Scotland.
Whilst the SMP provides an indication of breeding numbers and breeding success at colonies, Global Positioning System (GPS) and Geolocator technology are now being used to further the understanding of movements of seabirds around the UK and their use of the marine environment (e.g. Magnusdottir et al., 2012; Thaxter et al., 2015; Wakefield et al., 2017).
Comparison with other assessments
The latest OSPAR assessment (that included data up to 2015) measured the breeding abundance of 45% of the marine bird species (which includes seabirds) assessed in the OSPAR Maritime Areas of Celtic Sea and Greater North Sea. The recent abundance index is below the relative abundance assessment level established by OSPAR in 1992, indicating that populations have declined since that baseline was set. The majority of the breeding populations assessed were marine birds that forage offshore, mostly on fish. The species feeding on fish within the water column are faring better than those which generally feed at the surface. This suggests that the availability of small forage fish species at the surface is probably limiting the breeding success of some species. Drivers of food availability are likely to be ecosystem-specific changes, modified by past and present fisheries management, in combination with climate change.
The most recent UK Marine Strategy assessment (2019) against descriptors D1 (Biological Diversity) and D4 (Food Webs) states that ‘Breeding seabirds have not achieved Good Environmental Status’.
Pressures on seabird populations
The seabird declines that commenced toward the end of the last century have continued well into the 21st century and numbers are now below what they were in 2000. Of the pressures acting on seabird populations the main drivers are thought to be climate change, introduction of invasive species and changes in prey abundance and quality.
Climate change
Climate change can influence seabird populations directly and indirectly. Direct effects arise through environmental changes such as occurrence of storm events in breeding and wintering areas causing occasional high mortality of seabirds and, sea-level rise causing breeding failure due to water inundation of low lying nest sites. The intensity and potential frequency of such events is likely to increase under climate change.
Indirect impacts are associated largely with a reduction in prey abundance, distribution and quality. The principal mechanism is the effect of climate warming ofnsea surface temperatures (SSTs) and the consequences for seabird prey. As a result, seabird abundance and distribution are predicted to change (Daunt & Mitchell, 2013). Scottish seabird species that are at the southern extent of their range (e.g. Arctic skua) are predicted to be lost as breeding species in Scotland, whereas seabird species with a breeding stronghold in England are predicted to shift north.
At an ecosystem scale, climate change will affect functional dynamics of intertidal and subtidal habitats, offshore shelves, seamounts, and currents, through changes in eutrophication, invasive species, species range shifts, fish stocks, and habitat loss (Kovats et al., 2014). All of these are likely to have an indirect effect on seabird populations.
Prey abundance and quality
Prey abundance and quality is also influenced by competition with fisheries and with other predators. Seabirds are indirectly sensitive to activities that remove prey species and/or reduce foraging success rates. If food is scarce this can result in poor adult fitness and ultimately threaten adult survival. During the chick rearing period, adults have to forage further away from the colony and for longer periods increasing the energetic demands on adult fitness and reducing the likelihood of breeding success. Lack of preferred prey can also lead to seabirds taking poorer quality prey.
In Scotland, there is some evidence to show that management of east coast sandeel fishery significantly altered sandeel abundance and productivity of sandeel-specialising seabirds (Daunt et al., 2008), although a longer term study (Wanless et al., 2018) detected no impact of open and closed periods of the fishery on the proportion of sandeel in the diet of a range of seabirds at the Isle of May. Greenstreet et al. (2010) showed that sandeel populations increased early in a closed fishery period, then subsequently declined, and use of the area by seabirds consequently also declined. Competition between seabirds and fisheries has been shown elsewhere (including competition between marine mammals, birds and fisheries e.g. Bogstad et al., 2015; Hansson et al., 2017).
Some seabird species have benefited from fisheries in the past. The discarding of undersized fish at sea enhanced numbers of scavenging seabirds such as northern fulmar and great skua. Analysis of discard fish available in the North Sea (Sherley et al., 2019) reports that the amount of discards in the area declined by 48% between 1990 and 2010, with a consequent decline in the number of scavenging seabirds that could be supported. This study pre-dates the introduction of measures to conserve fish stocks and reduce discards which would be expected to further reduce discard availability to scavenging seabirds.
The pressures exerted by fishery activities are not well understood. There are some direct impacts such as mortality through bycatch (Fangel et al., 2015; Martin & Crawford, 2015; Zyedelis et al., 2013) but past and present fishery management also is likely to influence, in combination with climate change, the availability of forage fish (small schooling fish that feed on plankton) which is probably limiting breeding success in some species (OSPAR 2018).
Introduction of invasive species
The introduction of mammalian predators to places where they would not naturally occur has had devastating impacts on seabird populations around the world (Dias et al., 2019). Of the non-native predatory mammals introduced to Scotland, brown rats, cats and American mink present a serious risk to seabird colonies (Stanbury et al., 2017). Native mammals such as hedgehog, stoat and fox are also a threat where they have been introduced by humans to offshore islands. This is evidenced by the fact that European and Leach’s storm-petrels are only found breeding on islands that are free of rats (Mitchell et al., 2004; Mitchell & Newton, 2004). In Orkney and Shetland, black guillemots nest in crevices high off the ground and on cliffs that are inaccessible to the rats and stoats. On islands without predatory mammals they use nest sites on boulder beaches (Ewins & Tasker, 1985). These invasive species target breeding colonies on land, preying on breeding adults and young or eggs often causing whole colonies to fail.
Other pressures
Bycatch, collision and displacement, and marine pollution (oil, non-synthetic compounds, synthetic compounds and marine litter) also have a negative impact on the numbers and breeding success of seabirds.
Bycatch: Seabirds can be unintentionally caught and killed in fishing gear (bycatch). Gillnets and longlines are considered the biggest risk to seabirds (Pott & Winfield, 2017; ICES, 2013). Numbers of birds accounted for by this pressure are largely unknown (although see Bradbury et al., 2017 and Northridge et al., 2020). Direct mortality from seabird by-catch has been the subject of recent Defra studies looking at existing data to help assess the risk to marine birds in UK waters of being caught and killed by commercial fishing gear. It aims to identify UK sea areas with a high risk to marine bird populations due to mortality caused by bycatch. The results are expected to be published soon. Methods to mitigate by-catch and an assessment of areas at greatest risk of by-catch are included in aspects of the study. This updates earlier work published by Defra (Seabird Bycatch Project - MB0126). In Scottish marine waters, the use of set nets (gillnets) is localised, predominantly in north of Scotland, west of Scotland and patchily east of Scotland. Long-lining occurs along the shelf edge off west Scotland and Northern Isles and pelagic fisheries are widespread throughout offshore waters.
Collision, displacement and barrier effects: Migrating, commuting and feeding seabirds, particularly large gulls, black-legged kittiwake, northern gannet, great cormorant and European shag, are at risk of mortality and injury through collision with offshore windfarms (Furness et al., 2013). Diving seabirds such as auks and European shag could potentially be killed by collision with tidal stream turbines below the surface (Furness et al., 2012). Marine energy developments can also cause displacement and/or barrier effects to seabirds, preventing feeding or access in favoured areas and/or increasing the distance required to get to foraging areas as birds fly around rather than through the windfarm. Displacement and barrier effects can potentially cause additional energetic demands on birds and ultimately threaten adult survival.
Marine pollution: Seabirds are sensitive to wide range of marine pollutants including oil, non-synthetic compounds (heavy metals), synthetic compounds (pesticides, polychlorinated biphenyls (PCBs), dioxins) and litter. Contaminants can act directly through mortality or by sub-lethal impacts. Many of these will act locally and will have a cumulative depressive effect on seabird numbers. Oil pollution has been identified as a source of seabird mortality for a long time effecting them through fouling of their plumage and/or ingestion. Accidental oil spillage can cause mass mortalities in particular if occurring during the breeding season near colonies. The impacts however tend to be short-term and localised. Oil, in addition to synthetic compounds, non-synthetic compounds and litter (plastic) also acts through sub-lethal but chronic impacts likely to reduce fitness and mean that seabirds are more vulnerable to other pressures (Puskic et al., 2019; Kuhn & Franeker 2012; Wilcox et al., 2015). Once in the marine environment these substances enter the food web via filter feeders such as molluscs, progressively accumulating up the food web to top predators such as seabirds. Marine litter can effect seabirds through ingestion and entanglement. Plastic ingestion occurs in a range of Scottish seabirds (O’Hanlon et al., 2017) and can be potentially harmful (Laist, 1997). Fishing line, nets and other items present an entanglement risk particularly to diving seabirds.
The indicator has been updated with data from 1986 up to and including the 2018 season. At the Scotland scale trends for breeding numbers are based on 11 species (Arctic skua; Arctic tern; black guillemot; black-legged kittiwake; common gull; common tern; European shag; great black-backed gull; common guillemot; herring gull; northern fulmar) and the breeding success trend on the 12 species (Arctic skua; Arctic tern; Atlantic puffin; black-legged kittiwake; common tern; great skua; common guillemot; herring gull; little tern; northern fulmar; northern gannet; Sandwich tern) for which sufficient data are available (Table a).
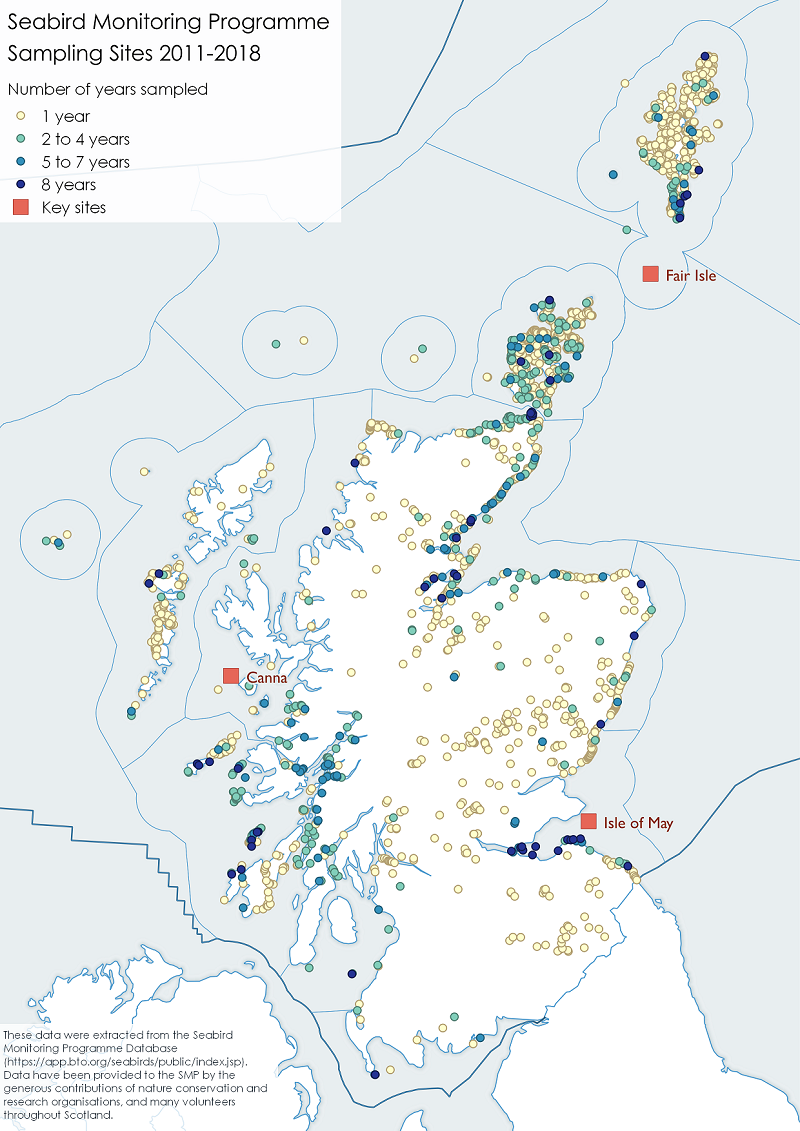
Data are derived from the UK Seabird Monitoring Programme (SMP). The SMP collects and collates data on breeding numbers, demographic parameters (including breeding success and survival rate of adults), and diet from a sample of colonies around the UK. The SMP annual sample includes both sites that are counted on an annual basis and those counted more infrequently, with a requirement that at least three data points have been collected per site/colony across the time series, for them to be used in the analysis (Figure a).
Data are initially quality assured by the observers and then checked by JNCC on entry into the SMP. This check will identify obvious errors in the data. There is no mechanism to check entries against independent counts, although unexpected changes in numbers of birds recorded can be flagged.
The annual abundance and breeding success of each species is expressed as a proportion of the abundance in the year (1986) that the baseline was established. The index is a geometric mean of the annual proportions across species. The geometric mean is an average calculated by multiplying the set of species index values and taking the nth root, where n is the number of index values. The population index is scaled to 100 for each contributing species from the start of the period, the de facto baseline (1986), but the exact species included in the index varies with availability of data. Values are interpolated for those colonies not counted in any one year. In 2018 sufficiently wide coverage of breeding number counts was available for 11 species. The method for producing the annual species-specific trends are documented in Walsh et al. (1995). Updates from monitored sites are provided annually and the data are publicly available from JNCC.
At four key sites for the SMP, three of which are in Scotland (Isle of May, Fair Isle and Canna (Figure a)) long runs of data including population counts and annual productivity estimates are available. These data are used in the seabird index but can be investigated individually. Only a few other sites record data that go beyond basic population counts (primarily National Nature Reserves (NNR) and RSPB reserves). Note that breeding success is measured at each colony as the average number of chicks fledged per breeding pair in Scotland, with different models applied to species that lay a single egg (e.g. razorbill, northern gannet) and those that lay clutches of multiple eggs (e.g. European shag, black guillemot).
A periodic national census is undertaken, the latest census is due to be completed in 2021, with results expected to be available in 2022. The national census results are vital to providing a complete and accurate snapshot of seabird breeding numbers and help improve the confidence in the annual trend information from monitored sites. The current data confidence has been reduced to medium as it is over 15 years since the last national census. The review period (2011 to 2017) at 7 years is shorter than generation times for most seabirds, which are in general, long-lived animals. For example, northern gannet generation time is 15 years and black-legged kittiwake 11 years.
Confidence in indicator assessment
Level of agreement on the data regarding seabird numbers and breeding success data used for the indicator is high, although the number of species and sites from which such data are regularly collected is not large. Some of the SMP sample sites, particularly in the Outer Hebrides (Lewis and Harris) and south-west Scotland were only surveyed once during the 2011 - 2018 period. However, most of the larger colonies (SPAs) were surveyed between five and eight times during this period, with all regions having at least one site surveyed each year, the exceptions to this being some of the more remote islands, skerries and stacks (Figure a).
Whilst the confidence in the data for seabird numbers and breeding success is high, it is more than 15 years since the last complete national census of seabirds. The confidence in total population estimates has therefore been reduced to medium.
It should also be noted that the relatively short period of the current assessment does not coincide with the generation length of most seabirds. Most seabirds are long-lived and do not breed within their first two years (e.g. average mean age to recruitment for black-legged kittiwake is four years, northern fulmar nine years, razorbill five years and common guillemot six years (Horswill & Robinson, 2015)) and so, true population trends are less likely to be apparent over a short timescale. The index shows to some extent the variability year to year but it is important to see the current assessment in terms of the longer-term trends for individual species and for the seabird group as a whole.
Regional assessments
Trends are not currently available for Scottish Marine Regions. Through the SMP only a few sites are monitored intensively annually and more of these would be required for robust regional assessments. Similarly, raw numbers expressed at regional level are incomplete and not comparable across the time period. Comparison is only likely to be possible between full census periods. Consequently, at present it is not possible to construct robust regional indices, although some regional differences are known.
Results
The trend for most species since 2011 (date of Scotland’s Marine Atlas (Baxter et al., 2011)) has been relatively stable with many of the regularly monitored species at higher levels in most years (Table 1).
|
Species
|
2011
|
2012
|
2013
|
2014
|
2015
|
2016
|
2017
|
2018
|
|
Arctic skua
|
100
|
82
|
69
|
78
|
94
|
89
|
69
|
79
|
|
Arctic tern
|
100
|
178
|
218
|
268
|
227
|
179
|
254
|
162
|
|
Black guillemot
|
100
|
109
|
115
|
144
|
107
|
128
|
117
|
254
|
|
Black-legged kittiwake
|
100
|
94
|
71
|
85
|
95
|
91
|
112
|
91
|
|
Common guillemot
|
100
|
104
|
102
|
111
|
121
|
127
|
133
|
133
|
|
Common gull
|
100
|
102
|
104
|
100
|
92
|
81
|
103
|
83
|
|
Common tern
|
100
|
111
|
150
|
144
|
110
|
174
|
181
|
178
|
|
European shag
|
100
|
113
|
90
|
84
|
93
|
95
|
107
|
104
|
|
Great black-backed gull
|
100
|
82
|
103
|
116
|
110
|
124
|
88
|
66
|
|
Herring gull (natural-nesting)
|
100
|
164
|
132
|
178
|
101
|
168
|
114
|
150
|
|
Northern fulmar
|
100
|
83
|
80
|
88
|
74
|
107
|
81
|
69
|
There are notable increases over the 2011 to 2018 period for terns (both common and Arctic terns show significant increase in numbers), black guillemot and northern gannet, which has been increasing for some time. The 2018 index value for black guillemot is unexpectedly high and is the first time since monitoring started that the species has produced a value above the long-term baseline. Common guillemot shows a steady increasing trend, which has seen it almost regain the levels at the start of the index period. For common tern this increase has been sufficient for it to return to numbers above the 1986 baseline, but for Arctic tern, which is a much more common and widespread species in Scotland, the recent increase still leaves numbers below those found in 1986. Arctic skua, black-legged kittiwake, common gull, great black-backed gull and northern fulmar all show declines over the period.
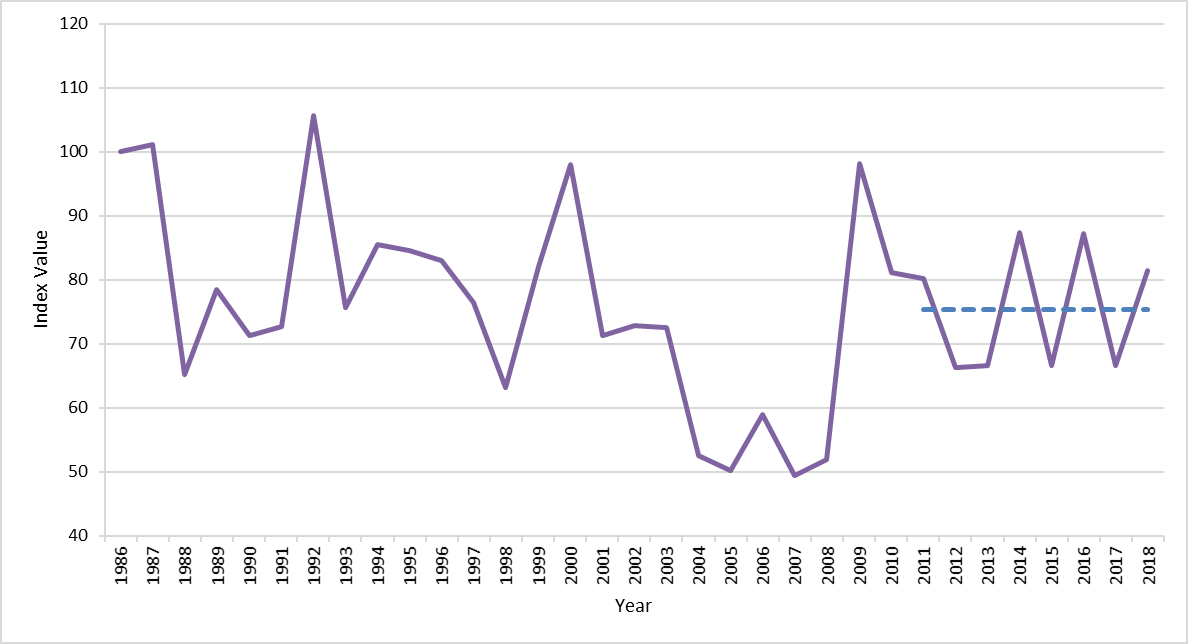
Productivity is more variable. Since 2011 the productivity index has varied between 66 and 87% of the 1986 baseline, with the long-term average over the period 1986 to 2016 being around 76% of the 1986 baseline. Breeding success across the time series varied for the 12 species assessed (Table 2). In 2017, breeding success was above the long-term average for black-legged kittiwake and herring gull. Arctic skua, Atlantic puffin, common tern, great skua, little tern and northern fulmar had lower breeding success. Breeding success of all other species was around the long-term average.
|
|
Change in number since 1986 (baseline year) (%)
|
Change in number 2011 to 2018 (%)
|
Breeding success (young/pair) (average 1986 to 2016)
|
Breeding success (young/pair) (2018)
|
|
Arctic skua
|
-80
|
-5
|
0.32
|
0.233
|
|
Arctic tern
|
-49
|
+20
|
0.11
|
0.19
|
| Atlantic puffin | 0.55 | 0.74 | ||
|
Black guillemot
|
+34
|
+80
|
|
|
| Black-legged kittiwake | -69 | -3 | 0.56 | 0.57 |
| Common guillemot |
-2
|
+24
|
0.57 | 0.67 |
|
Common gull
|
-39
|
-12
|
|
|
|
Common tern
|
+20
|
+52
|
0.47
|
0.56
|
|
European shag
|
-43
|
+2
|
|
|
|
Great black-backed gull
|
-69
|
-15
|
|
|
|
Great skua
|
|
|
0.51
|
0.34
|
|
Herring gull (natural-nesting)
|
-42
|
+19
|
0.58
|
0.93
|
|
Little tern
|
|
0.29
|
0.42
|
|
|
Northern fulmar
|
-43
|
-25
|
0.46
|
0.41
|
|
Northern gannet
|
|
|
0.69
|
0.73
|
|
Sandwich tern
|
|
|
0.25
|
0.39
|
Looking over the time series from 1986 to the most recent estimate in 2018:
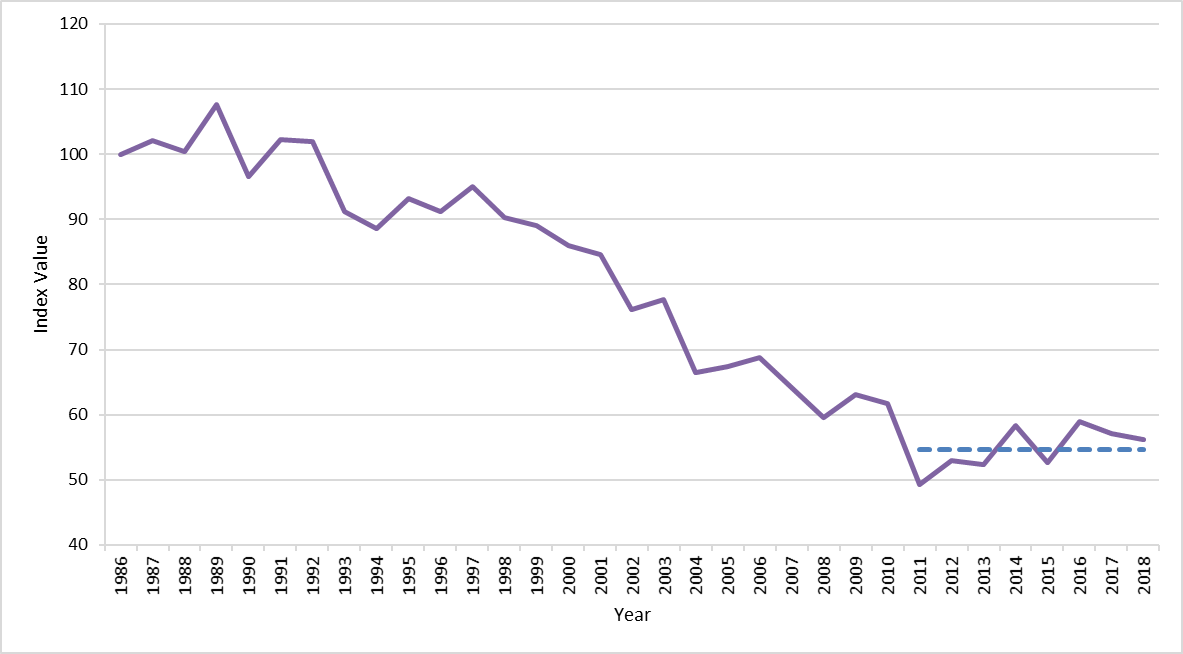
- since 2011 the index of number of breeding seabirds (Figure 2) has remained stable following a previous period of sustained decline. By 2018, breeding numbers were 56% of the 1986 level. The long period of decline for the 11 species included in the index occurred between 1990 and 2011
- since 2011 the index of breeding success (Figure 3) has fluctuated but the average value is close to the long-term average from 1986 to 2018. From 1990 to 2000 breeding success was generally above the long-term average, and between 2000 and 2010 mostly below the average. Data from 12 species are included in the breeding success index.
- as the breeding success index is based on the relative value compared to the 1986 baseline, it does not necessarily follow that values above average reflect a level of breeding success that will lead to an increase in the number of seabirds.
The individual species’ trends show different patterns, with some seabirds such as black-legged kittiwake and Arctic skua showing large declines, whereas northern gannet has shown large increases. This is consistent with results from OSPAR which showed declines were largely for species that are surface feeding (e.g. black-legged kittiwake in both North Sea and Arctic Sea regions) or reliant upon surface feeders (Arctic skua).
Across Scotland some seabird colonies have seen large declines, particularly in the Northern Isles where black-legged kittiwake and Arctic skua populations have been greatly reduced.
However, a few Scottish colonies have recorded increases, northern gannet is strongly increasing at most of its Scottish colonies. Between 2000 and 2014 northern gannet numbers at St Kilda, Sule Stack and Scar Rocks were stable, but all other colonies had increased, some spectacularly. Numbers of razorbill had been steadily increasing since the SCR survey, although there was decline in the early 2000s. Since 2009 the overall increase in numbers has resumed.
Some species trends appear to be stabilising at a new level which differs from the 1986 baseline used in this indicator. Foster et al. (2017) showed a link between declining fishery landings and gull numbers which led to steep declines, followed by a stabilisation of numbers on the Isle of Canna. However, when compared with information from the 1930s, the lower numbers of gulls found recently appear to be more typical than the peaks observed in the mid-1980s.
Since 2011 both number of seabirds and breeding success of seabirds have shown no strong trend overall, despite annual fluctuations. Since 2011 the breeding numbers index has fluctuated between 59 (in 2016) and 49 (in 2011), remaining considerably below the baseline value of 100 over the whole period.
Arctic skua
Out of the 11 species assessed in 2018 for breeding numbers, Arctic skua had experienced the largest declines reaching an 80% decline in 2018 compared to 1986 level. Since 2013 there has been little overall change but between 2011 and 2018 Arctic skua numbers have declined by 5% (Figure b).
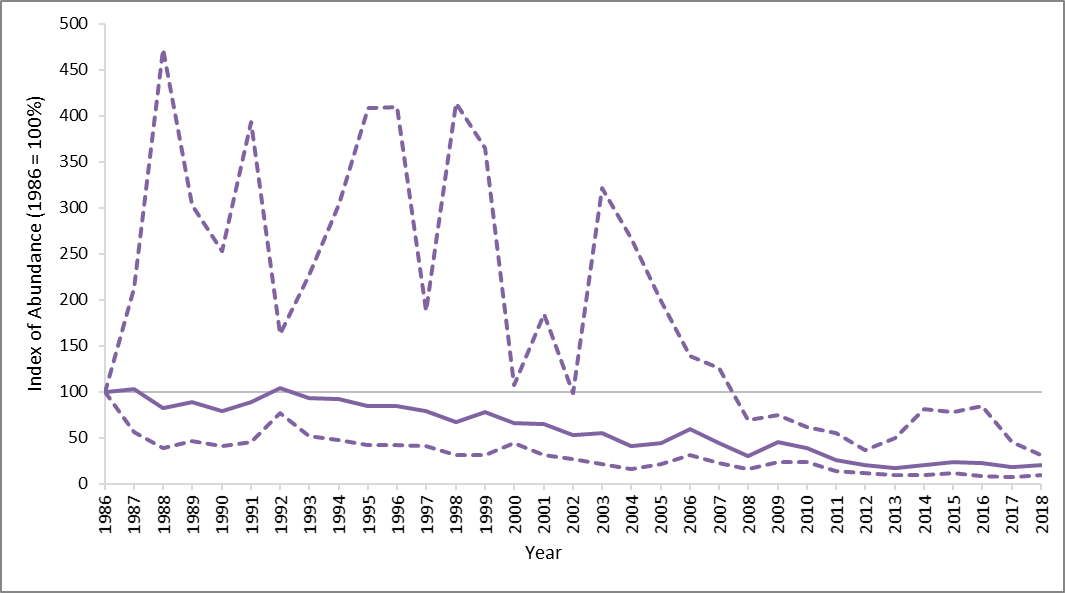
The decline is driven by consistently low productivity of Arctic skua (Figure c), affected by top down and bottom-up pressures of predation and low prey availability (Meek et al., 2011; Perkins et al., 2018).
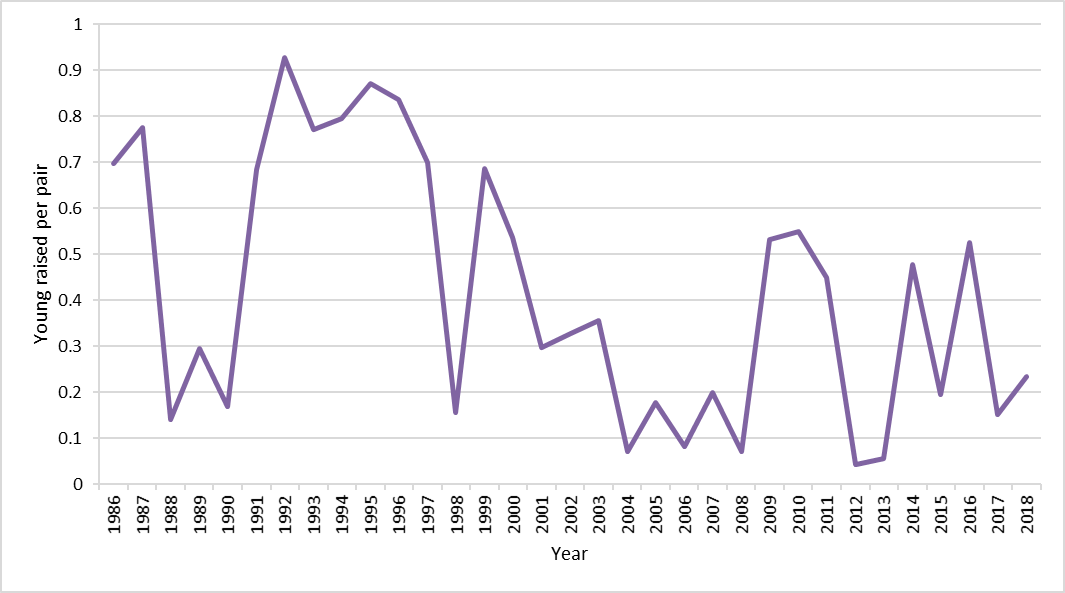
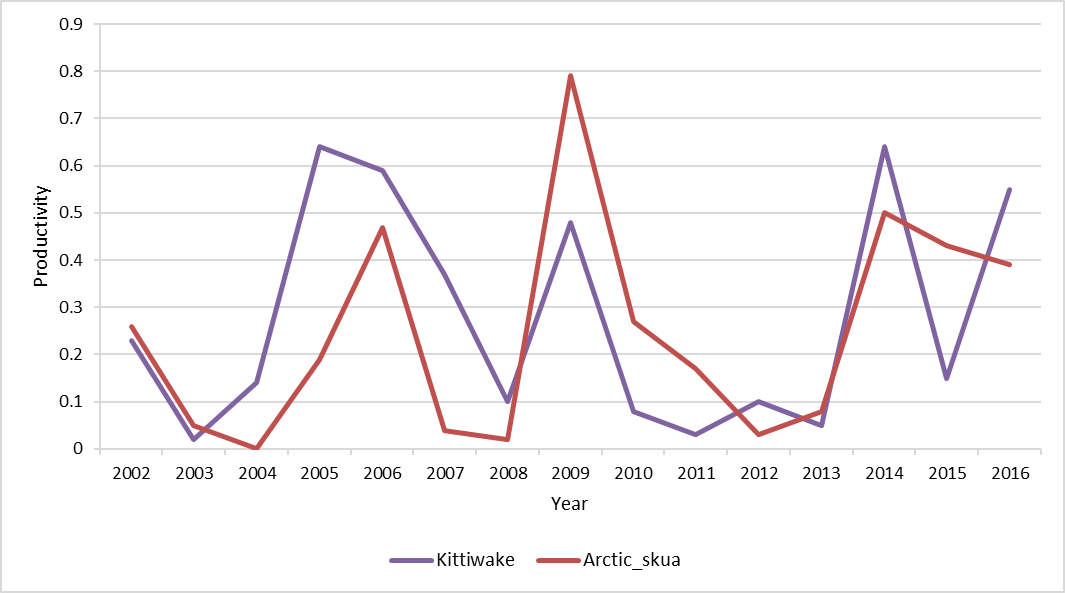
The Northern Isles are the breeding stronghold for Arctic skua in Scotland and changes to the availability of sandeels, which they obtain from other seabirds by chasing to make them release their food, has led to declines. Similar patterns of declines have also occurred for the species they parasitise, particularly black-legged kittwakes (Figure d) and terns (Figures e and f).
Common tern
The number of breeding common terns increased in 2016 (Figure e) and has been maintained since. As with many colonial nesting tern species they can respond to favourable breeding conditions rapidly, resulting in higher numbers at breeding colonies in some years.
Arctic tern
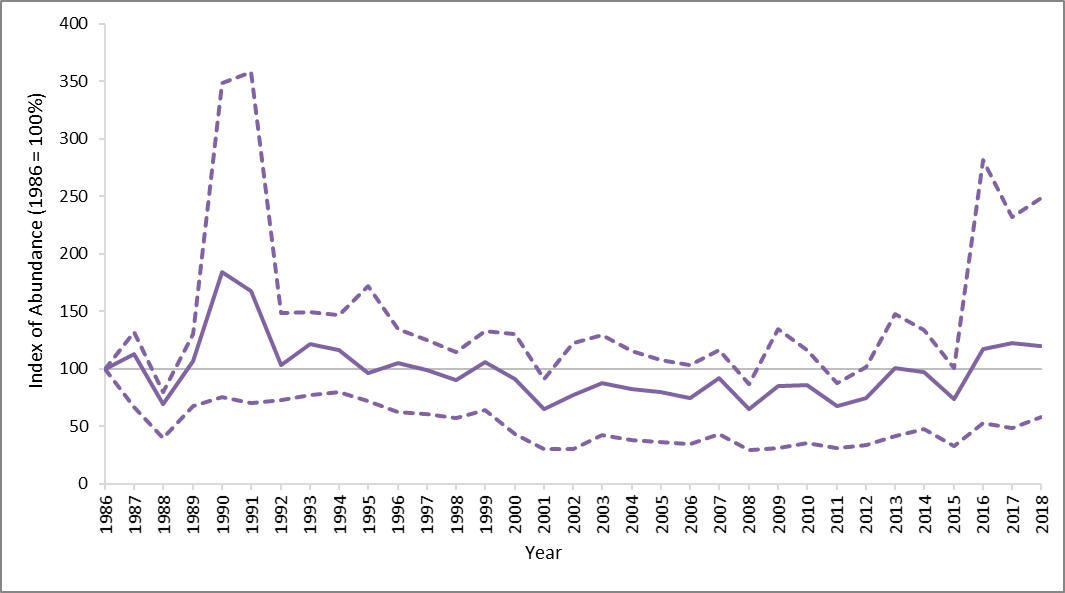
The numbers of breeding Arctic tern were at their lowest point in 2011 (Figure f). A gradual increase in numbers is shown through to 2014 with some fluctuation in numbers from 2014 to 2018.

Currently there is limited information for detailing changes at the scale of Scotland’s seas. The results of the 4th national census, when available in 2022, will enable changes in population size between the 3rd census ‘Seabird 2000’ and the current period to be assessed. However, regular monitoring at individual sites can provide valuable information between census periods, with the understanding that it is a sample of the overall population only. Furthermore results from tracking work such as the Future of the Atlantic Marine Environment fameproject.eu (FAME) and Seabird Tracking and Research (STAR) seabird tracking projects, and work planned in conjunction with offshore renewable development is helping to provide details of the distribution of breeding seabirds when at sea around Scotland.
Regionally there are differences in the population and productivity trends shown by some species, although the general pattern of long-term declines since the mid-1980s, with some recovery or slowing of decline since 2011 is true for most. See more information by Scottish Marine Region in the sections below.
Forth and Tay Scottish Marine Region
The Isle of May is a SMP key site and CEH produces annual breeding season summaries. Figures of breeding success below have been taken from Newell et al. (2016), and figures of breeding numbers from Outram et al. (2018).
The 2016 breeding season on the Isle of May was mixed following the generally successful seasons of 2014 and 2015. Breeding in 2016 commenced early for European shags but late for black-legged kittiwakes and Atlantic puffins.
Of the six study species, European shags had their most successful season on record, while black-legged kittiwakes and northern fulmars were above average. Atlantic puffins had an average season while common guillemots had a below average breeding season. Razorbills had their worst season on record. Return rates were above the long-term average in all study species except Atlantic puffins, which was very low. Sandeels (Ammodytes spp.) remained the main food of young razorbill, Atlantic puffins, European shags and black-legged kittiwakes. The diet of common guillemots was dominated by clupeids. The main results were:
Northern fulmar
Breeding succes in 2016 (0.43 chicks per incubating pair) was above average (Figure g). In 2015 the success was 0.52 chicks per pair. In 2017 it was 0.40 chicks per pair – close to the long-term average.
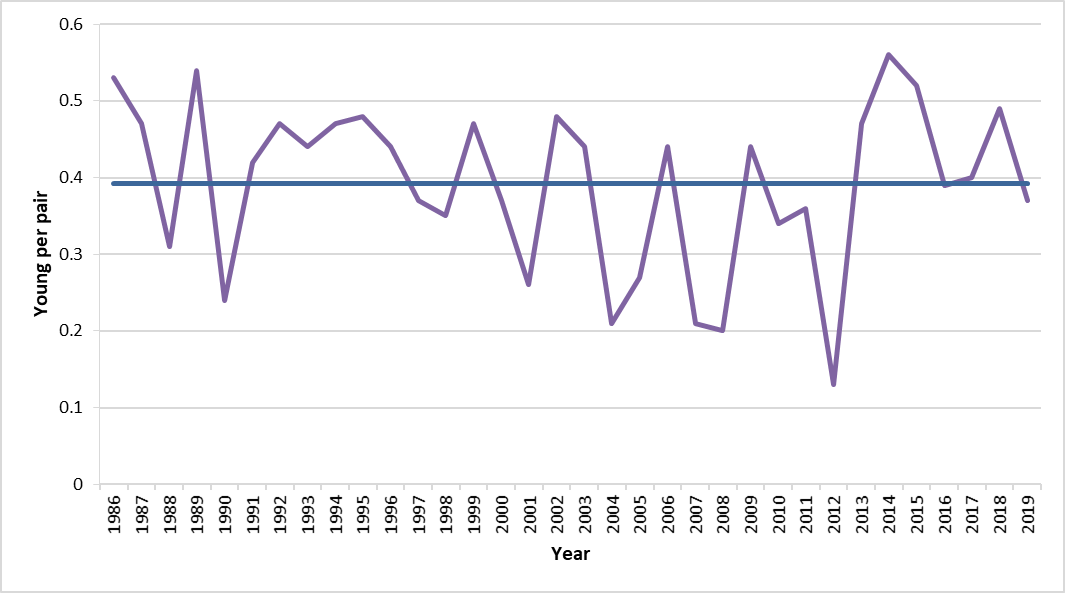
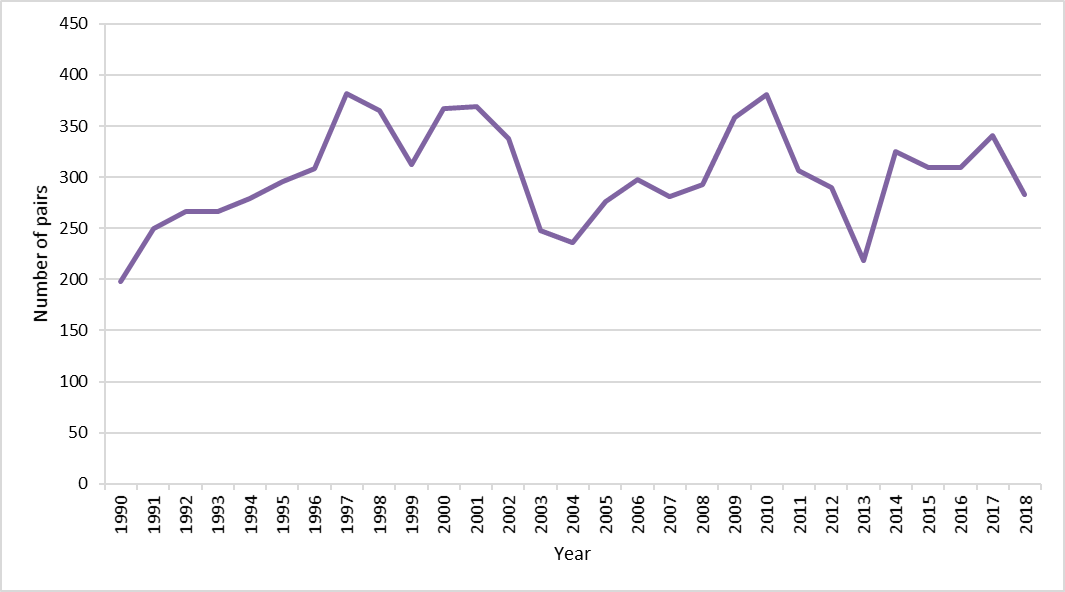
Northern fulmar numbers have been relatively stable for a long period, although since 2011 numbers have been below the peaks of 381 recorded in 2010 and 382 in 1997 (Figure h). The average number from 2011 to 2017 was 300 apparently occupied sites (AOS). Breeding success from 2011 to 2017 has been generally above the long-term average.
European shag
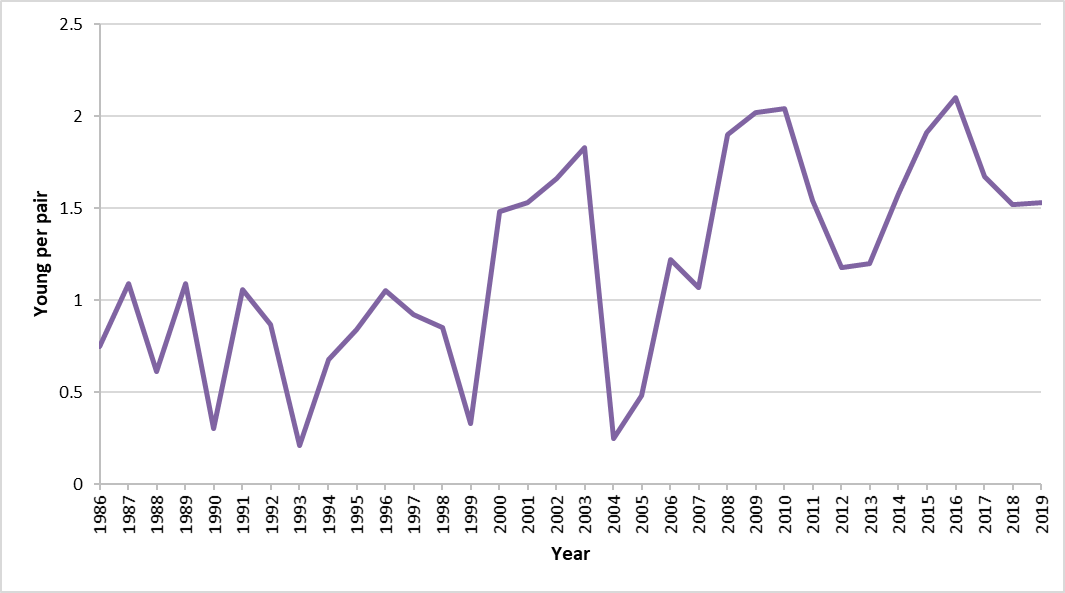
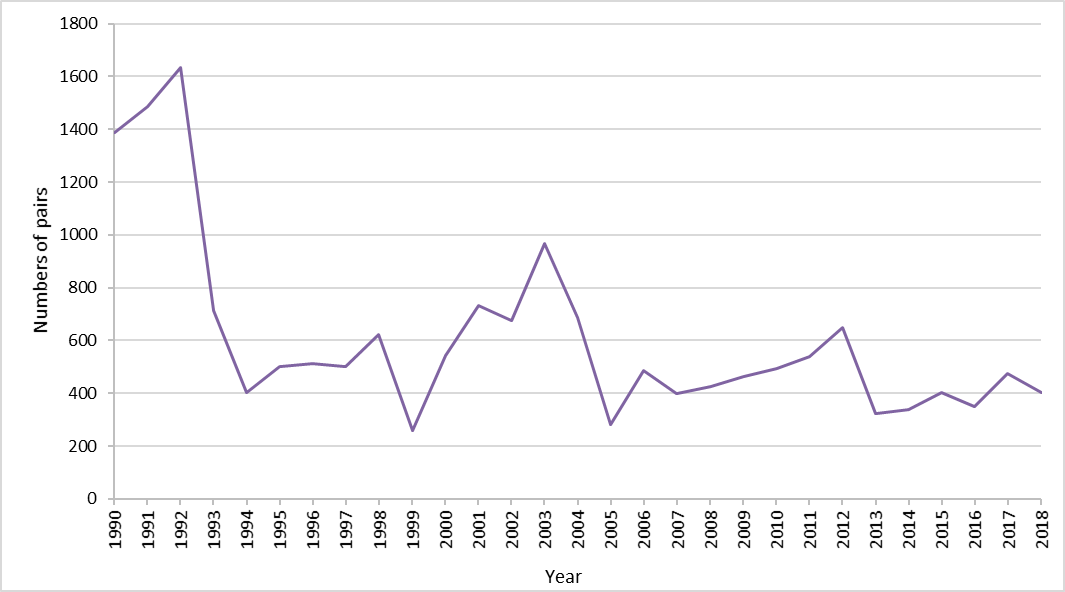
These had the most successful season on record in 2016 (2.1 chicks per pair). Breeding success has been high for the last decade (Figure i). The number of breeding birds remains relatively stable (474 apparently occupied nests (AON) in 2017) and well below peaks recorded in 2003 (968 AON) and 1992 (1,634 AON) (Figure j). Return rate was above average at 88.9%. Diet was dominated by sandeels which occurred in 73.5% of samples.
Black-legged kittiwake
Black-legged kittiwakes had their most productive season since 1987 in 2014 with productivity of 1.17 chicks per completed nest. This was well above average for the whole period 1986 to 2019 which is 0.61 chicks per nest. Since 2011 average productivity has been 0.86 chicks per nest. The breeding success has been variable but generally high from 2011 to 2019 (Figure k).
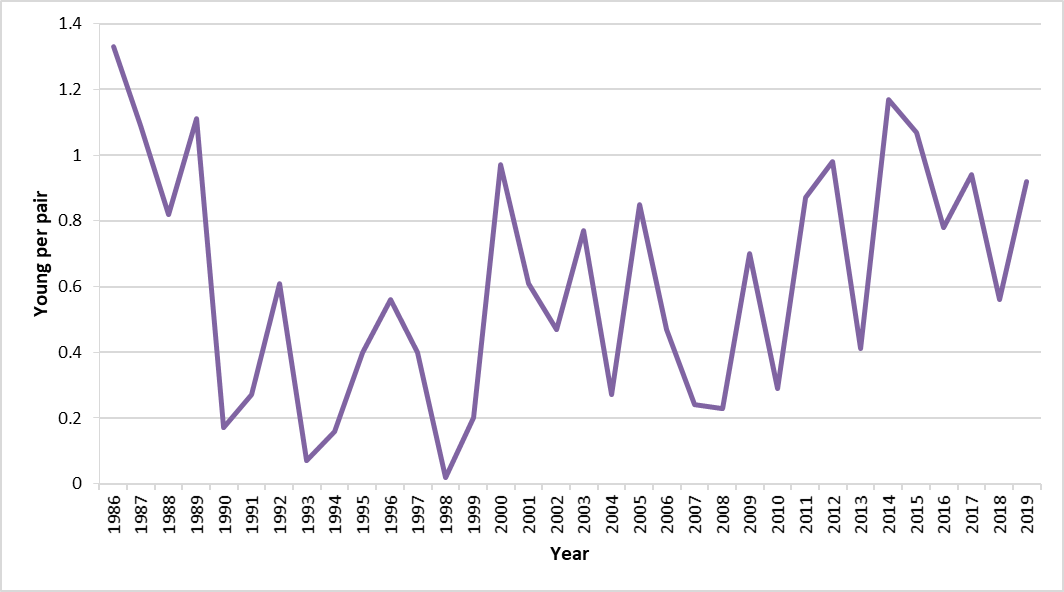
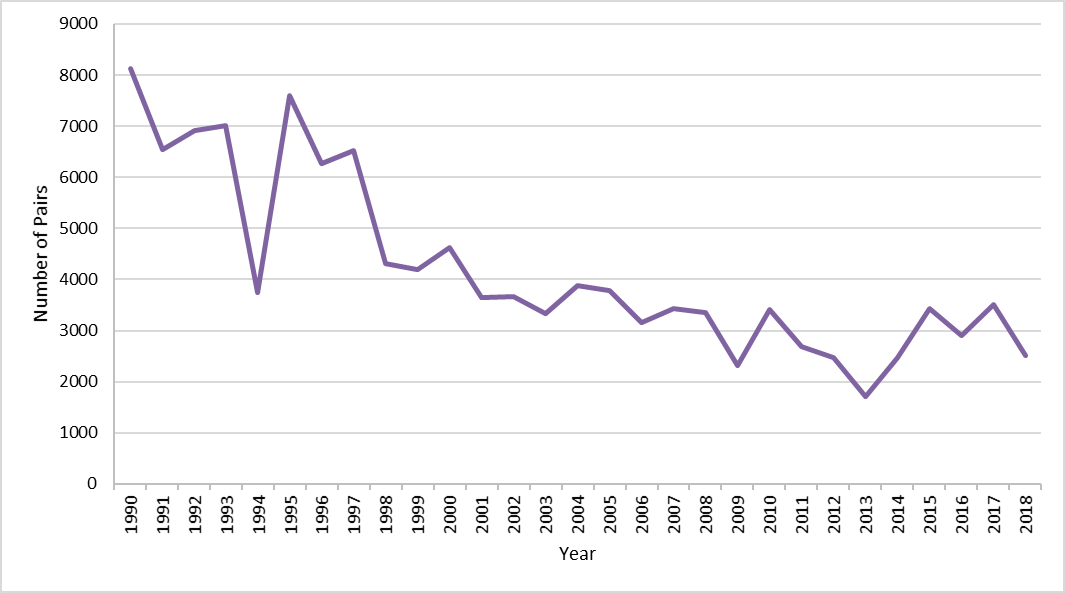
The number of pairs of black-legged kittiwake nesting has been overall stable or shown a slight increase from 2011 to 2017 (Figure l), however, the population size is less than 50% of that recorded in the early 1990s.
Common guillemot
Common guillemots had a relatively poor breeding season in 2016 (0.66 chicks leaving per pair laying) although breeding success from 2011 to 2019 has been just above average compared to the 1986 to 2010 mean (0.72 cf. 0.71) (Figure m).
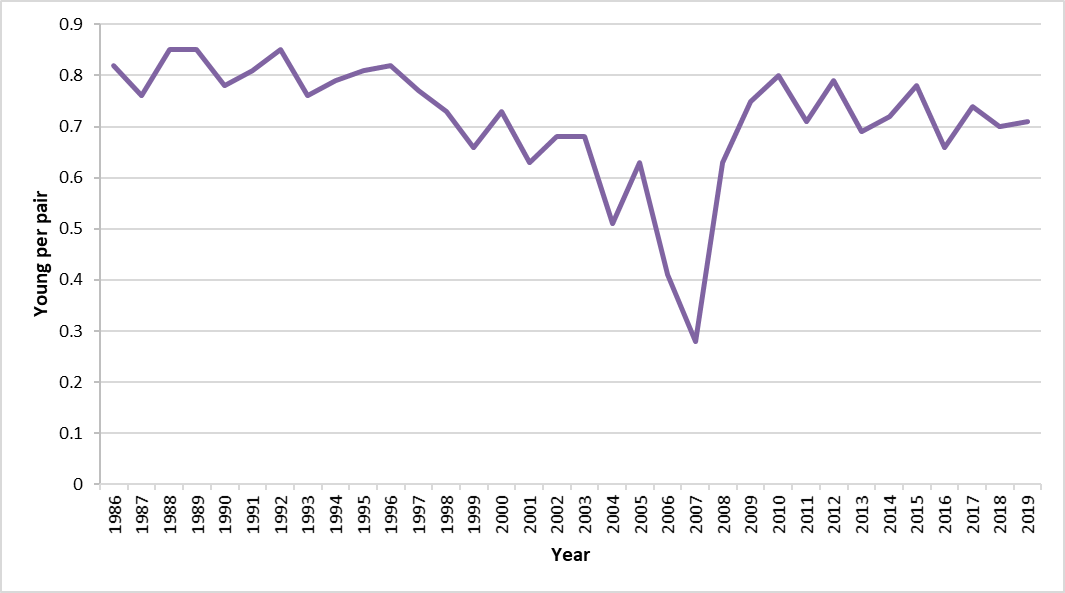
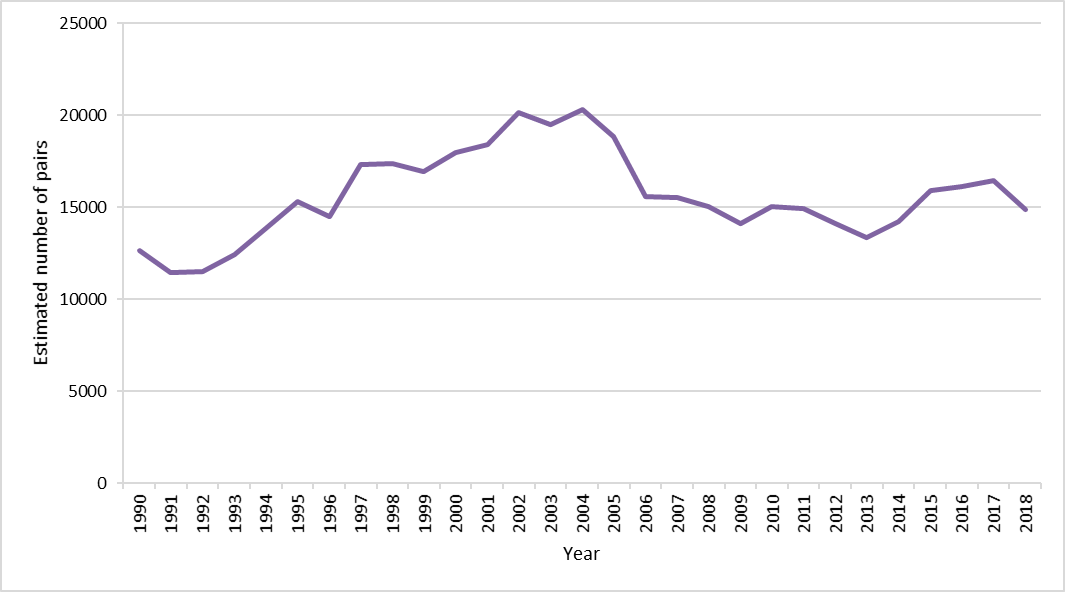
Apart from a distinct dip in breeding success between 2004 and 2008 common guillemot breeding success has shown a very shallow decline over the period since 1986. Both post and prior to 2011 average breeding success was 0.72 chicks per pair, but from 1986 to 2004 average breeding success was 0.75 chicks per pair, although declining over the period. The slightly higher average breeding success from 1986 to 2004 is reflected in the increase in estimated population size between 1990 and 2004 (Figure n), Since 2004 there has been some reduction in the population size, but the number of common guillemot in 2018 is still slightly higher than it was in 1990.
Razorbill
Razorbill breeding success in 2016 (0.45 chicks leaving per pair) was the lowest on record but adult return rate (87.5%) was above average (Figure o). Chick diet contained more sandeels (58% of loads) than clupeids (42%).
Atlantic puffin
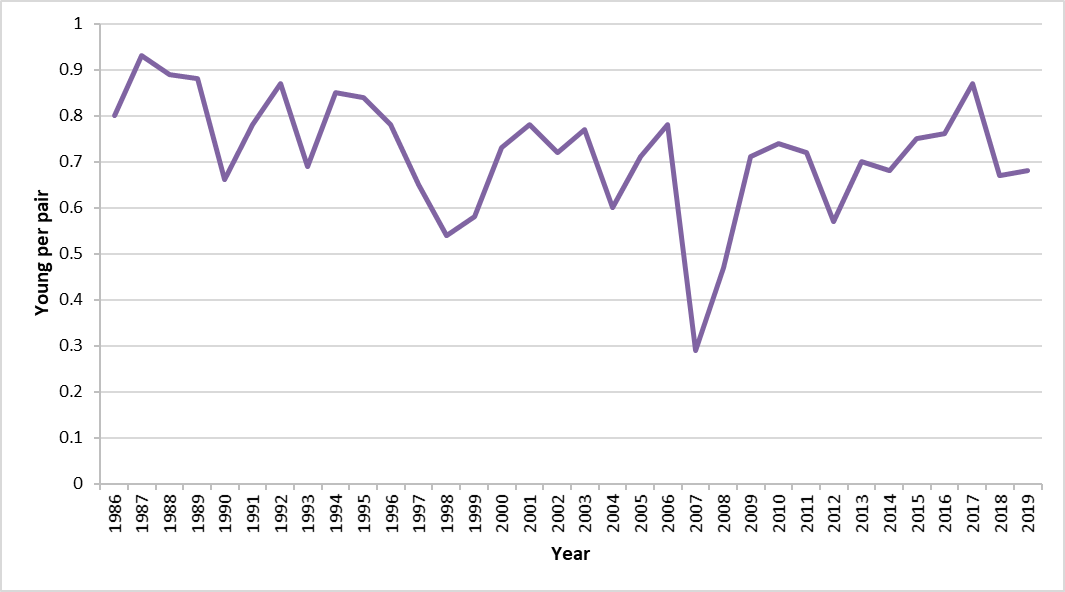
Atlantic puffins had an average season in 2016 with 0.76 chicks fledging per pair laying (Figure p). There appears to be a long-term, slight decline in breeding success since the late 1980s, but little sign of change since 2011. Average breeding success prior to 2011 and since 2010 is hardly different (0.72 young per pair compared to 0.715 young per pair). Diet studies in 2016 showed that chicks were fed mainly sandeels (88.7% by number) with Clupeidae (mainly sprats) and rockling contributing 3.5% and 1.9% respectively.
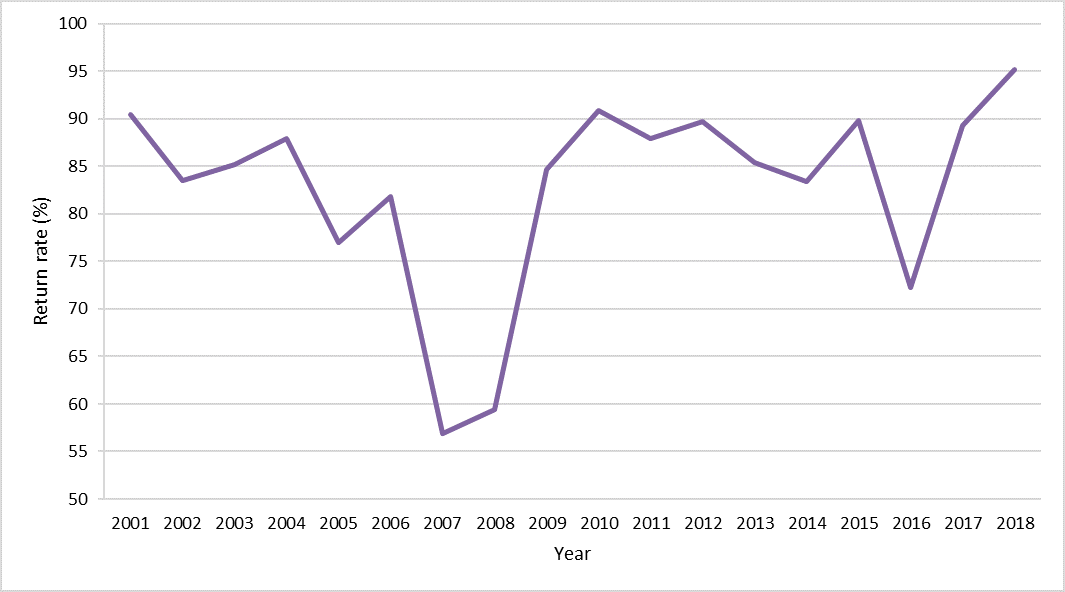
Survival, except for years 2007 and 2008 is generally good (Figure q). It is high and steady from 2011 to 2015.
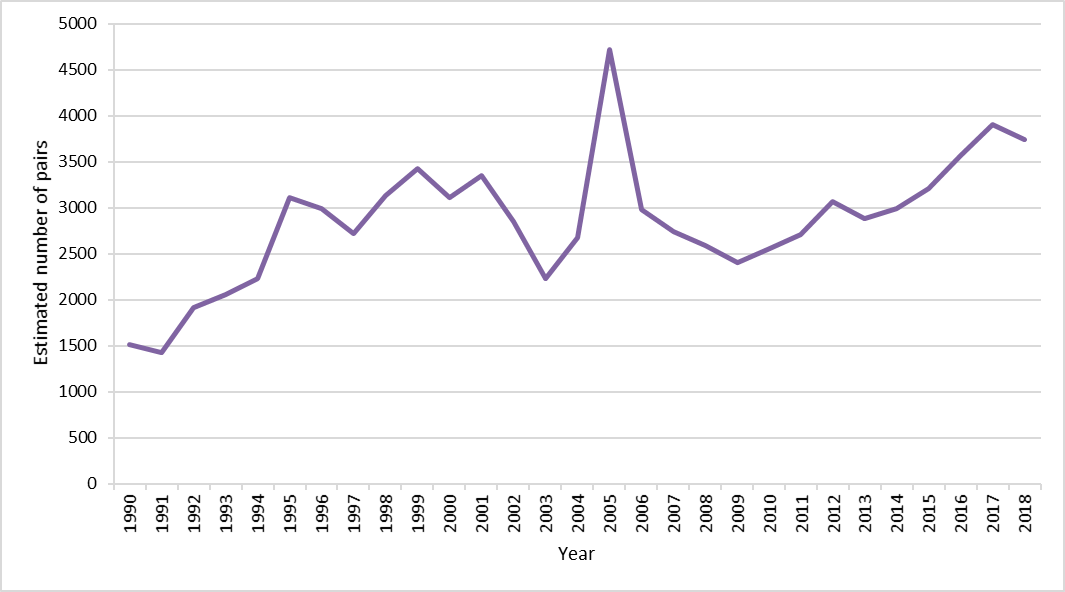
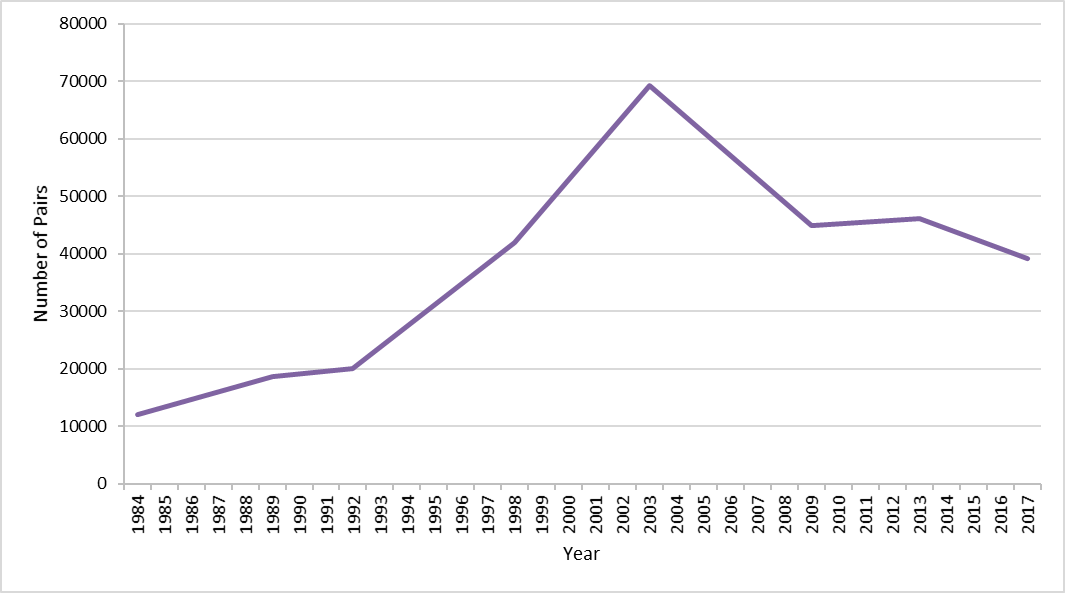
Since 1984 the population of Atlantic puffin on the Isle of May has increased from 12,000 pairs to 39,200 in 2017 (Figure r). Although during 1998 to 2013 the population was higher: the peak count being 69,300 pairs in 2003 and 46,200 pairs in 2013. During the period 2011 to 2017 therefore, the population declined but is still well above that in 1984.
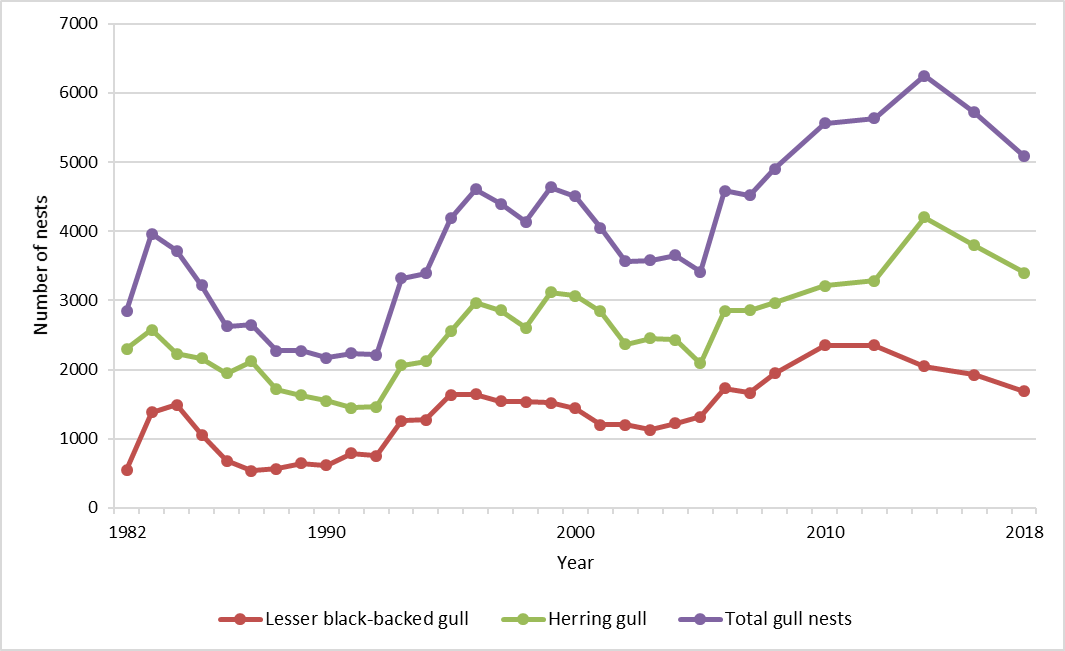
Herring gull and lesser black-backed gull
Moray Firth and North Coast Scottish Marine Region
For northern mainland Scotland there is no SMP key site, but as part of the National Seabird Census recent counts have been commissioned for the North Caithness Cliffs SPA and East Caithness Cliffs SPA which allow site specific trends to be determined. North Caithness Cliffs SPA falls within the North Coast and Moray Firth SMRs, while East Caithness Cliffs SPA is within the Moray Firth, but it is not sensible to draw indices for the complete SMR from either site as other major colonies also exist within each region.
The latest counts for East Caithness Cliffs in 2015 and North Caithness Cliffs in 2016 revealed:
Northern fulmar
There were 13,864 AOS at East Caithness Cliffs in 2015, 3.6% lower than 1999 and part of a slow decline since 1986. The results were similar for North Caithness Cliffs with 13,405 AOS in 2015/16, 7% lower than 1999 and showing a continued slow decline since 1986.
Great cormorant
This species is only recorded breeding at East Caithness Cliffs where there were 53 AON in 2015, 41.1% lower than 1999 and a continuation of a long term 81% decline since 1977.
European shag
At East Caithness Cliffs there were 1,098 AON, 3.6% higher than 1999, but overall 53% down on the peak recorded in 1986. The total of 170 AON at North Caithness Cliffs was a much larger increase at 66% higher than 1999.
Black-legged kittiwake
At East Caithness there were 24,460 AON, a decline of 39.5% since 1999. While at North Caithness there were 5,568 AON, a decline of 55% since 1999 and 64% since 1986. Both sites show a similar trend of similar magnitude.
Herring gull
The population of 3,267 apparently occupied territories (AOT) at East Caithness was 4.2% lower than in 1999 and a continuation of a 79% decline since 1977. Conversely at North Caithness Cliffs, herring gull numbers in 2016 were 33% higher than in 1999 at 232 AOT.
Great black-backed gull
Increased strongly at both SPAs. There were 266 AOT at East Caithness Cliffs, an increase of 47.8% since 1999, though still 74% lower than the peak recorded in 1977. While at North Caithness Cliffs there were 68 AOT in 2016, an increase of 81% since 1999.
Common guillemot
There were 149,228 birds counted at East Caithness Cliffs in 2015, a decline of 6.2% since 1999, but still 40% higher than the numbers present in 1977 and 1986. A much stronger decline was noted at North Caithness Cliffs with 38,863 birds present, a decline of 53% since 1999, but still 93% higher than the numbers present in 1986.
Razorbill
The East Caithness Cliffs population was measured at 30,042 birds, an increase of 69.5% since 1999 and a continuation of a long term 147% increase since 1977. Numbers at North Caithness Cliffs also showed a similar strong increase with 3,503 birds counted. This is an increase of 39% since 1999 and a continuation of a long term 112% increase since 1986.
Atlantic puffin
Only recorded in substantial numbers in North Caithness Cliffs 3,053 birds counted, 55% lower than the 1999 count, but just 13% lower than the numbers present in 1986.
The long-term trend for the four key SPA species shows that generally they have fared better at the North Caithness Cliffs SPA when compared with the overall Scottish trend. Although the long-term decline in black-legged kittiwake is similar to the Scottish trend, the decline in northern fulmar is far less and for common guillemot and razorbill the overall increase is greater.
Shetland Scottish Marine Region
Fair Isle is the SMP key site and the Shetland Bird report gives details of seabird trends as monitored by Shetland Oil Terminal Environmental Advisory Group (SOTEAG).
An index of seabird breeding success for the Fair Isle (Figure t) can be inferred from the data provided by monitoring on Fair Isle and compared with another high intensity monitored site, Noss NNR and sites monitored under the SOTEAG programme. Breeding success was at its lowest point in 2011. The index shows a level of stability during 2012-2018 (with 2013 and 2017 being poor years).
In the Shetland SMR most seabirds have declined, in particular there have been large declines for black-legged kittiwake and Arctic skua (and this is the same picture seen for the Northern Isles as a whole).
Summary species information for Fair Isle and Shetland is published in the Fair Isle Bird Observatory annual report and the Shetland Bird Report respectively.
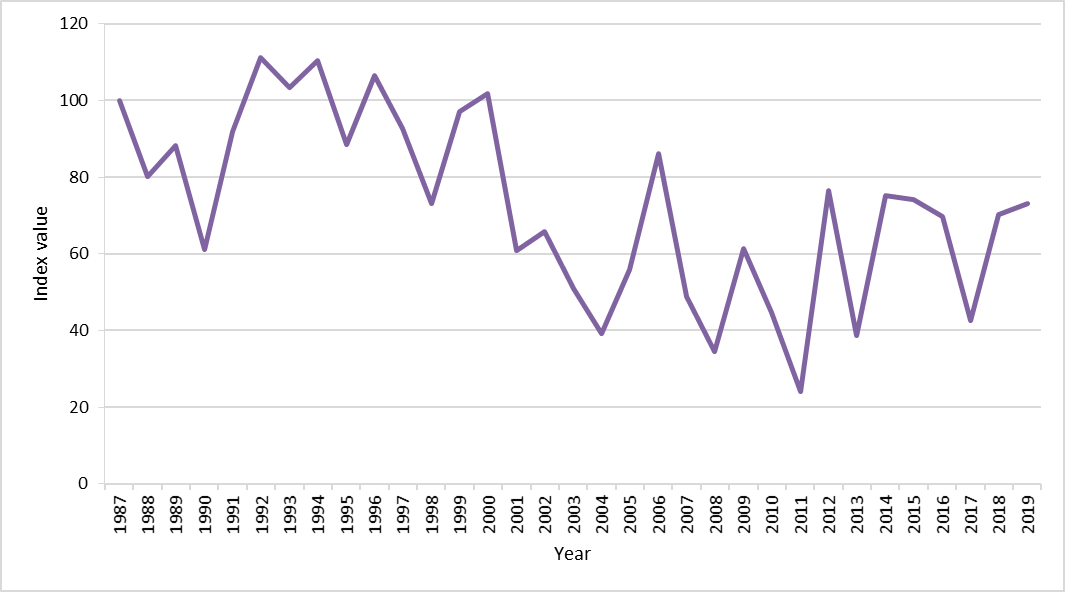
Northern fulmar
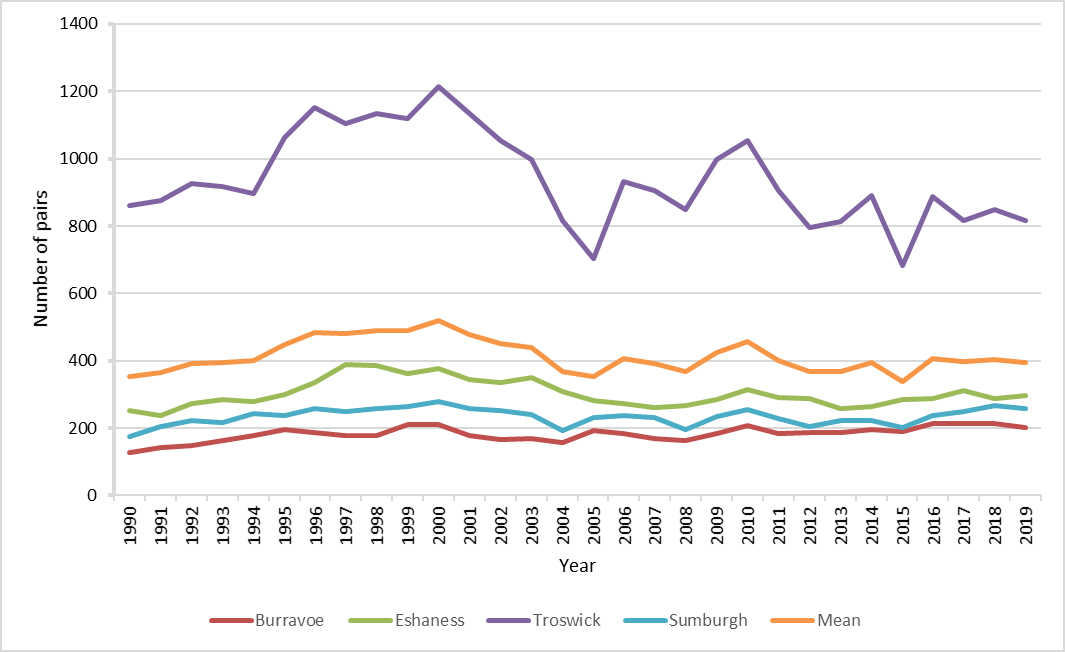
Plot counts on Fair Isle show a decrease from 1986, but since 2011 the population has increased. In Shetland the number of AOS at NatureScot and SOTEAG monitoring plots was similar in 2017 and 2018, having increased slightly since 2011 (Figure u).
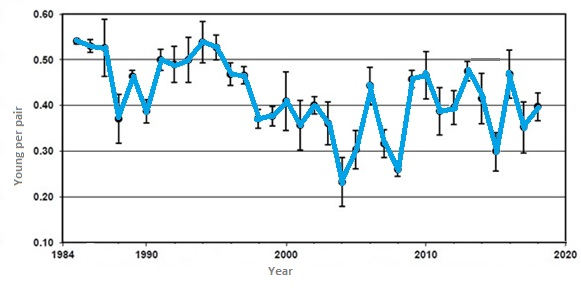
The 2018 breeding success in Shetland was similar to the 1985 to 2017 average of 0.42 young / AOS at 0.4 chicks per AOS. Between 2011 and 2017 the productivity was above the long-term average in 3 years, but below in 5 years (Figure v).
European shag
Since 1986 breeding numbers have declined from around 1,099 apparently occupied nests (AONs) to 204 AONs in 2013 when the last all island count of Fair Isle was completed. Two monitoring plots have been the subject of long-term counting, one at Sumburgh Head is counted by SOTEAG; while Noss NNR is also counted annually by NatureScot. Between 2011 and 2017 the number of nests at Sumburgh Head and nearby No Ness has declined by 10% (from 100 to 90) and 21% (from 134 to 107 nests) respectively. Over the same period the Noss NNR population increased from 96 to 104 AON (+8%).
Northern gannet
The Fair Isle breeding population has increased since the early 2000s, reaching 3,409 AON in 2016, 3,882 AON in 2017 and 4,291 AON in 2018. Northern gannet first bred on Fair Isle in 1975.
On Noss the population increased from 9,767 AOS in 2008 to 11,786 AOS in 2014 and 13,765 AOS in 2019. Therefore, during the period 2014 to 2019 the population has increased by 17%.
At three monitored colonies in Shetland (Noss, Hermaness and Fair Isle) breeding success has ranged between 0.66 and 0.75 from 2011 to 2017. The mean breeding success was 0.71 chicks raised per nest.
Common guillemot
Since 1986 the number of common guillemot on Fair Isle has declined, although that rate of decline has slowed and even levelled off in recent years. Long-term monitoring shows that numbers are still around double those in the 1960s.
The population on Noss is counted approximately every six years with 22,065 individuals recorded in 2009 and 24,456 in 2015. It is likely that the population was stable or slightly increasing between 2011 to 2015.
Razorbill
On Fair Isle the population was around 5,000 birds in 1986 but has declined to 1,930 birds in 2015. On Noss, however, the numbers counted in 2009 and 2015 were similar (558 and 533 birds respectively). This is considerably smaller than counts in 2001 (1,984) or 1991 (1,180) indicating, like common guillemot, a historical decline that has now levelled out.
Black guillemot
On Fair Isle from 1986 there was a decline until around 1996, since then numbers have remained around 150 breeding adults. On Noss the monitoring plot shows that numbers have declined slightly from 2011 to 2017 from 55 birds in 2011 to 47 birds in 2017.
Great black-backed gull
Numbers on Noss declined between 2011 and 2017 from 66 AOT to 26 AOT, having varied between 47 and 80 AOT for the previous 20 years.
Herring gull
Although the number of breeding pairs on Noss was higher in the 1990s and early 2000s at around 60 AOT, between 2011 and 2017 the population was fairly stable at a lower level between 33 and 24 AOT.
Black-legged kittiwake
The population on Noss declined from 507 pairs in 2010 to 44 pairs in 2017 (-91%). This is a continuation of a steep decline from more than 10,000 pairs in 1970. At other colonies counted in Shetland the number of pairs declined, between 2010 and 2017, from 582 to 256 on Foula (-56%), from 161 to 46 at Compass Head (-71%) and from 386 to 254 at Sumburgh Head (-34%). All sites held much larger numbers of birds in previous decades, with peak numbers recorded around 1980 at most sites.
Arctic tern
Large declines in Arctic tern have been recorded in Shetland since the 1980s, and colonies are now relatively small and scattered. Regular monitoring takes place on Fair Isle and on Noss NNR.
On Fair Isle there were 322 AON in 2017, with only 0.06 chicks produced per AON, only 9 AON were recorded in 2011, but there were 377 AON in 2010. Numbers have been erratic, but generally low with low breeding success during the 2011-2017 period.
On Noss there were 51 AON in 2017, with similar productivity to Fair Isle (0.06 chicks per AON). In 2011 no Arctic tern nested on Noss, but between 2011 and 2017 the population has fluctuated between 0 and 72 pairs. Previously there were 140 pairs in 2004, 120 pairs in 1998, although the colony here has always been relatively small and fluctuated in size.
Great skua
On Noss the great skua population is stable at 465 AOT in 2013 and 478 AOT in 2018 having increased from around 400 pairs at the turn of the century. Productivity has been generally poor in recent years but fluctuates (Figure w). On Fetlar there were 887 AOT in 2017 compared to 593 recorded in Seabird 2000. On Yell numbers were little changed from seabird 2000. A whole island survey found 392 AOT in 2017, compared to 384 previously.
Arctic skua
Very few Arctic skua breed on Noss, with only 1 or 2 pairs between 2011 and 2017. This is down from 5 pairs in 2007, 10 pairs in 2000 and 15 pairs in 1990. As the great majority of Scotland’s Arctic skua breed in Shetland the regional trend is very similar to the national trend reported above.
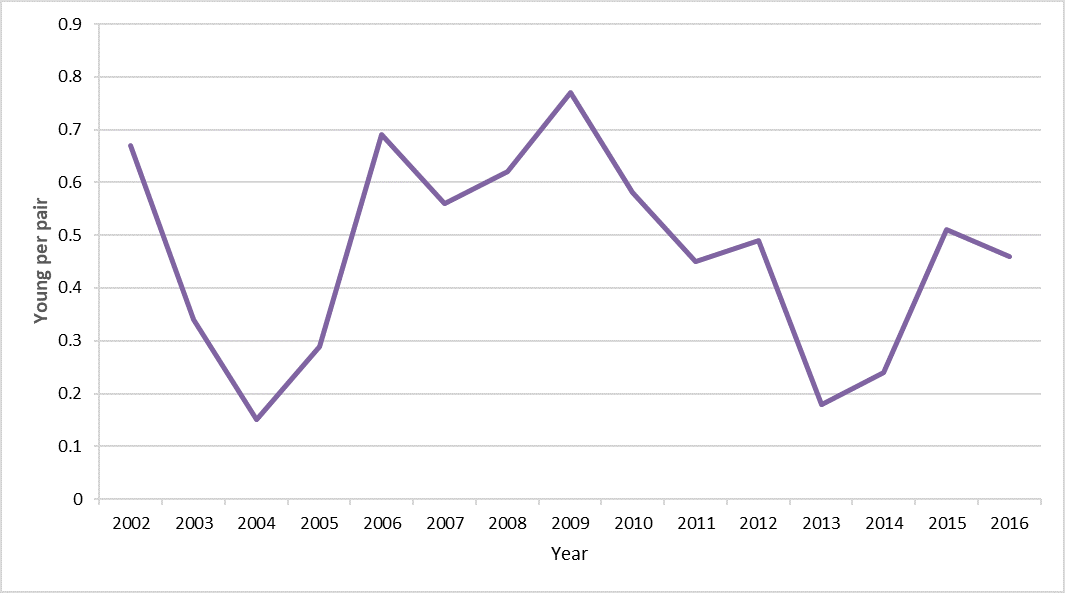
Productivity at monitoring plots in Shetland was generally low between 2011 and 2017 (Figure x).

West Highland Scottish Marine Region
Canna is the west coast SMP key site. It is monitored mainly by the Highland Ringing Group.
An index of seabird breeding success for Canna and Sanday (Figure y) can be inferred from data provided by monitoring on Canna and Sanday. The index of breeding success (purple line) is consistently above the baseline (index value 100) during this assessment period.
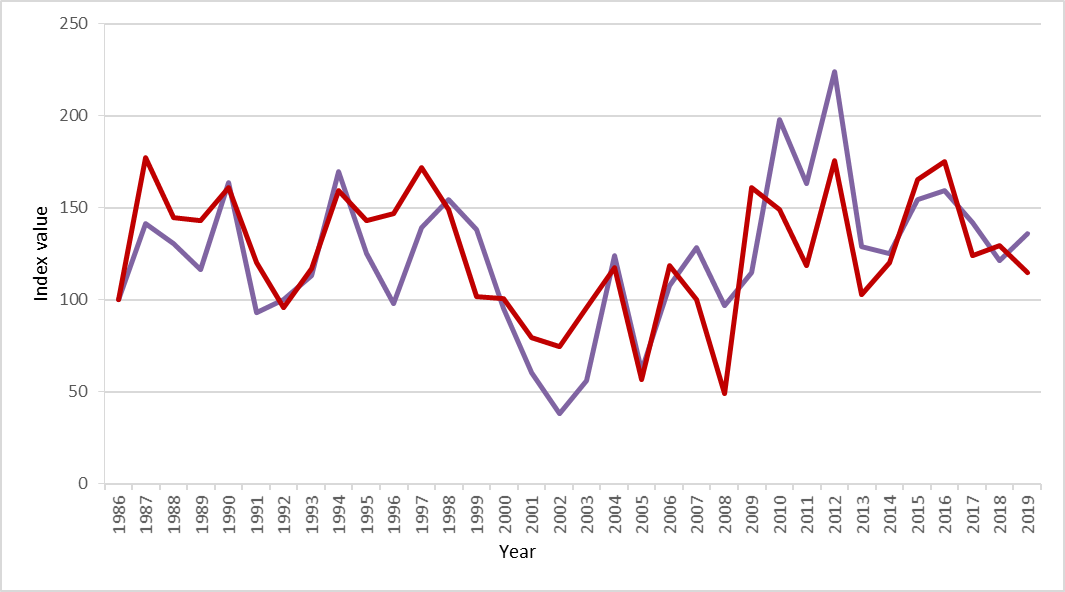
Figure y: Seabird breeding success for all monitored seabirds on Canna and Sanday (purple line) and an index using only data from black-legged kittiwake, European shag and northern fulmar (red line).
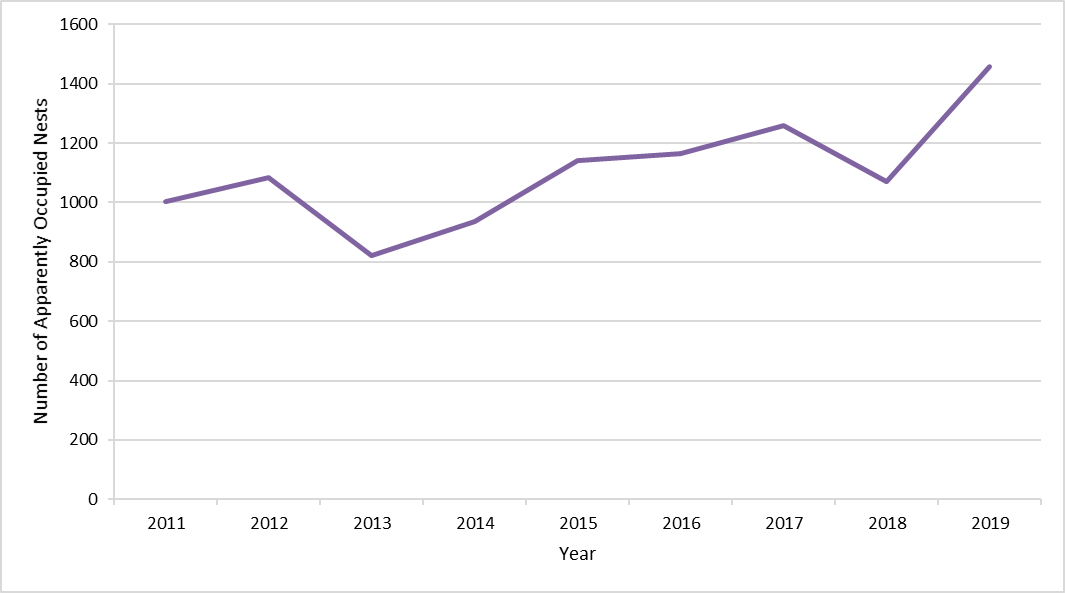
Recent counts of seabirds on Canna show that European shag and black-legged kittiwake have shown increases in numbers. Black-legged kittiwake numbers have been around 1,000 pairs (between 820 and 1,200) in the period 2011 to 2018 (Figure z).
Pressures from activities
The main drivers of seabird population changes are thought to be climate change, introduction of invasive species and changes in prey abundance and quality. Other pressures include fisheries bycatch, collisions and displacement with anthropogenic structures and pollution. These may cause local or even national population-level effects. For all of these pressures there is evidence of impacts on Scottish seabirds. However, quantitative data to determine the full extent to which these pressures act on seabird populations, individually and in combination with each other, is lacking.
An assessment of all pressures acting on the seas around Scotland and the main activities causing these is provided for each of the Scottish Marine Regions under Pressures from Activities.
Fisheries: Fisheries impacts may operate directly through bycatch or indirectly through discarding ‘waste’ fish and through competing with seabirds for forage fish. Numbers of birds accounted for by this pressure are largely unknown (although see Bradbury et al., 2017 and Northridge et al., 2020). Studies of discard impacts and fisheries impacts on forage fish (e.g. Gremilet et al., 2018; Sydeman et al., 2017) show that pressures on seabirds are increasing, globally. More widely an analysis of discard fish available in the North Sea (Sherley et al., 2019) reports that the amount of discards in the area declined by 48% between 1990 and 2010, with a consequent decline in the number of scavenging seabirds that could be supported.
Inshore and non-commercial fish stocks are not well monitored, and this is a significant obstacle to understanding seabird declines. While sea (and air) temperatures are routinely monitored the impact on forage fish for seabirds is not well established as most forage fish are not commercially important (although some sandeel fisheries are an exception). Fisheries monitoring is also not targeted at understanding the links between forage fish and predators, and implementation of discard monitoring is in its early stages. Other fisheries may impact seabirds indirectly through habitat alteration leading to changes in prey densities or distribution, although information relating to this is currently limited.
Marine energy: Collison and displacement by marine energy developments has not yet been shown to operate at a population scale. As increasing development takes place (see Scottish Government Sectoral Plan report) and currently consented projects are built, monitoring of these projects during operation will provide empirical evidence of the scale of any impact which has largely been assessed through theoretical modelling until now.
Wider pressures: Pressures that are expected mainly to act through changing prey availability include: loss of sea area (to land or fresh water); barrier impacts; and removal and modification of seabed habitats (e.g. through dredging activities or harbour development) are associated with many activities. These pressures are not measured systematically, or on a wide scale with respect to their impact on birds.
Conclusion
The indices of seabird abundance and breeding success have shown a degree of stability over the period 2011 to 2018. Individual populations of seabird species have changed, with significant decreases in black-legged kittiwake and Arctic skua, but large increases in northern gannet.
The 2018 abundance of seabird species had declined by 38% from the 1986 baseline value with the steepest decline during the period 2000 to 2011. During 1986 to 2018, breeding success of seabird species in Scotland has on average been 20% below the baseline set at the start of the period. Average breeding success was at its highest during the 1990s, at its lowest during 2004 to 2008 and has subsequently shown some improvement.
The seabird indicator uses data from the SMP annual sample. The quality, quantity and geographical spread (Figure a) of these data are good, however, the last national seabird census was over 15 years ago and therefore, reduces the assessment confidence to medium.
At present there is not a full understanding of the mechanism/s driving seabird populations around Scotland. Further research is required to inform knowledge gaps and make links to the underlying drivers of change.
The results from the indicator are suitable to be used at a Scotland-wide scale and the trend calculation technique is suitable to be used at a finer-scale, where colonies are regularly monitored. Trends are not currently available for Scottish Marine Regions as sufficiently wide and regular counts are not made to be able to construct a reliable trend. Similarly, raw numbers expressed at regional level are incomplete and not comparable across the time period. Comparison is only likely to be possible between full census periods. However, information is provided by Scottish Marine Region from counts at the key monitoring sites (Figure a). Therefore, it is recommended that assessments are made using the national scale trend with supplementary colony specific information publicly available from the Seabird Monitoring Programme Database. The seabird indicator only provides data on changes during the breeding season for a selected number of species. Results from the national census (due in 2022) will provide a more detailed picture of numbers across Scotland for all seabird species, albeit with only three or four nodes each at approximately 15 years interval (dependent on species).
The relatively short period of the current assessment (compared to seabird generation times) shows to some extent the variability year to year of the index. It is important to see the current assessment in terms of the longer-term trends for individual species and for the seabird group as a whole.
This assessment uses the same data that are used for OSPAR, UK Marine Strategy and EU Wild Birds Directive reporting purposes. All come to a similar conclusion that seabirds have declined since 1986. Although since 2011 there has been stabilisation of population but levels still remain below the start of the time series (1986).
The Scottish Government is currently developing a Scottish Seabird Conservation Strategy. Part of this work will include identifying conservation actions for seabirds in Scotland.
RSPB’s Life-funded Island Biosecurity Project is tackling the issue of invasive non-native species for many seabird breeding sites, but more locations, especially larger islands could be tackled. Continued monitoring of Special Protection Areas on and around islands should be in place following the LIFE-funded project.
Knowledge gaps
- Breeding numbers and success trends at a regional (sub-Scotland) level.
- Breeding numbers and success of shearwaters and petrels.
- Research on the mechanisms and drivers of changes in seabird populations particularly, climate change, predator-prey dynamics, fisheries bycatch, marine energy collision risk and contaminants.
- The location of key wintering areas for breeding seabirds.
Breeding numbers and success trends at a regional (sub-Scotland) level.
Different seabird species around Scotland have differing national trends; the general national index has been reported. Further work is required to understand the drivers at a regional scale, including an expansion of the number of sites that are monitored. Through the Seabird Monitoring Programme only a few sites are monitored intensively annually and more of these would be required for robust regional assessments. New technologies, especially automated counting (image recognition and permanent camera systems) could be used to increase monitoring coverage. Work on black-legged kittiwakes has shown a link between sea surface temperature, sandeel availability and breeding success in the North Sea, but knowledge of the key drivers is lacking for west coast populations.
Breeding success is the more volatile but more rapidly responding index. It is not affected by meta-colony dynamics in the same way as breeding numbers. Combined with tracking information breeding success can reveal more local influences. However, productivity is only monitored at a small number of colonies. This, and improving survival estimates (using bird ringing protocols such as the British Trust for Ornithology’s Retrapping Adults for Survival (RAS)) will improve models that aim to predict population sizes in future.
Direct mortality from offshore development, especially offshore renewable energy developments has been a focus of attention on the east coast. With a further round of development in new areas there is a requirement to obtain empirical estimates of mortality to improve modelled estimates that have so far been relied upon for environmental assessments.
The assessment could also be expanded to include more data on seabirds at sea, especially utilising existing information from GPS tracking and geolocator tagging studies.
Breeding numbers and success of shearwaters and petrels.
The national census will provide an improved picture for the trends for all species of seabirds. Most of the seabirds are relatively straightforward to monitor, in contrast those that nest in burrows, and typically only return to colonies during the night, are more problematic. Three species (Manx shearwater, European storm-petrel and Leach’s petrel) fall into this category. It is difficult to accurately monitor numbers of Atlantic puffin except at a few colonies. Part of the census has focused on providing good estimates of breeding numbers for these with results due in 2022. To cover burrow nesting species more regularly so that they contribute to the index requires survey protocols to be developed and tested.
Species that remain close to colonies year-round, and forage relatively near to breeding sites during the nesting season include black guillemot and European shag. These species may rely on different fish (non-commercial) and different habitat (particularly kelp forest) in the immediate vicinity of colonies. There are no schemes routinely or widely monitoring these habitats, although data on black guillemot and shag do contribute to the index.
The distribution, frequency and intensity of key pressures on seabirds
Work has already identified the presence of invasive non-native species on islands. A major project to establish biosecurity protocols at seabird breeding sites is underway.
Climate change is having effects at many levels, for example altering prey dynamics, increasing stress through storm events, and increasing heat stress on breeding birds. These effects have been predicted to lead to population movement (Russell et al., 2015). Further understanding of the impacts of climate change could lead to predictions of which protected areas will increase in importance and where new ones will need to be established.
Monitoring of fish species of importance to seabirds is not widespread or is missing from some areas. It is therefore often difficult to draw conclusions about the relationship between fish stock dynamics and changes in seabird populations. In particular, up-to-date information on the distribution and abundance of key seabird prey species (e.g. sandeels and sprat) and the pressures effecting these species. If the dynamics of the impacts of fishing activity on predator fish and in turn on forage fish for birds were better understood this could inform management for offshore foraging proposed SPAs and for seabirds and marine mammals generally.
Direct monitoring of established offshore windfarms is only now becoming a possibility as more wind farms are built and technology to monitor bird behaviour is developed. Projects such as the Offshore Renewables Joint Industry Programme (ORJIP) Bird Collision Avoidance study are providing vital evidence to allow more robust estimates of mortality to be made. Tracking and tagging of birds as well as survey and monitoring of colonies in co-ordinated and strategic studies allow those estimates to be linked to population effects. Sub-lethal effects expected from displacement or barrier impacts to seabirds in Scottish waters have only been theoretically assessed at present such as the Effects of displacement from marine renewable developments on seabirds breeding at the Isle of May study (Searle et al., 2014).
Regular assessment of contamination of seabirds from persistent pollutants, non-synthetic and synthetic compounds does not occur. Some academic studies have made assessments (e.g. Bearhop et al., 2009; Thompson et al., 1990; Kym et al., 1996) and reports suggest that levels of contamination are in most cases not sufficient to cause significant impacts, and in some cases, levels have declined in recent decades. Although for many compounds significance of levels found in seabirds is not known.
Litter causes direct mortality when birds are entangled in lines and ropes, often when it is used as nesting material (O’Hanlon et al., 2017). Sub-lethal and lethal impacts of plastic ingestion are recorded for many groups, but especially Procellariformes, including northern fulmar (Roman et al., 2019). Regular monitoring of northern fulmar does take place in the North Sea under the OSPAR monitoring programme (D.10 Marine Litter).
Seabird bycatch causes direct mortality, but the numbers of birds involved, their origin and status are not currently well understood.
The location of key wintering areas for breeding seabirds in Scotland
There is a growing body of research looking at seabird movements around Scotland and linking results from colonies to look for patterns. Distributions of seabirds in the non-breeding season have recently been modelled (Waggitt et al., 2019). Results of such studies improve our knowledge on how seabirds use the seas around Scotland outside the breeding season. Knowledge of key wintering areas and even timings when birds come back to colonies is improving as a result. Most seabirds also use areas beyond Scotland’s seas, for instance recent tracking work has shown a large proportion of black-legged kittiwakes recorded on the west coast use the seas around south Greenland and Canada during the winter. Three sites around Scotland are part of the SEATRACK programme which is looking at how seabirds use the seas around the Arctic. In addition, funding from the renewable sector has seen a Scotland-wide tracking initiative for species such as northern fulmar, black-legged kittiwake, common guillemot and razorbill.
Interaction with marine energy developments and fisheries in the non-breeding season (and in the breeding season) could be better quantified if fine-scale telemetry data were available. Technologies to provide this information are being developed. Miniaturisation of tracking devices, cameras and development of radar / camera systems to monitor interactions with offshore activities will enable assessment of mortality and pressure contact year-round. Most mortality of seabirds occurs during the non-breeding season.
Understanding the contribution of protected areas for foraging and wintering to the network of protected breeding sites will also be aided by such studies.
Status and trend assessment
National Level Assessment of seabird abundance (2011 to 2018)
|
Species
|
Status with confidence
|
Trend with confidence
|
| All seabirds |
 |
|
|
Arctic skua
|
 |
|
|
Arctic tern
|
 |
|
|
Black guillemot
|
 |
|
|
Black-legged kittiwake
|
 |
|
|
Common gull
|
 |
|
|
Common tern
|
 |
|
|
European shag
|
 |
|
|
Great black-backed gull
|
 |
|
|
Common guillemot
|
 |
|
|
Herring gull (natural-nesting)
|
 |
|
|
Northern fulmar
|
 |
|
SMR 1 - Forth and Tay
|
Species
|
Status with confidence
|
Trend with confidence
|
|
Black-legged kittiwake
|
 |
|
|
European shag
|
 |
|
|
Lesser black-backed gull
|
 |
|
| Herring gull (natural-nesting) |
 |
|
|
Atlantic puffin
|
 |
|
|
Common guillemot
|
 |
|
| Razorbill |
 |
|
|
Northern fulmar
|
 |
|
SMR 3 - Moray Firth and SMR 6 - North Coast
|
Species
|
Status with confidence
|
Trend with confidence
|
|
Great cormorant
|
 |
|
|
European shag
|
 |
|
|
Black-legged kittiwake
|
 |
|
|
Great black-backed gull
|
 |
|
|
Herring gull
|
 |
|
|
Common guillemot
|
 |
|
|
Razorbill
|
 |
|
|
Atlantic puffin
|
 |
|
|
Northern fulmar
|
 |
|
Status assessment for these SMRs is for 2011 to 2018, but Trend assessment is for 2000 to 2016
SMR 5 - Shetland
|
Species
|
Status with confidence
|
Trend with confidence
|
| Black guillemot |
 |
|
|
Black-legged kittiwake
|
 |
|
|
Arctic tern
|
 |
|
|
European shag
|
 |
|
| Common guillemot |
 |
|
|
Razorbill
|
 |
|
|
Great black-backed gull
|
 |
|
| Herring gull |
 |
|
| Great skua |
 |
|
| Arctic skua |
 |
|
|
Northern fulmar
|
 |
|
SMR 7 - West Highland
|
Species
|
Status with confidence
|
Trend with confidence
|
|
Black-legged kittiwake
|
 |
|
|
European shag
|
 |
|
|
Common guillemot
|
 |
|
|
Razorbill
|
 |
|
|
Great black-backed gull
|
 |
|
|
Herring gull
|
 |
|
|
Lesser black-backed gull
|
 |
|
|
Northern fulmar
|
 |
|
This Legend block contains the key for the status and trend assessment, the confidence assessment and the assessment regions (SMRs and OMRs or other regions used). More information on the various regions used in SMA2020 is available on the Assessment processes and methods page.
Status and trend assessment
|
Status assessment
(for Clean and safe, Healthy and biologically diverse assessments)
|
Trend assessment
(for Clean and safe, Healthy and biologically diverse and Productive assessments)
|
||
|---|---|---|---|
 |
Many concerns |
No / little change |
|
 |
Some concerns |
Increasing |
|
 |
Few or no concerns |
Decreasing |
|
 |
Few or no concerns, but some local concerns |
No trend discernible |
|
 |
Few or no concerns, but many local concerns |
All trends | |
 |
Some concerns, but many local concerns |
||
 |
Lack of evidence / robust assessment criteria |
||
| Lack of regional evidence / robust assessment criteria, but no or few concerns for some local areas | |||
 |
Lack of regional evidence / robust assessment criteria, but some concerns for some local areas | ||
| Lack of regional evidence / robust assessment criteria, but many concerns for some local areas | |||
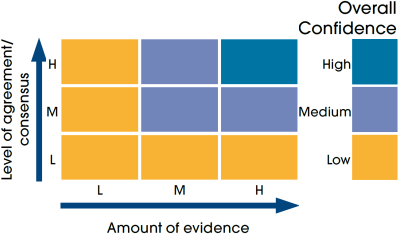
Confidence assessment
|
Symbol |
Confidence rating |
|---|---|
|
Low |
|
|
Medium |
|
|
High |
Assessment regions
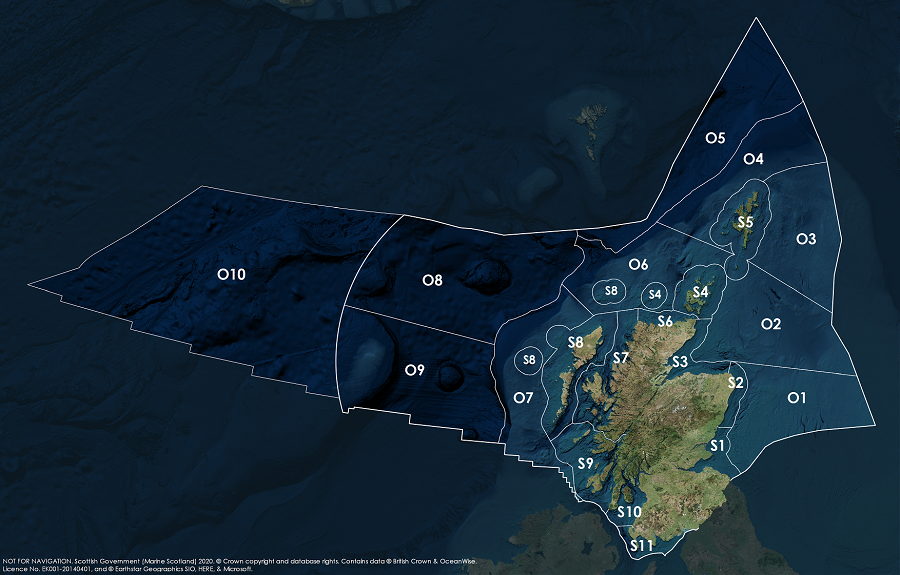
Key: S1, Forth and Tay; S2, North East; S3, Moray Firth; S4 Orkney Islands, S5, Shetland Isles; S6, North Coast; S7, West Highlands; S8, Outer Hebrides; S9, Argyll; S10, Clyde; S11, Solway; O1, Long Forties, O2, Fladen and Moray Firth Offshore; O3, East Shetland Shelf; O4, North and West Shetland Shelf; O5, Faroe-Shetland Channel; O6, North Scotland Shelf; O7, Hebrides Shelf; O8, Bailey; O9, Rockall; O10, Hatton.
