

Background
Eutrophication in the marine environment is the excessive growth of phytoplankton in response to enrichment by nutrients (nitrogen (N) and phosphorus (P)) resulting in an undesirable disturbance in the marine ecosystem. The consequences are often wide ranging, with overall impacts on the diversity and abundance of flora and fauna resulting from the depletion of oxygen in the water column, increases in water turbidity and behavioural changes in larger fauna. Other pressures, such as climate change, can also result in similar observed effects, often making it difficult to determine causal links.
Inputs of nutrients provide an important indication of nutrient enrichment and the potential for eutrophication. Nitrogen and phosphorus can enter the sea from a number of natural and anthropogenic sources. These include direct discharges (Figure 1) (e.g. sewage, aquaculture etc.), inputs from rivers, land runoff and atmospheric deposition.
The Scottish Environment Protection Agency (SEPA) regulates discharges to the sea and monitors nutrient concentrations in rivers. Data collected from these activities were used to calculate annual inputs of nutrients using the OSPAR Riverine Inputs and Direct Discharges (RID) approach. These were used to assess the relative contributions of anthropogenic activities to nutrient enrichment. These data were analysed in time series to assess the success of management measures aimed at reducing nutrient inputs, such as OSPAR recommendations and a number of EU directives (e.g. Water Framework Directive).
This assessment determines waterborne nutrient inputs into the Scottish Marine Regions (SMRs) and analyse trends since the last Marine Atlas Assessment (Baxter et al., 2011). Atmospheric inputs were not assessed.
")
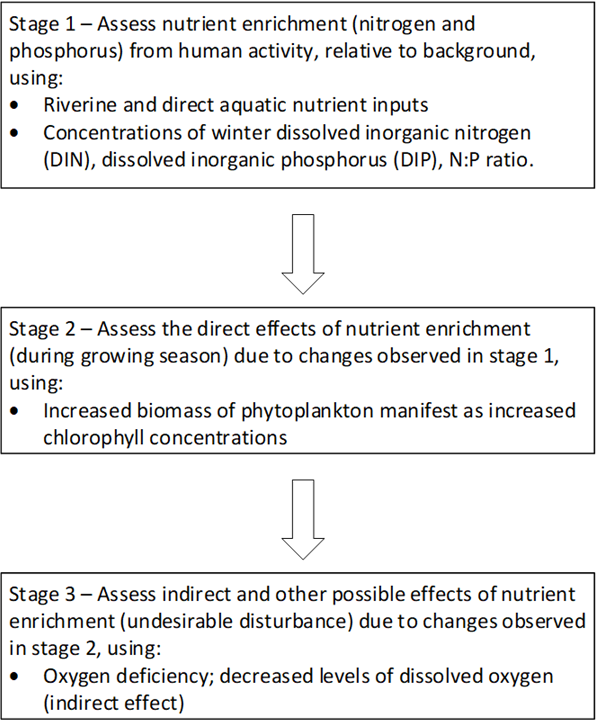
The assessment of eutrophication is split into indicators of nutrient enrichment, direct nutrient enrichment effects and indirect nutrient enrichment effects as per the OSPAR and Marine Strategy Framework Directive (MSFD) eutrophication assessment methodology. The components of the OSPAR and MSFD eutrophication assessment methodology that are used in this assessment are shown in Figure a.
Eutrophication is a problem if there is evidence of nutrient enrichment (Stage 1; inputs & winter nutrients), direct effects of nutrient enrichment (Stage 2; elevated chlorophyll concentration, increased blooms) and indirect effects of nutrient enrichment (Stage 3; oxygen deficiency, biomass changes). This indicator assessment aims to understand the inputs of nutrients into the marine environment as an indicator of nutrient enrichment.
 |
|
Figure a: The three stages of eutrophication assessment used in this assessment |
This assessment outlines the changes to the inputs of nutrients into each of the SMRs from 2007 to 2017. SEPA collects data on nutrient inputs from riverine sources, and direct inputs from sewage, trade and aquaculture effluents under the OSPAR Riverine Inputs and Direct Discharges (RID) programme.
For riverine sources, total nitrogen (N) and total phosphorus (P) monitoring data collected at the bottom of major river catchments were combined with flow data to calculate total annual nutrient inputs according to the OSPAR RID approach (OSPAR, 2014). Where recorded flow data were not available, flow was modelled using either an areal weighting approach or the low flows enterprise model (Young, Grew & Holmes, 2003).
Trade and sewage effluent nutrient concentrations and flows were used to derive annual loads as per OSPAR RID. Annual total nutrient loads from marine finfish aquaculture were derived from operator returns, calculated using feed inputs and coefficients to account for the nutrient content of feed, losses of feed to the environment and excretion of nutrients by the fish, to provide an annual total N and total P load per farm (Scotland’s Environment Web, 2019). The locations of each riverine, trade, sewage and marine finfish aquaculture site are shown in Figure b.

Where enough data were available, trends were assessed using the non-parametric Mann-Kendall test (Mann, 1945; Kendall, 1975). Where p-values are <0.05 it is assumed trends are statistically significant. Where significant trends existed and trends were visually assessed to be linear the non-parametric Theil-Sen estimator was used to estimate the trend line. Data were flow normalised according to the OSPAR RID principles for the purposes of trend assessment.
Results
There is no status assessment for nutrient inputs into the marine environment as there are no regionally set assessment thresholds. However, the nutrient inputs assessment should be interpreted in conjunction with the other indicator assessments that contribute to the overall assessment of eutrophication.
The highest total loads for both total nitrogen and total phosphorus were generally found in the regions that drained the largest urban areas. These included the Clyde, Forth & Tay, North East and Moray regions. Total loads in more sparsely populated regions were often an order of magnitude lower e.g. North Coast, Outer Hebrides and Orkney Islands.
Trend assessment
For both total nitrogen and total phosphorus from 2007-2017, statistically significant increasing trends exist for the North Coast, Orkney Islands and Outer Hebrides SMRs, whilst a statistically significant decreasing trend exists in the Shetland Islands (Figures 2 & 3). No other statistically significant trends were found in any of the other regions for total nitrogen or total phosphorus.
Examining the nutrient inputs from different sources suggest that increasing trends in the Orkney Islands and the Outer Hebrides are a result of increases in loads from marine pen fish farms which are related to increasing farmed fish biomass in the region (extended results). This is in contrast to the winter nutrient assessment which shows decreasing Dissolved Inorganic Nitrogen (DIN) trends in the Orkney region and no trend in the Outer Hebrides. This suggests increased nitrogen inputs did not translate across to the wider marine regions either because it was not readily available or there was dispersion/ dilution in the region.
The decreasing trend in the Shetland Islands is a result of a steady decrease in loads from marine pen fish farms, which is related to a comparable decrease in farmed fish biomass in the region.
The increasing trend in the North Coast region is related to increasing riverine loads, which whilst statistically significant, still presents the lowest nutrient input of all regions.
.")
")
Change since Scotland’s Marine Atlas (2011)
Although the assessment regions are different between this assessment and Scotland’s Marine Atlas (Baxter et al., 2011) there are some that are broadly comparable. In regions such as the Clyde, Forth & Tay and North East, total nitrogen and total phosphorus inputs from 1990-2008 (2011 Atlas) are generally higher than in the assessment period of this assessment (2007-2017), suggesting there has been a general decrease in nutrient input since 1990. Reductions in total nitrogen and total phosphorus inputs over this time period are a result of improvements made to wastewater treatment. This aligns with findings from regional assessments such as the MSFD assessment (2019) and the OSPAR intermediate assessment (2017).
This assessment also includes aquaculture inputs, which were not quantified in the 2011 Atlas. Nutrient inputs from aquaculture include the total nutrient load (dissolved and particulate).
Total nitrogen and total phosphorus inputs were calculated from riverine, direct sewage, direct trade and marine finfish aquaculture inputs. This allows an assessment of nutrient input source variability in each region.
Figure c shows the source of total nitrogen (annual load) for each SMR.

The data presented in Figure c show regional differences in total nitrogen inputs to the marine environment. The largest loads were to the Forth & Tay, Clyde, North East, Moray Firth and Solway where riverine sources make up the largest proportion of the load. Mention must also be made of the relatively large proportion of N coming from direct sewage sources in the Clyde and Forth & Tay regions, which reflect population density in these regions.
In the regions where loads are smaller, such as in the West Highlands, Outer Hebrides, Orkney and Shetland aquaculture dominates the apportionment of nitrogen load. However, data availability from rivers were sparse in these regions with only one monitoring location in the Outer Hebrides and none in Argyll and the Northern Isles.
Figure d details the annual load of total phosphorus for each SMR apportioned to aquatic source. For total phosphorus, the pattern is somewhat similar to total nitrogen over the period 2007-2017 with rivers, sewage and trade the more important sources in Central and East Coast regions and aquaculture more important in North West and Island regions. There are a few slight differences, with direct sewage inputs contributing a higher proportion of total P in the Clyde region than riverine sources. There are also a number of important trade P sources in the Moray Firth, although there has been a reduction in these inputs in recent years (Figure d).

Conclusion
In the Scottish Marine Regions receiving the highest inputs, there were no significant increasing trends observed in the period 2007-2017. These regions included the Clyde, Forth & Tay, North East and Moray, where riverine and sewage sources are the most prominent due to higher populations.
The regions where nutrient inputs are lowest are also those that have observed increasing total nitrogen and total phosphorus input trends over the assessment period. These are related to increased inputs of nutrients from marine finfish aquaculture and reflect the biomass of fish grown in these regions in recent years, with the exception of Shetland which had lower overall fish biomass in 2018 than 2008 (see Aquaculture assessment in Productive section).
Knowledge gaps
The dataset used in the assessment was developed following the OSPAR RID principles for regional OSPAR assessments. When aggregated to the scales required by the Scottish Marine Region assessment there were gaps in certain regions, particularly for riverine data. A methodology for determining atmospheric nutrient inputs at the SMR scale needs to be developed so that all inputs of nutrients can be assessed.
Status and trend assessment
The status and trend assessment is for eutrophication and includes, nutrient inputs, winter nutrient concentrations, chlorophyll concentrations and dissolved oxygen concentrations.
|
Region assessed |
Status with confidence |
Trend with confidence |
Comments |
|---|---|---|---|
|
Argyll |
  |
|
Status and trends have been given a confidence of 2 stars because there is limited dissolved oxygen data available in the region and this has been acknowledged as a knowledge gap in the current assessment of overall Eutrophication status. |
|
Clyde |
 |
|
The status green box with blue circle is due to a localised issue within the inner Clyde estuary where the dissolved oxygen is failing. Status and trends have been given a confidence of 2 stars because there is limited dissolved oxygen data available in the region and this has been acknowledged as a knowledge gap in the current assessment of overall Eutrophication status. |
|
Forth and Tay |
|
|
Status and trends have been given a confidence of 2 stars because there is limited dissolved oxygen data available in the region and this has been acknowledged as a knowledge gap in the current assessment of overall Eutrophication status There is a localised issue with the trend assessment due to increasing chlorophyll concentrations, but trend not reflected in other eutrophication parameters. |
|
Moray Firth |
|
|
Status and trends have been given a confidence of 2 stars because there is limited dissolved oxygen data available in the region and this has been acknowledged as a knowledge gap in the current assessment of overall Eutrophication status. |
|
North Coast |
|
|
Status and trends have been given a confidence of 2 stars because there is limited dissolved oxygen data available in the region and this has been acknowledged as a knowledge gap in the current assessment of overall Eutrophication status. |
|
North East |
|
|
The status green box with blue circle is due to a localised issue within the Ythan Estuary which is categorised as being eutrophic. The rest of the SMR is not impacted and not considered to be Eutrophic. Status and trends have been given a confidence of 2 stars because there is limited dissolved oxygen data available in the region and this has been acknowledged as a knowledge gap in the current assessment of overall Eutrophication status. |
|
Orkney Islands |
|
|
Status and trends have been given a confidence of 2 stars because there is limited dissolved oxygen data available in the region and this has been acknowledged as a knowledge gap in the current assessment of overall Eutrophication status There is a localised issue of increasing nutrient inputs in the region associated with increasing aquaculture. This increasing input is not impacting nutrients across the SMR with no statistically significant trend in winter DIN observed. |
|
Outer Hebrides |
|
|
There is a localised issue of increasing nutrient inputs in the region associated with increasing aquaculture. This increasing input is not impacting nutrients across the SMR with no statistically significant trend in winter DIN observed. Status and trends have been given a confidence of 2 stars because there is limited dissolved oxygen data available in the region and this has been acknowledged as a knowledge gap in the current assessment of overall Eutrophication status. |
|
Shetland Isles |
|
|
Status and trends have been given a confidence of 2 stars because there is limited dissolved oxygen data available in the region and this has been acknowledged as a knowledge gap in the current assessment of overall Eutrophication status. |
|
Solway |
|
|
Status and trends have been given a confidence of 2 stars because there is limited dissolved oxygen data available in the region and this has been acknowledged as a knowledge gap in the current assessment of overall Eutrophication status. |
|
Western Islands |
|
|
Status and trends have been given a confidence of 2 stars because there is limited dissolved oxygen data available in the region and this has been acknowledged as a knowledge gap in the current assessment of overall Eutrophication status. |
This Legend block contains the key for the status and trend assessment, the confidence assessment and the assessment regions (SMRs and OMRs or other regions used). More information on the various regions used in SMA2020 is available on the Assessment processes and methods page.
Status and trend assessment
|
Status assessment
(for Clean and safe, Healthy and biologically diverse assessments)
|
Trend assessment
(for Clean and safe, Healthy and biologically diverse and Productive assessments)
|
||
|---|---|---|---|
 |
Many concerns |
No / little change |
|
 |
Some concerns |
Increasing |
|
 |
Few or no concerns |
Decreasing |
|
| |
Few or no concerns, but some local concerns |
No trend discernible |
|
 |
Few or no concerns, but many local concerns |
All trends | |
 |
Some concerns, but many local concerns |
||
 |
Lack of evidence / robust assessment criteria |
||
| Lack of regional evidence / robust assessment criteria, but no or few concerns for some local areas | |||
 |
Lack of regional evidence / robust assessment criteria, but some concerns for some local areas | ||
| Lack of regional evidence / robust assessment criteria, but many concerns for some local areas | |||
Confidence assessment
|
Symbol |
Confidence rating |
|---|---|
|
Low |
|
|
Medium |
|
|
High |

Assessment regions
 and the Scottish Offshore Marine Regions (OMRs, O1 – O10)")
Key: S1, Forth and Tay; S2, North East; S3, Moray Firth; S4 Orkney Islands, S5, Shetland Isles; S6, North Coast; S7, West Highlands; S8, Outer Hebrides; S9, Argyll; S10, Clyde; S11, Solway; O1, Long Forties, O2, Fladen and Moray Firth Offshore; O3, East Shetland Shelf; O4, North and West Shetland Shelf; O5, Faroe-Shetland Channel; O6, North Scotland Shelf; O7, Hebrides Shelf; O8, Bailey; O9, Rockall; O10, Hatton.
 Regions. These have been used as the assessment areas for hazardous substances.")
, Regions.")