

What, why and where?
Aquaculture is diverse and provides a range of seafood products:
- Finfish – salmon, rainbow trout, brown trout, halibut, wrasse and lumpfish
- Shellfish – mussels, Pacific oysters, native oysters, queen scallops and king scallops
- Seaweed (see separate Seaweed Harvesting & Cultivation assessment).
, all Scotland. Source: Marine Scotland.")
Marine based Scottish aquaculture is dominated by Atlantic salmon production by weight and value (accounting for around 97% by value in 2018). In 2017 Scottish salmon was Scotland and the UK’s number one food export. Mussels, which filter about 2 – 3 litres of sea water per hour, are the main shellfish species produced (95% of shellfish production in 2018). The 2018 aquaculture production was similar to 2011 for both Atlantic salmon and mussels (Figures 1 and 2).
, all Scotland. Source: Marine Scotland.")
All farms must meet strict guidelines to ensure that the environmental effects are assessed and managed safely. Since 1 April 2007 all new fish and shellfish farm development has required planning permission under the Town and Country Planning Marine Fish Farming (Scotland) Order 2007 from the relevant Planning Authority. Most finfish developments require to be screened on the need for an Environmental Impact Assessment. Bivalve mollusc farming is categorised as one of the most environmentally benign methods of food production (SARF, 2014).
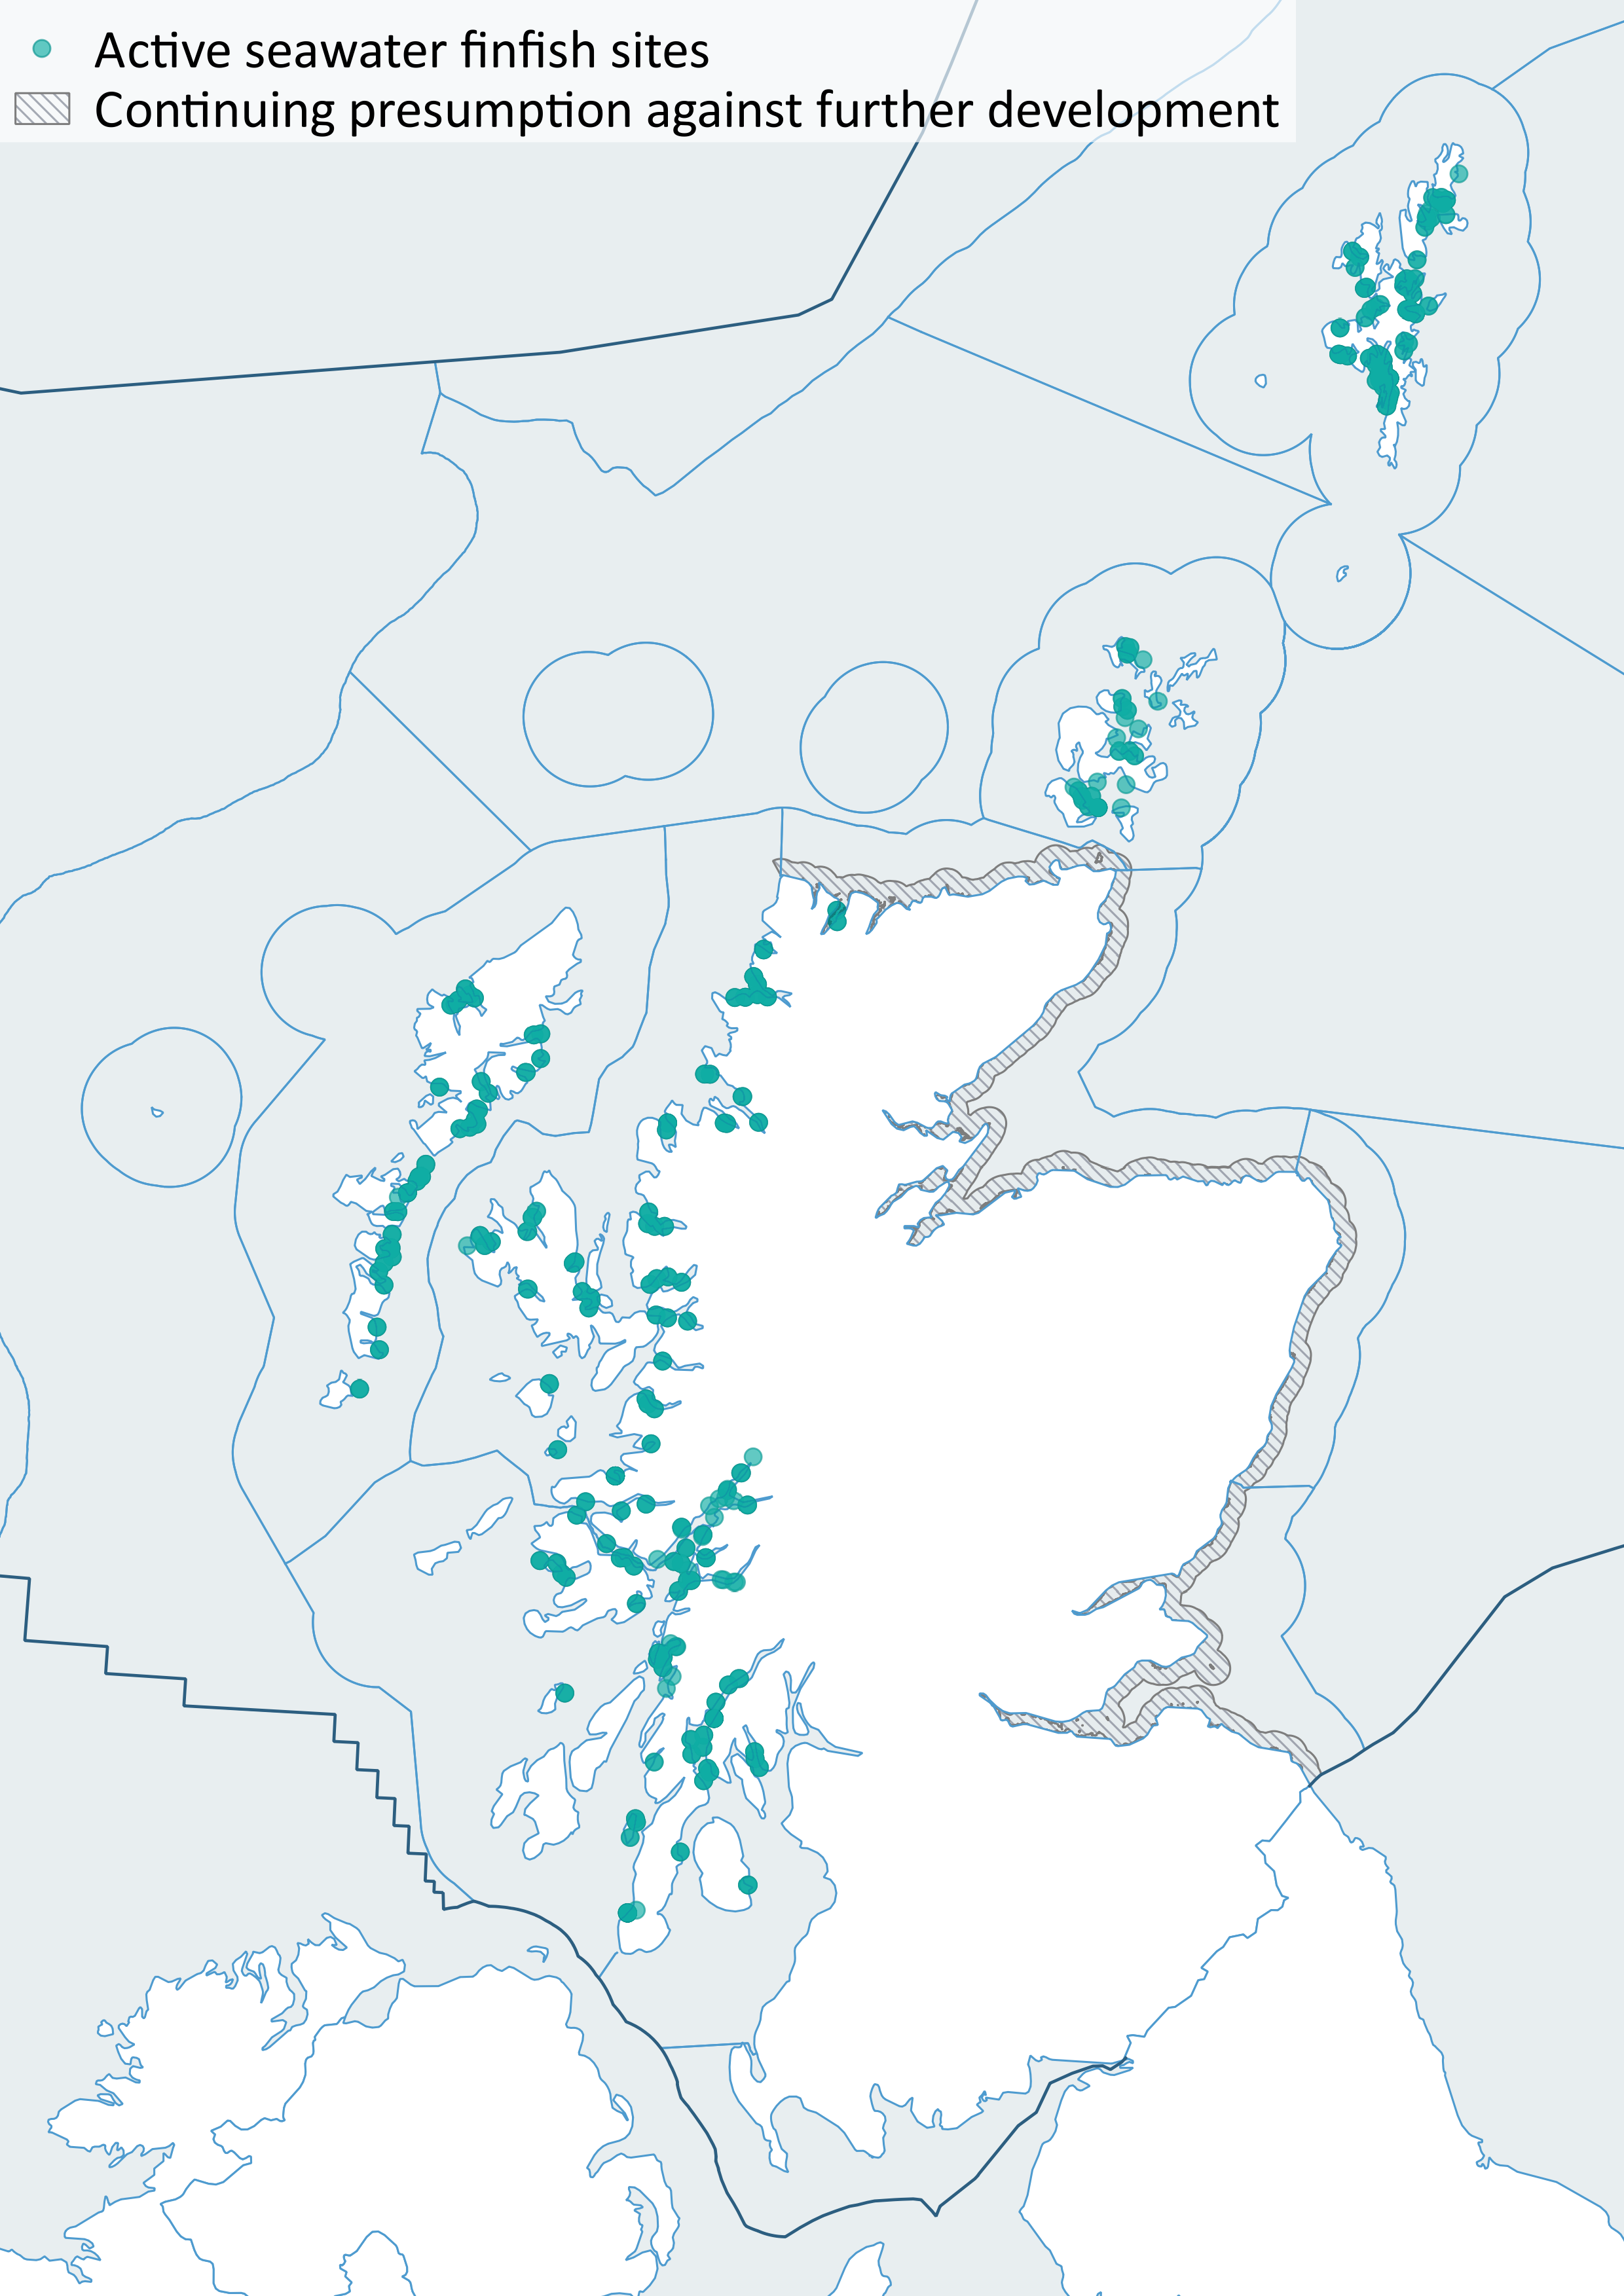
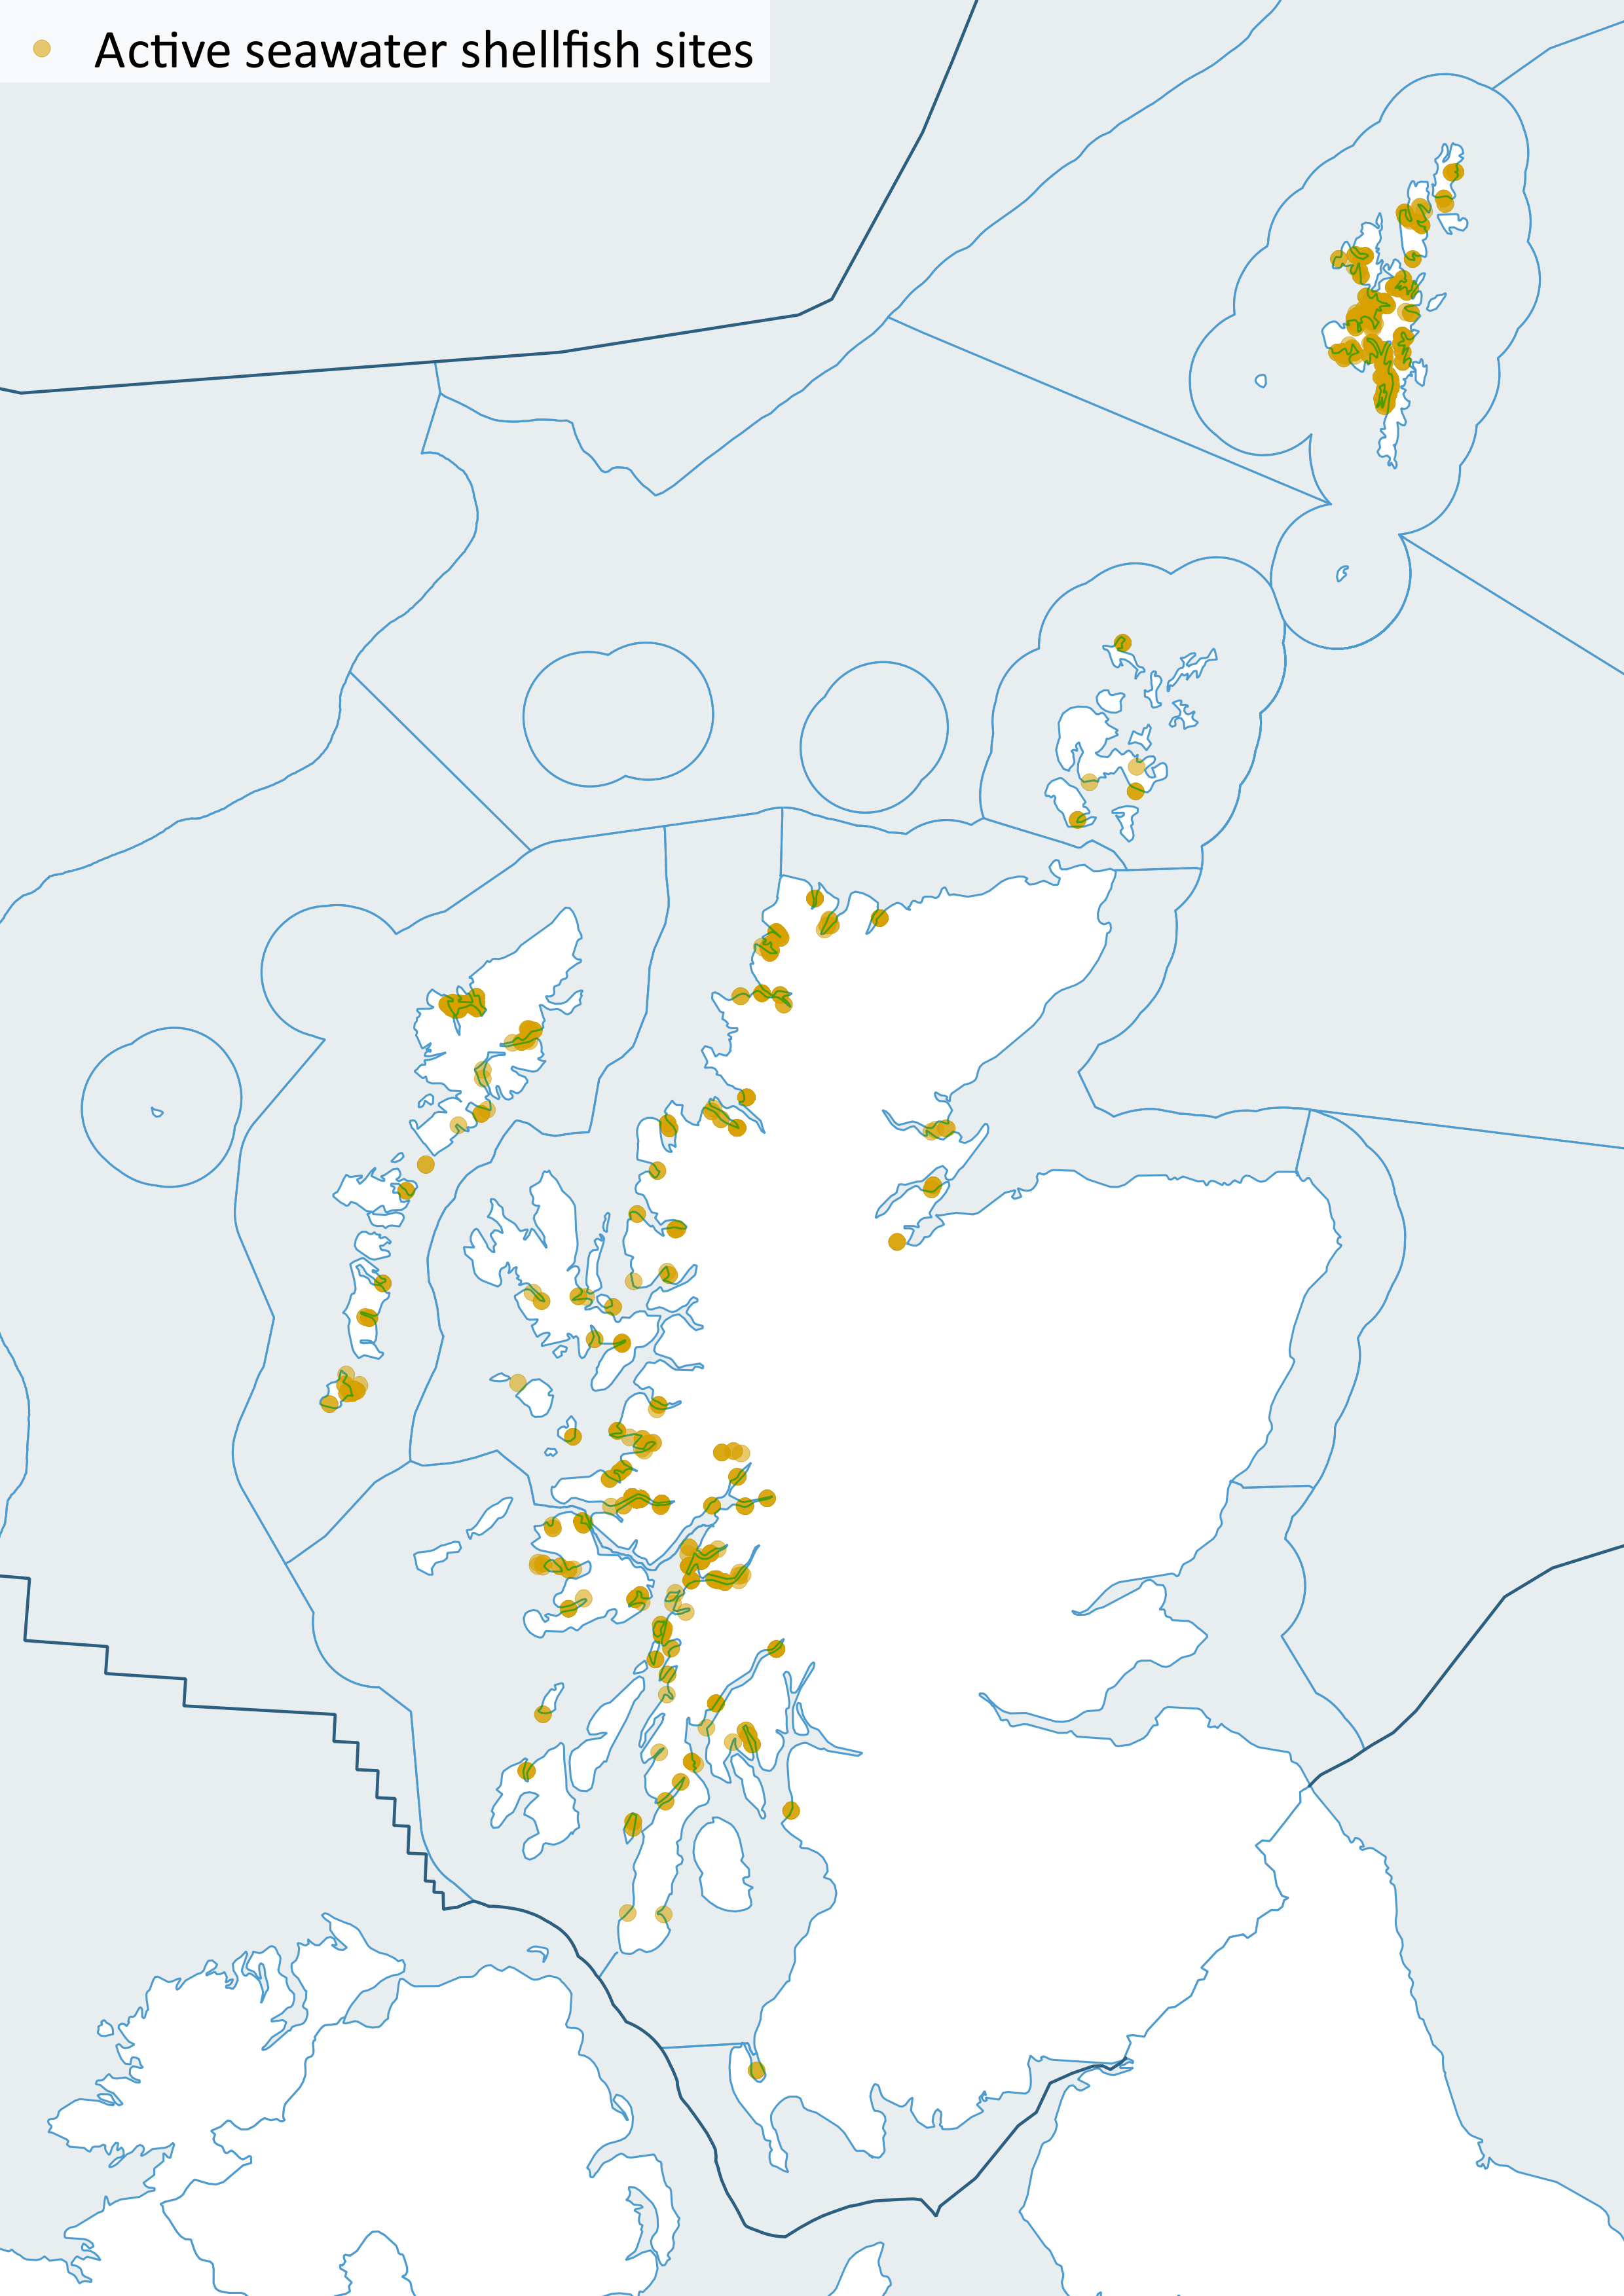
Areas of coastal waters are categorised on the basis of Marine Scotland predictive models to estimate environmental sensitivity of sea lochs and so aid the decision making in the location of sites. The locational guidance is updated regularly. The location of active aquaculture sites are shown in Figure 3 (finfish) and Figure 4 (shellfish). There is a continuing presumption against further marine finfish farm developments on the north and east coasts to safeguard migratory fish species.
UK aquaculture is an efficient user of energy and resources. While much of the Scottish aquaculture production is exported, aquaculture also makes an important contribution to food security. To meet the Food Standards Scotland and National Health Service currently recommended two portions of fish a week per person, significant growth is needed in aquaculture production. It is also important because of its capacity to produce food rich in omega-3 oils that help to promote health.
Production figures
As well as sea-based fish farming there is also a land-based freshwater industry which is not covered in this assessment. Production figures in other publications may differ slightly if they include freshwater production.
Scotland is the world’s 3rd largest producer of farmed Atlantic salmon (behind Norway & Chile). In 2018, Scotland produced 156,025 tonnes of Atlantic salmon (Figure 1), 3,363 tonnes of marine rainbow trout (Figure a) and a small amount of brown trout and halibut. Lumpsucker (14 tonnes) and ballen wrasse (6 tonnes) were also produced in 2018 as cleaner fish mainly for use by the marine Atlantic salmon sector where they are used as a biological control for parasites. Production statistics are from the annual Scottish Fish Farm Production Survey 2018 (Scottish Government, 2019a).

Shellfish production was dominated by mussels with 6,874 tonnes being produced in 2018 (Figure 2). Pacific oyster (4,031,000 shells) (Figure b), native oyster (142,000 shells), scallop (31,000 shells) and queen scallop (18,000 shells) were also cultured. Production statistics are from the annual Scottish Shellfish Farm Production Survey 2018 (Scottish Government, 2019b).
, all Scotland. Source: Marine Scotland.")

With 5.8 percent annual growth rate since 2010, aquaculture continues to grow faster than other major food production sectors globally. In 2016, world aquaculture production increased by 4 million tonnes over the previous year. By 2030, the world will eat 20% more fish (or 30 million tonnes live equivalent) than in 2016. Aquaculture production in 2030 is projected to reach 109 million tonnes, a growth rate of 37 percent over 2016 (FAO, 2018).
Regional production
Aquaculture production by Scottish Marine Region from 2009 to 2018 is shown in Figure d (Salmon), Figure e (Mussels) and Figure f (Pacific oyster).
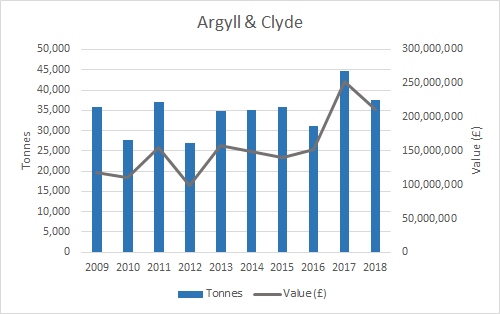
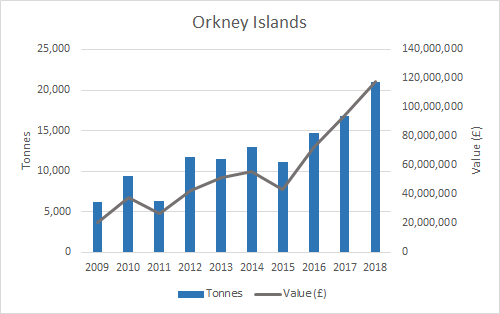
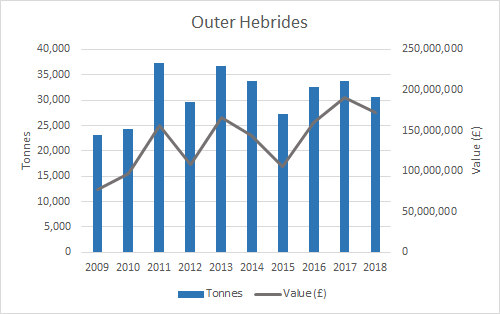


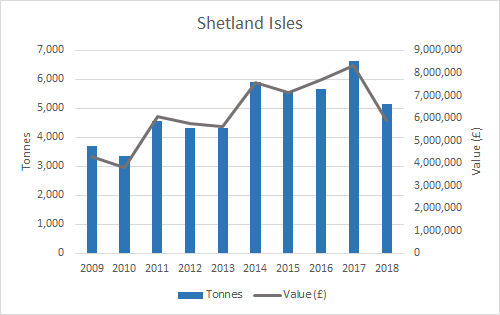
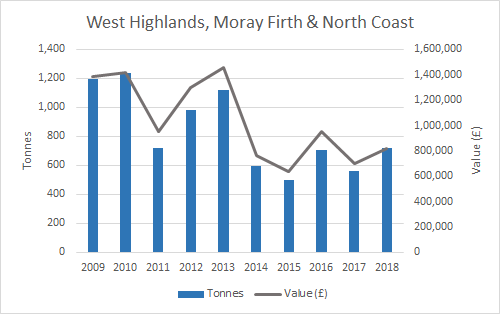

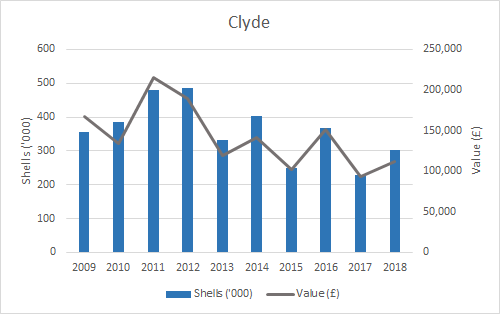

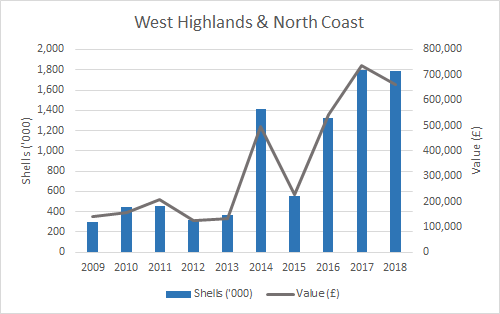
Figure f: Weight and value of Pacific oyster production (2009 - 2018) by Scottish Marine Region. Source: Marine Scotland.
Consenting process
New fish farm sites are subject to local authority planning permission. The authorities deal with each new fish farm site on its merits through the terrestrial planning process. Advice is provided by statutory consultees including Scottish Environment Protection Agency (SEPA), Marine Scotland and Scottish Natural Heritage together with representations from other interested parties and the general public. A fish farm also needs up to 4 further consents to operate, issued by Marine Scotland, SEPA, and a Crown Estate Scotland lease (see Marine Scotland web site).
The decision making process will also take into account the locational guidance issued by Marine Scotland and the presence of disease management areas, which were established in 2000 based on separation distances around active farms taking into account tidal excursions and other epidemiological risk factors.
Where a farm is granted planning permission, the local authority may impose conditions on the development to manage its effects on the environment. The Scottish Government’s response to the Rural Economy and Connectivity Committee report on Salmon Farming in Scotland (29 January 2019) included that, as part of any future request for planning advice, Marine Scotland will now expect a condition requiring an Environmental Management Plan (EMP) to be delivered for any consents for marine aquaculture planning applications (when there is/or there is potential for wild/farmed fish interaction).
Challenges
There are many challenges to fish and shellfish farming, these include:
- Wild fish used in feed: remains an issue but actions by the industry, recognition of efficient feed conversion, and other considerations may counteract criticism.
- Farmed fish escaping from nets, see below.
- Seals eating farmed fish: see below.
- Sea lice, see below.
Escapes
There are occasions when farmed fish will escape from their nets. Escapes may occur due to storm damage, predator damage and human error. To address concerns around escapes – Scottish Government published ‘A Technical Standard for Scottish Finfish Aquaculture’ in 2015 which sets out technical requirements for all species of finfish farm equipment across Scotland:
- Once farmed salmon have escaped into the wild they are difficult to recapture and it is difficult to mitigate potential environmental impact. The best form of mitigation is adherence to appropriate technical standards to prevent escapes.
- The standard is designed to be used alongside operational procedures and staff training to ensure equipment is used and maintained appropriately and procedures followed correctly.
In March 2018, the Improved Containment Working Group consisting of industry and Government reconvened and work is ongoing to:
- update the Standard;
- discuss how compliance with the standard can be achieved;
- discuss the merits of investing in training on the standard.
The instances and number of fish involved are reported on the Scotland’s Aquaculture web site. Table a shows recent seawater escapes, from 77 instances.
|
Local authority
|
Total seawater escapes 2011-18
|
|
|
Argyll and Bute
|
77,437
|
11%
|
|
Highland
|
32,203
|
4%
|
|
Orkney
|
25,623
|
3%
|
|
Shetland
|
576,974
|
78%
|
|
Western Isles
|
24,887
|
3%
|
|
Total
|
737,124
|
|
Seal licensing
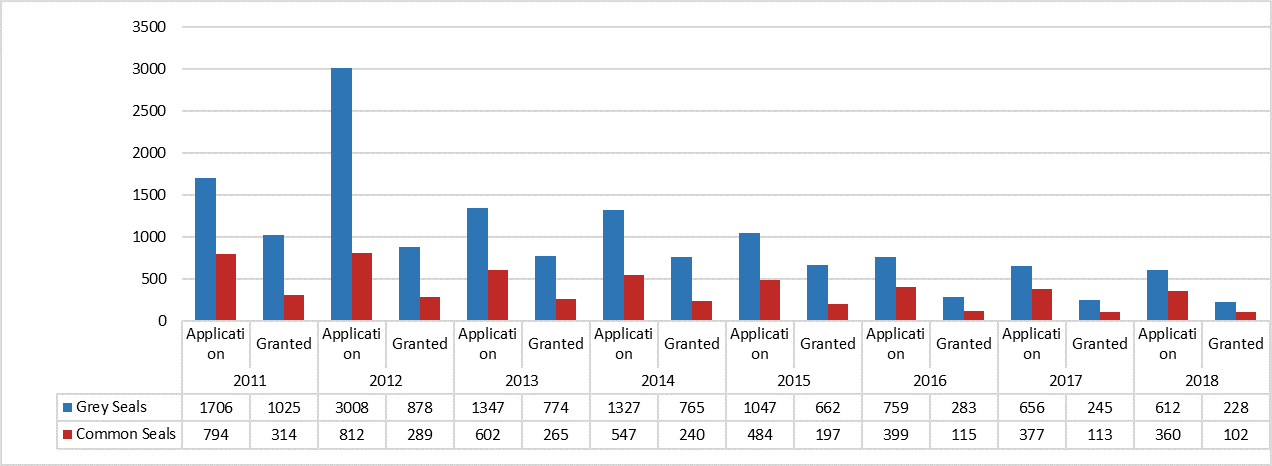
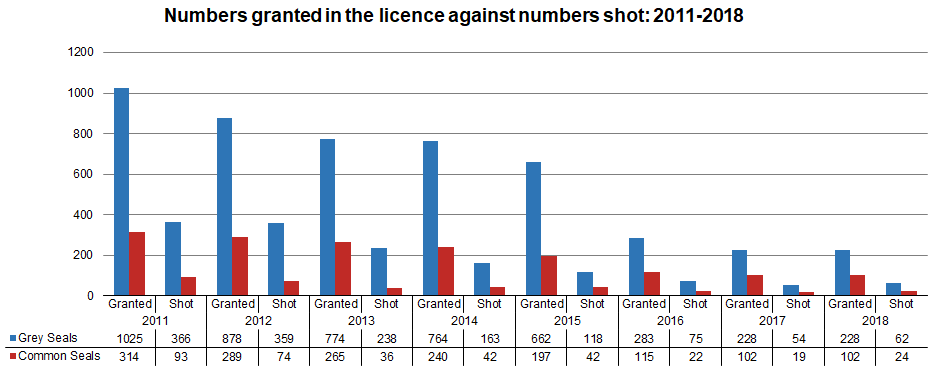
On 31 January 2011, Part 6 of the Marine (Scotland) Act 2010 came into force which seeks to balance seal conservation with sustainable fisheries and aquaculture. A licensing system provides for the shooting of seals in certain circumstances. Marine Scotland publishes details of the number of licences issued and seals shot. Figure g shows a general decline in both the numbers of applications and licences granted between 2011 and 2018. In addition Figure h shows a steady decline in the numbers of seals shot (red trend line).
Sea lice
Despite challenges, the salmon farming industry has reported that sea lice averages in 2018 were their lowest for 6 years. Monthly sea lice reports are available from Scottish Salmon. Scottish Government is committed to improving sea lice management. As part of Scotland’s Farmed Fish Health Framework (Scottish Government, 2018), Scottish Government undertook a review of farmed fish sea lice policy. This resulted in strengthening of the sea lice management regime by lowering the sea lice reporting and intervention thresholds. If a reporting threshold i.e. the weekly average number of female sea lice (Lepeophtheirus salmonis) per fish on a site reaches or exceeds 2, it must be reported to the Fish Health Inspectorate at which point there will be increased monitoring and surveillance. If a threshold of 6 female sea lice per fish is reached or exceeded, Fish Health Inspectorate will intervene with a range of actions which can culminate in the issuing of enforcement notices if numbers are not reduced to below reporting thresholds. In 2020, sea lice reporting legislation will be introduced which will require an average adult female sea lice report, weekly in arrears, to be submitted to Scottish Government. Unless there is evidence to the contrary the reporting and intervention levels will be reduced to 2 and 4 average adult female lice per fish respectively in 2021.


Innovation and funding for research and development
The Scottish Aquaculture Innovation Centre (SAIC) helps the Scottish aquaculture industry to tackle challenges and accelerate sustainable growth by connecting industry and academics, and funding and supporting commercially relevant, collaborative research and knowledge exchange. During Phase 1 of their funding programme (2014 to 2019), SAIC built on the Scottish Government’s original investment of £11.1 m with 34 projects worth £27.2 m, attracting £15.2 m from industry and £5.2 m from other sources.
Scottish Government has awarded £15m (£11.25 m from EU and £3.75 m from SG) in European and Maritime Fisheries Fund funding to 54 Aquaculture projects since 2016, unlocking over £30 m total sector expenditure on innovation in the fish and shellfish farming sectors.
Contribution to the economy
While much of the Scottish aquaculture production is exported, aquaculture also makes an important contribution to food security.
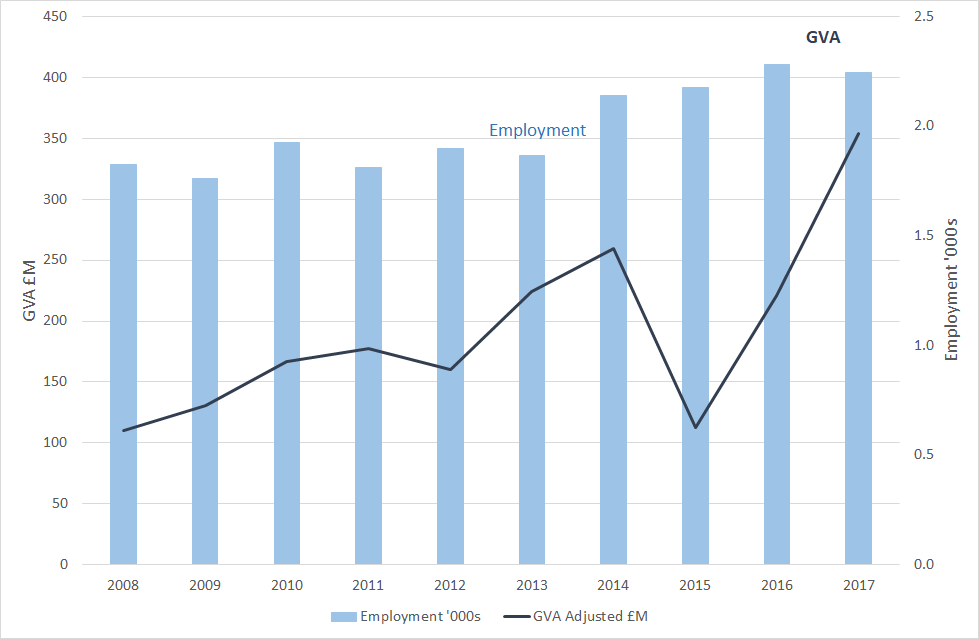
Scotland’s Marine Economic Statistics (Scottish Government, 2019c) reported that, in 2017, aquaculture generated £354 million in Gross Value Added (GVA), a 58% increase on the 2013 value of £224 million. The longer GVA term trend from 2008 to 2017 tripled from £110 million. GVA is the value of goods and services produced minus the cost of raw materials and other inputs used to produce them. Figure 5 shows that GVA from aquaculture can be volatile from year-to-year, with impacts such as disease challenges in 2015 resulting in lower turnover and higher costs. From 2008 to 2017 aquaculture employment increased by 23%.
Scotland’s Marine Economic Statistics and figure 5 relate to the direct contributions of relevant activities to Scotland's economy and do not include activities of related supply chains. Scotland’s aquaculture broader supply chain includes upstream businesses supplying farms with inputs such as feed and equipment, and downstream processing and handling businesses, including the retail and food service sectors. Impacts across the supply chain have been estimated to be around £620M in GVA and 12,000 jobs across the Scottish economy.
Aquaculture statistics are presented by Scottish Marine Region (SMR) as far as possible. However, even at SMR level some regions have to be merged due to commercial confidentiality. The figures in Table b show that salmon production is fairly evenly distributed between five regions, while mussels are predominantly farmed around the Shetland Isles, with oysters mostly farmed in Argyll, West Highlands and the North Coast.
2014 and 2018 were not an atypical years for aquaculture production and the large changes below reflect real changes. In recent years, Orkney sites have shifted towards producing larger salmon which fetch higher prices. Oyster production in the Outer Hebrides is the result of development and consolidation of sites resulting in a significant production increase in recent years. The drop in mussel production in the Argyll and Clyde region is due to a business swapping from growing full grown mussels to selling part grown mussels.
|
Atlantic salmon production by SMR (by value) |
||||
|
|
|
Change over last 5 years 2014 to 2018
|
||
|
SMR
|
2018 value
£
|
#
|
%
|
Trend
|
|
Argyll & Clyde
|
211,158,780
|
61,741,308
|
41%
|
↑
|
|
Orkney Islands
|
117,982,280
|
62,322,392
|
112%
|
↑
|
|
Outer Hebrides
|
172,660,840
|
28,374,040
|
20%
|
↑
|
|
Shetland Isles
|
202,381,610
|
4,293,242
|
2%
|
↔
|
|
North Coast & West Highlands
|
174,237,240
|
-43,092,216
|
-20%
|
↓
|
|
All Scotland
|
878,420,750
|
113,638,766
|
15%
|
↑
|
|
Mussel production by Scottish Marine Region (by value) |
||||
|
|
|
Change over last 5 years 2014 to 2018
|
||
|
Scottish Marine Region
|
2018 value
£
|
#
|
%
|
Trend
|
|
Argyll & Clyde
|
502,996
|
-461,255
|
-48%
|
↓
|
|
Outer Hebrides
|
631,590
|
106,204
|
20%
|
↑
|
|
Shetland Isles
|
5,872,080
|
-1,692,658
|
-22%
|
↓
|
|
West Highlands, Moray Firth & North Coast
|
815,946
|
51,702
|
7%
|
↑
|
|
All Scotland
|
7,822,612
|
-1,996,007
|
-20%
|
↓
|
|
Pacific oyster production by Scottish Marine Region (by value) |
||||
|
|
|
Change over last 5 years 2014 to 2018
|
||
|
Scottish Marine Region
|
2018 value
£
|
#
|
%
|
Trend
|
|
Argyll
|
618,640
|
76,490
|
14%
|
↑
|
|
Clyde
|
112,480
|
-28,920
|
-20%
|
↓
|
|
Outer Hebrides
|
99,160
|
90,060
|
990%
|
↑
|
|
West Highlands & North Coast
|
661,190
|
166,640
|
34%
|
↑
|
|
All Scotland
|
1,491,470
|
304,270
|
26%
|
↑
|
Examples of socio-economic effects
- Significant food exports and food security.
- Employment in remote and rural coastal communities.
- Knowledge transfer from university to industry.
- Investment in community projects.
- Potentially restricting sea bed use by other users.
- Infrastructure may have a visual impact on coastal locations.
- Disease and escapes may have financial consequences.
Pressures on the environment
An OSPAR agreed list of marine pressures is used to help assessments of human activities in the marine environment. The marine pressure list has been adapted for use in Scotland via work on the Feature Activity Sensitivity Tool (FeAST). Aquaculture (finfish and shellfish) activities can be associated with 25 marine pressures – please read the pressure descriptions and benchmarks for further detail.
The list of marine pressures is used to help standardise assessments of activities on the marine environment, and is adapted from an agreed list prepared by OSPAR Intercessional Correspondence Group on Cumulative Effects (ICG-C) (see OSPAR 2014-02 ‘OSPAR Joint Assessment and Monitoring Programme (JAMP) 2014-2021’ Update 2018’ (Table II).
The Feature Activity Sensitivity Tool (FeAST) uses the marine pressure list to allow users to investigate the sensitivity of Scottish marine features. It also associates all pressures that might be exerted by a defined list of activities at a particular benchmark. The extent and impact of each pressure from a given activity will vary according to its intensity or frequency. The extent and impact of the pressure will also vary depending on the sensitivity of the habitat or species on which it is acting. The existence of multiple activities, and potentially multiple pressures, at specific locations will result in a cumulative impact on the environment.
FeAST is a developing tool. A snap shot from 2019 was used for the development of SMA2020. Please consult the FeAST webpage for further information and up to date information.
The list of pressures below associated with this activity is given in alphabetical order. Clicking the pressure will give you more information on the pressure and examples of how it may be associated with the activity.
Forward look
The Scottish Government supports the Aquaculture Industry Leadership Group as it seeks to deliver the industry’s growth strategy by 2030.
As with any sector that aspires to grow sustainably, there remain challenges, many of which for aquaculture are directly associated with the environment in which it works. There are other barriers to overcome such as ensuring a future workforce that is skilled and having appropriate infrastructures primarily in Rural Scotland such as housing, childcare and education.
The industry hopes to double production and value to the economy by 2030, including significantly increasing the number of jobs across the supply chain by 2030 (Scotland Food and Drink, 2016).
Global marine ecosystems will be affected by climate change (warming of the seas) and ocean acidification and the aquaculture industry will need to adapt. Scotland’s 10-year Farmed Fish Health Framework Scottish Government (2018) provides a strategic, evidence based approach to the short and long term improvement of fish health. A subgroup has been established under the Framework to consider climate change and ocean acidification and its potential impacts.
A Regulator’s Technical Working Group has been tasked with developing a practical framework for assessing the sea lice loading and management requirements taking account of the best available scientific understanding and the precautionary principle. The group comprises experts from the regulators - Marine Scotland, SEPA, SNH and representatives of local authorities.
It is intended that this framework will underpin future planning advice. Through the framework adaptive management based on enhanced monitoring will create an enabling environment for encouraging further aquaculture development where impacts can be mitigated.
Industry innovation is being supported by the Scottish Aquaculture Innovation Centre, which is helping to improve fish health by driving, sharing and nurturing innovation across its priority areas of action, including fish health and welfare, shellfish production, industry capacity and fish nutrition – particularly to develop feeds that optimise fish health and nutrition, and ingredients that promote a circular economy.
There is current interest in cultivating macro-algae, alongside existing fin-fish farm sites, as a basis for biofuel production and other non-food uses.
Economic trend assessment
The regional trends are based on the farm gate value of the aquaculture production. Figures for SMRs have been merged due to commercial confidentiality and the combinations of SMR vary according to fish species. Average prices (real) have been adjusted for inflation based on 2018 price estimates to enable comparisons to be made.
Change in farm gate value of aquaculture production between 2014 and 2018, by SMR or group of SMRs.
|
Atlantic salmon production by Scottish Marine Region (by value) |
|
|
|
Change over last 5 years 2014 to 2018 |
|
Scottish Marine Region |
Trend |
|
Argyll & Clyde |
|
|
Orkney Islands |
|
|
Outer Hebrides |
|
|
Shetland Isles |
|
|
North Coast & West Highlands |
|
|
All Scotland |
|
|
Mussel production by Scottish Marine Region (by value) |
|
|
|
Change over last 5 years 2014 to 2018 |
|
Scottish Marine Region |
Trend |
|
Argyll & Clyde |
|
|
Outer Hebrides |
|
|
Shetland Isles |
|
|
West Highlands, Moray Firth & North Coast |
|
|
All Scotland |
|
|
Pacific oyster production by Scottish Marine Region (by value) |
|
|
|
Change over last 5 years 2014 to 2018 |
|
Scottish Marine Region |
Trend |
|
Argyll |
|
|
Clyde |
|
|
Outer Hebrides |
|
|
West Highlands & North Coast |
|
|
All Scotland |
|
This Legend block contains the key for the status and trend assessment, the confidence assessment and the assessment regions (SMRs and OMRs or other regions used). More information on the various regions used in SMA2020 is available on the Assessment processes and methods page.
Status and trend assessment
|
Status assessment
(for Clean and safe, Healthy and biologically diverse assessments)
|
Trend assessment
(for Clean and safe, Healthy and biologically diverse and Productive assessments)
|
||
|---|---|---|---|
 |
Many concerns |
No / little change |
|
 |
Some concerns |
Increasing |
|
 |
Few or no concerns |
Decreasing |
|
 |
Few or no concerns, but some local concerns |
No trend discernible |
|
 |
Few or no concerns, but many local concerns |
All trends | |
 |
Some concerns, but many local concerns |
||
 |
Lack of evidence / robust assessment criteria |
||
| Lack of regional evidence / robust assessment criteria, but no or few concerns for some local areas | |||
 |
Lack of regional evidence / robust assessment criteria, but some concerns for some local areas | ||
| Lack of regional evidence / robust assessment criteria, but many concerns for some local areas | |||
Confidence assessment
|
Symbol |
Confidence rating |
|---|---|
|
Low |
|
|
Medium |
|
|
High |

Assessment regions
 and the Scottish Offshore Marine Regions (OMRs, O1 – O10)")
Key: S1, Forth and Tay; S2, North East; S3, Moray Firth; S4 Orkney Islands, S5, Shetland Isles; S6, North Coast; S7, West Highlands; S8, Outer Hebrides; S9, Argyll; S10, Clyde; S11, Solway; O1, Long Forties, O2, Fladen and Moray Firth Offshore; O3, East Shetland Shelf; O4, North and West Shetland Shelf; O5, Faroe-Shetland Channel; O6, North Scotland Shelf; O7, Hebrides Shelf; O8, Bailey; O9, Rockall; O10, Hatton.
 Regions. These have been used as the assessment areas for hazardous substances.")
, Regions.")