Background
Detoxification enzymes are proteins that the body produces to speed up the breakdown of harmful substances. In fish, detoxification enzymes are produced when the fish is exposed to contaminants in the marine environment. Fish can be exposed to these contaminants through contaminated water, sediment and diet. Exposure through sediment is considerable as contaminants can build up in sediments. The main sources of contaminants in Scotland’s seas are deposits from the atmosphere, industrial discharges and as a result of oil spills.
The measurement of EROD (7- ethoxyresorufin O-deethylase) activity in fish indicates if detoxification enzymes are present, and, therefore, if the fish may have been exposed to contaminants. EROD is measured in flatfish as they are closely associated with sediments where the contaminants accumulate. Contaminants that relate to EROD include PAHs, PCBs and dioxins. Further information on some of these chemicals can be found in their Hazardous Substances assessments. Other factors that affect EROD activity include species, sex, reproductive status, season and environmental temperature. These elements are taken into account in the sampling plan.
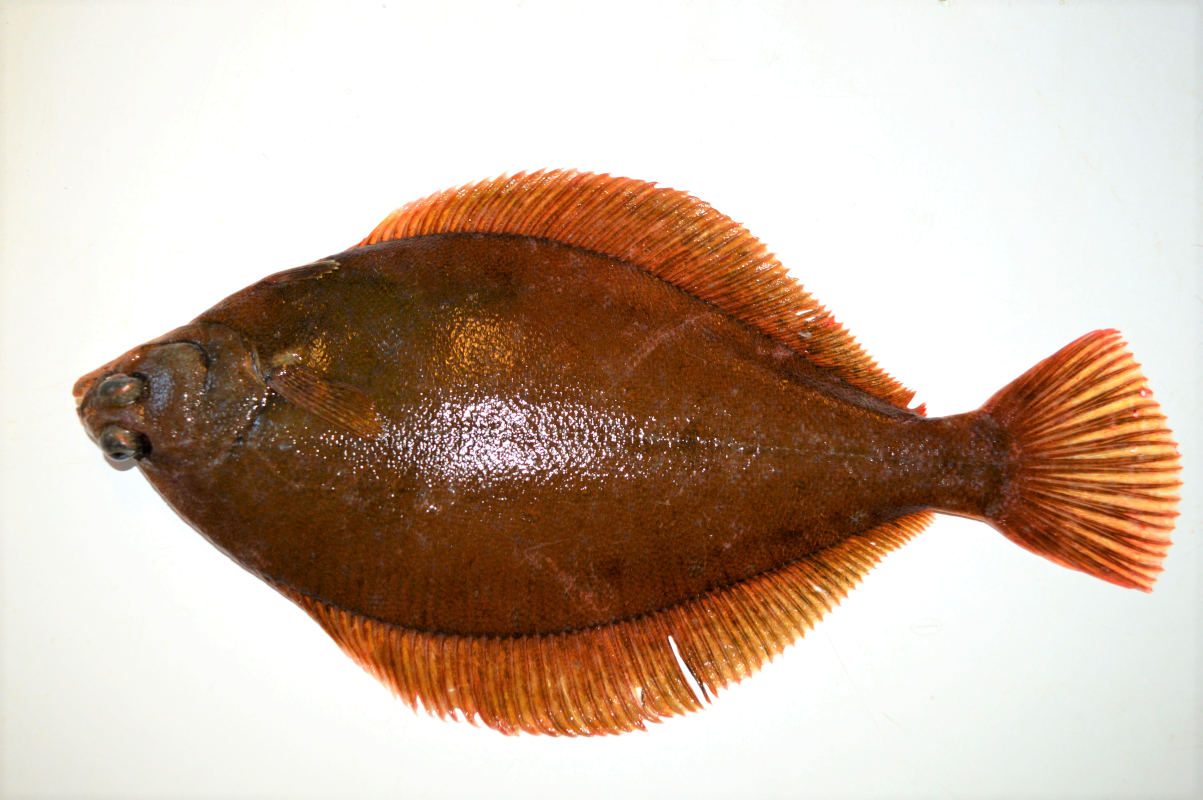
Figure 1: Dab are one of the fish species used for the determination of EROD in the waters around Scotland
EROD (7- ethoxyresorufin O-deethylase) is a biomarker used to measure the activity of a detoxification enzyme, CYP1A (Burke & Mayer, 1974). EROD activity increases upon exposure to contaminants that bind to the aryl hydrocarbon (Ah) receptor and stimulate the induction of CYP1A enzyme activity. Contaminants that induce EROD activity include some polycyclic aromatic hydrocarbons (PAHs), planar (dioxin-like) polychlorinated biphenyls (PCBs), dibenzo-p-furans and dibenzo-p-dioxins (Whyte, Jung, Schmitt & Tillitt, 2000).
The main sources of contaminants include atmospheric deposition, industrial discharges and oil spills. Once the chemicals are in the marine environment, fish can be exposed to them through ingestion or they can be directly absorbed into the body by uptake via the gills or dermal contact.
Upon exposure the production of CYP1A enzyme in the liver is increased, initiating detoxification pathways. As these enzymes rapidly metabolise the contaminants and the by products are readily excreted from the fish, analytical chemical methods cannot readily determine exposure. EROD activity therefore reflects the cumulative impact of all CYP1A inducing chemicals.
The induction of CYP1A can lead to the production of genotoxic metabolites (particularly those formed after the biotransformation of PAHs), and consequently can be used as an indicator that adverse effects may be occurring in exposed animals. In support of this, there is a considerable amount of field evidence correlating CYP1A induction with DNA damage, chemical carcinogenesis and other pathological conditions in marine organisms (ICES, 2011).
Other factors that affect EROD activity include sex, reproductive status, season and environmental temperature. In spawning females, CYP1A expression is suppressed due to interference from oestrogens. This may lead to underestimation of EROD activity, therefore caution is required when comparing results and these factors must be taken into account (Davies & Vethaak, 2012).
Monitoring of EROD activity is included in the Joint Assessment and Monitoring Programme (JAMP) recommended by OSPAR. This indicator is voluntary and not all contracting parties include this monitoring. However, it is recommended by the International Council for the Exploration of the Sea (ICES) and is included in the contaminants and effects monitoring that is undertaken in Scottish coastal and offshore areas as part of the UK Clean Seas Environment Monitoring Programme (CSEMP).
CSEMP is operated to ensure a coordinated monitoring programme across the United Kingdom. CSEMP contaminant and biological effects data (including EROD activity) are submitted to the UK Marine Environment Monitoring and Assessment National database (MERMAN) and from there to the ICES Environmental database. MSS undertakes sampling for EROD activity on their annual CSEMP cruise, these samples are processed in the laboratory and data are submitted to MERMAN. These data have been used in the assessment.
MSS collects samples for EROD analysis from common dab (Limanda limanda), plaice (Pleuronectes platessa) and flounder (Platichthys flesus) as part of an annual CSEMP winter cruise programme. The sampling stations are fixed locations (Figure 2), however, not all sites are sampled annually, sampling frequency varies dependent upon the site-specific risk(s) from hazardous substances (1, 3 or 6 years).
Sampling takes place in winter to avoid the spawning season and to maintain consistent time series. The EROD samples are collected and processed following ICES TIMES series protocol no. 57 (Stagg, McIntosh & Gubbins, 2016) analysing the supernatant from homogenised liver tissue (S9 fraction).
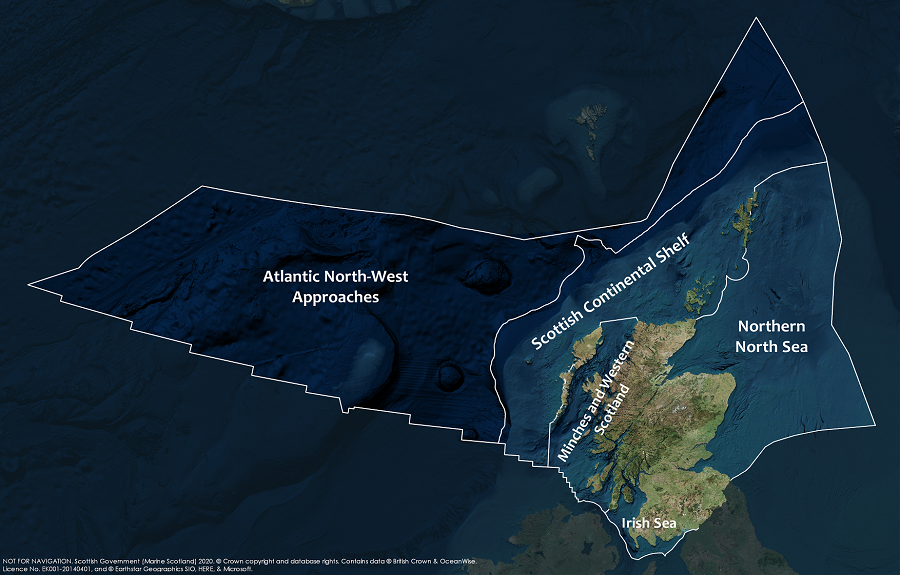
The 2019 assessment of CSEMP data (2002 – 2018) describes the trends and status of EROD activity at 14 fish monitoring locations covering three Scottish biogeographic regions: Northern North Sea, Minches and Western Scotland, and Irish Sea (Clyde and Solway) (Figure 2). See Introduction to SMA2020 to see how biogeographic regions relate to Scottish Marine Regions (SMRs) and Offshore Marine Regions (OMRs).
Monitoring data are assessed for status and trends following standard OSPAR approaches (Fryer & Nicolson, 1999; BODC, 2019). OSPAR Background Assessment Criteria (BAC) for EROD activity have been developed for flounder (Platichthys flesus), dab (Limanda limanda) and plaice (Pleuronectes platessa), the value varies between species and sex of fish (Table a).
OSPAR BACs were developed to test whether observed results are at background or elevated above background. No Environmental Assessment Criteria (EAC) have been developed for EROD activity as suppression of EROD activity has been reported at high concentrations of some contaminants. EROD is therefore a biomarker of exposure to CYP1A inducing contaminants and not necessarily an indicator of adverse effects.
|
Common name
|
Sex
|
Background Assessment Criteria
(pmol min-1 mg protein-1)
|
|---|---|---|
|
Dab
|
female
|
178.0
|
|
male
|
147.0
|
|
|
Flounder
|
male
|
24.0
|
|
Plaice
|
male
|
9.5
|
Assessments are made for many time series each consisting of EROD activity measurements in males or females of a single species at a single monitoring station. The results of the individual time series are synthesised to assess status and trends at the biogeographic regional level.
-
there is at least one year with data in the period 2013 to 2018;
-
there are at least three years of data over the whole time series;
-
a parametric model can be fitted to the data and used to estimate the mean concentration in the final monitoring year.
-
there is at least one year with data in the period 2013 to 2018;
-
there are at least five years of data over the whole time series;
-
a parametric model can be fitted to the data and used to estimate the trend in mean activity.
Information on how the individual time series are assessed for status and trends can be found here: https://www.bodc.ac.uk/projects/data_management/uk/merman/assessments_ and_data_access/csemp/
For the regional assessment, the results from the individual time series are combined. Essentially, a summary measure of status or trend is obtained from each time series. These are then modelled, using a linear mixed model, to estimate the mean status, or the mean trend in each biogeographic region. Only biogeographic regions with at least three monitoring stations with good geographic spread are considered in the regional assessment.
The trend analysis is further restricted to time series from monitoring stations that are classified as ‘representative’. ‘Baseline’ stations (those with near pristine conditions or only subject to very diffuse inputs) are omitted because any trends there will likely be caused by different processes to those at representative stations.
Similarly ‘impacted’ stations (those close to a point source) are omitted because trends there will likely reflect changes due to the point source, and will be ‘unrepresentative’ at the regional level. There are no restrictions on the time series used in the status analysis based on the classification of the monitoring station; time series from baseline, representative and impacted stations are all included.
MSS is accredited for the measurement of EROD activity to ISO 17025 under the United Kingdom Accreditation Services (UKAS). The ICES Working Group on Biological Effects of Contaminants (WGBEC) routinely organise EROD inter laboratory comparison exercises for the Biological Effects Quality Assurance in Monitoring Programme (BEQUALM). This quality assurance and the widely adopted use of the ICES TIMES protocol minimise transboundary effects.
Results
EROD activity in fish was assessed at 14 locations in Scottish marine waters, which covered three biogeographic regions - Northern North Sea, Minches and Western Scotland, and Irish Sea (Clyde and Solway) (Figure 2). No sampling points located in the Scottish Continental Shelf were included in the analysis. The time between sampling visits varied from annually to once every six years. The data used in the assessment were collected between 2002 and 2018.
For regional assessment and trend analysis, only biogeographic regions with a minimum of three suitable stations with a reasonable geographic spread were included. There were insufficient data for regional analysis of the Minches and Western Scotland region.
The level of EROD activity was assessed by comparing it to OSPAR Background Assessment Criteria (BAC). These assessment criteria were developed to determine if observed levels are at background or elevated above background. EROD activities above background levels indicate exposure to increased concentrations of organic contaminants.
EROD activity in fish from the Northern North Sea was below background (Figure 3), indicating little exposure to contaminants. Higher EROD activity was found in fish from the Irish Sea biogeographic region, where levels were above background indicating that the fish have been exposed to contaminants. A number of the sites sampled in the Irish Sea (Clyde and Solway) are around the Clyde, an area with a high level of industry which has resulted in high concentration of contaminants. The high level of EROD activity observed here is consistent with other Hazardous Substances assessments of contaminants (PAHs and PCBs).
Trends in EROD activity were assessed in Scottish biogeographic regions where there were at least five years of data from representative sites (Figure 4). There were sufficient data for trend analysis in the Northern North Sea and the Irish Sea (Clyde and Solway). Across both biogeographic regions, the level of EROD activity was stable.
The overall picture presented in 2011 was very similar to what the 2019 assessment has found, with highest EROD activity found in sites in the Clyde, which is consistent with the contaminant assessments.
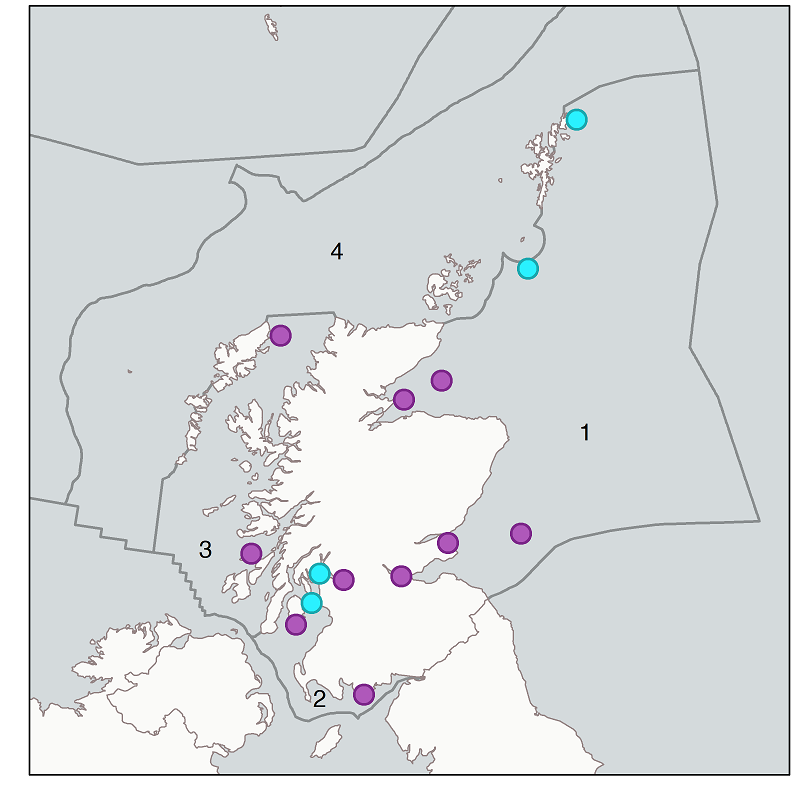
Figure 2: Monitoring stations included in the EROD status and trend assessments in fish per biogeographic region (grey lines). Magenta dots = stations used for trend and status assessments. Cyan dots = stations used for status assessment only. 1, Northern North Sea; 2, Irish Sea (Clyde and Solway); 3, Minches and Western Scotland; 4, Scottish Continental Shelf.
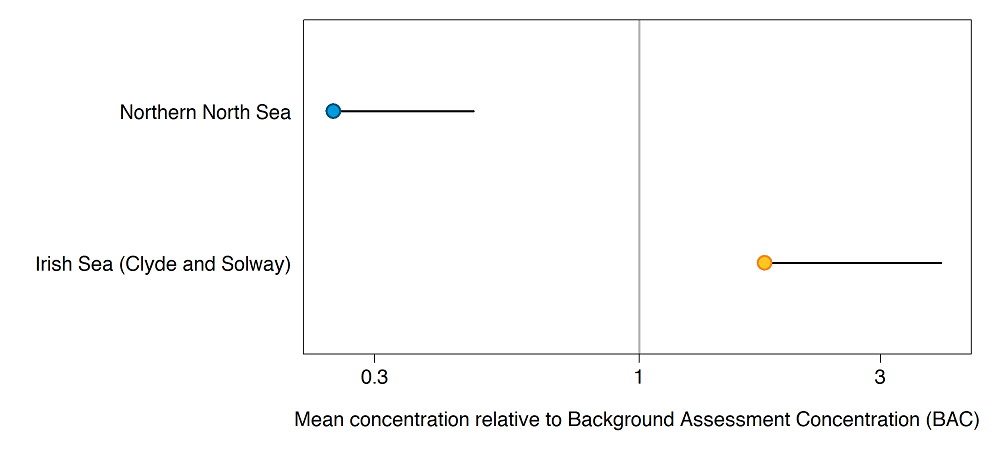
Figure 3: Status assessment; mean EROD activity in each Scottish biogeographic region relative to the OSPAR Background Assessment Criteria (BAC) (with 95% confidence limits) where the BAC value is 1. EROD activity is significantly below the BAC if the upper confidence limit is below 1. Blue = statistically significantly below the BAC. Orange = at or above the BAC.
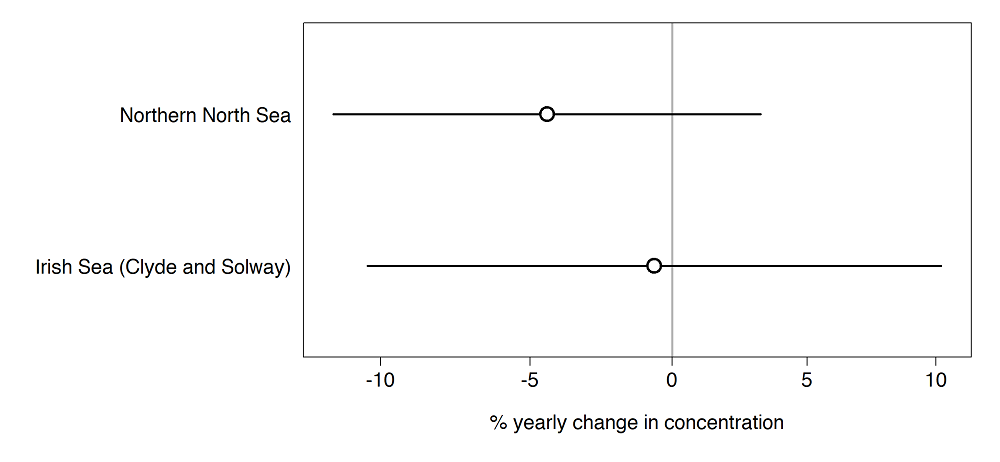
Figure 4: Trend assessment; percentage yearly change in EROD activity in each Scottish biogeographic region. There is a significant trend if the confidence limits does not cut the vertical line at 0. Upward trends (upwards triangle), downward trends (downwards triangle), no change (circle) and 95% confidence limits (lines).
The EROD activity was measured from dab, plaice and flounder from 14 locations throughout Scotland (Figure 2). From this, assessments of status and trends were made for a large number of EROD time series, each consisting of EROD activity measurements in males or females of a single species at a single monitoring station.
For a status assessment, the data are compared to assessment criteria (Table a). There are only assessment criteria available for male and female dab, male plaice and male flounder. There were 18 time series where a status assessment could be carried out and included in the regional assessment (Figure a) and 12 stations where a trend assessment could be carried out and included in the regional assessment (Figure b).

Figure a: Status Assessment of Individual time series; mean EROD activity in each Scottish biogeographic region relative to the OSPAR Background Assessment Criteria (BAC) where the BAC value is 1. The estimates for regions with insufficient geographic spread (and excluded from the regional analysis) are also shown. Blue = statistically significantly below the BAC. Orange = at or above the BAC.

Figure b: Trend Assessment of Individual time series; percentage yearly change in EROD activity in each Scottish biogeographic region. The estimates for regions with insufficient geographic spread (and excluded from the regional analysis) are also shown. Upward trends (upwards triangle), downward trends (downwards triangle), no change (circle).
Northern North Sea
Most individual time series from the Northern North Sea (80%, n=10) were below the BAC indicating that flatfish in these regions are not significantly exposed to contaminants that induce EROD activity. Two individual time series, from St Andrews Bay and a site within the Forth Estuary, exceeded the BAC. However, Figure a shows that the mean activity from both of these points was actually below the BAC (<1), although this was not statistically significant as the upper confidence limit exceeded the BAC (data not shown). Since a precautionary approach is taken, the status of these two time series is considered above the BAC. The individual trend analysis showed that no stations indicate an upward trend; all stations in the Northern North Sea are either not showing a trend or the EROD activity decreased significantly. A downward trend was observed in the Moray Firth, at both inner and outer sites. Overall, the regional assessment (Figure 2) found that EROD activity in the Northern North Sea is stable and below the BAC, indicating that flatfish in this area are not significantly exposed to contaminants which induce EROD activity.
Minches and Western Scotland
There were insufficient data to make a regional assessment of the Minches and Western Scotland biogeographic region due to too few sampling stations. There are only two sampling stations in this area, both were assessed as below the BAC (Figure a). Trend analysis showed the level of EROD activity at these two stations was stable (Figure b).
Irish Sea (Clyde and Solway)
The regional assessment of the Irish Sea (Clyde and Solway) concluded that EROD activity was above BAC indicating that flatfish in this area are exposed to planar organic contaminants. Of the individual time series 50% (n=6) exceeded the BAC, all of these had a mean activity level greater than the BAC.
A number of the sites sampled in the Irish Sea (Clyde and Solway) are around the Clyde, an area with a high level of industry, which has resulted in high concentration of contaminants. The high level of EROD observed here is consistent with other contaminant assessments, e.g. PAHs and PCBs. Trend analysis showed that EROD activity levels were stable. However, two sites in the Clyde, Holy Loch and Garroch Head, are considered ‘impacted’ stations and therefore removed for the regional trend assessment.
Impacted stations (those close to a point source) are omitted because trends there will likely reflect changes due to the point source, and will be ‘unrepresentative’ at the regional level. Holy Loch was historically home to multiple submarine bases and the Garroch Head site is traditionally heavily contaminated due to close proximity to a sewage sludge dump site. Although the data are not shown in Figure b, EROD activity in fish from Holy Loch remained stable and there was a significant downward trend at Garroch Head.
General Results
Throughout Scottish seas, EROD levels are generally acceptable as a majority of stations (68%, n=22) were below the BAC. However there are a few stations, especially in the Irish Sea (Clyde and Solway) where EROD activity is above the BAC and fish are being exposed to contaminants which increase EROD activity. The regional estimated mean percentage yearly change in activity ranged from -4.42 to -0.64% when assessed at the biogeographic region, indicating the EROD activity is stable.
There was not a regional assessment of EROD activity in Scotland’s Marine Atlas (Baxter et al., 2011). It is difficult to compare the 2019 regional assessment to the assessment that was made in 2011 as different methods were used in each assessment. In 2011 response ranges were calculated based on Scottish data from plaice and used for classification of sites by comparing mean EROD values. The OSPAR assessment criteria for EROD were only introduced in 2012 and the OSPAR BAC are more stringent than the background response range used in the 2011 Atlas. However, the overall picture presented in 2011 was very similar to what the 2019 assessment has found. The highest levels of EROD activity were detected in fish from the Irish Sea (Clyde and Solway) area specifically around the Clyde. The data used in the assessment in 2011 are incorporated into the 2019 assessment and trend analysis concluded that levels of EROD activity are stable.
Other international studies (Green et al., 2017; Burgeot et al., 2017; Giltrap, McHugh, Ronan, Wilson & McGovern, 2014) have reported similar findings - EROD activity is higher in fish from industrialised areas compared to control sites. However few regional assessments have been carried out at an international level.
MSS is accredited to ISO 17025 under the United Kingdom Accreditation Services (UKAS) for determination of EROD activity and routinely takes part in the Biological Effects Quality Assurance in Monitoring Programme (BEQUALM). Therefore, there is high confidence in the quality of the data used in this assessment. Recognised international protocols for sample collection, the EROD assay and data analysis are used and MSS has been generating these data successfully for a number of years. EROD was incorporated into the CSEMP programme in 2002 and there is high confidence in this method. The data set has improved since the 2011 Atlas assessment, including a wider geographic spread of data, a wider range of species sampled, and a more standardised approach to the assessment.
Scottish Marine Regions
Eleven Scottish Marine Regions (SMRs) were created by The Scottish Marine Regions Order 2015 which cover sea areas extending out to 12 nm. Regional assessments to support Regional Marine Plans are required to be developed for each SMR by the relevant Marine Planning Partnership.
The CSEMP sampling design is based on the biogeographic regions used within UK and Marine Strategy Framework Directive (MSFD) assessments and therefore there are insufficient data for a regional assessment for all SMRs.
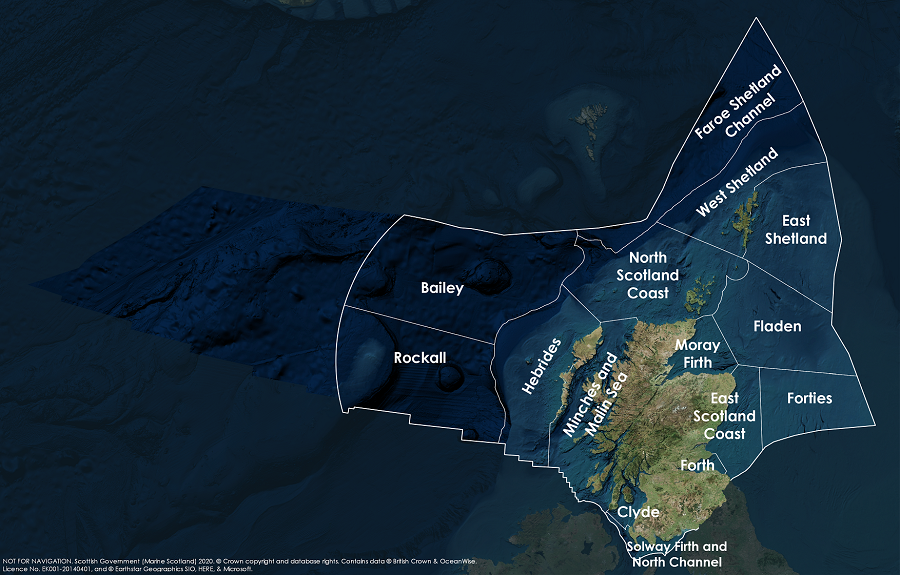
In particular, some SMRs have no or few (<3) monitoring stations. Only the Clyde SMR has sufficient data for a regional assessment and further work is needed to undertake an assessment at the SMR level. However, each SMR is contained within a biogeographic region or, in some cases, straddles two biogeographic regions (Shetland and Outer Hebrides).
Table b shows the SMR and the biogeographic region(s) they are in. Using the biogeographic assessment of EROD, it is likely that EROD activity will be above background and stable in the Clyde. Moving forward, additional monitoring stations would be required to enable regional assessments in each SMR.
|
SMR
|
Biogeographic region
|
|
Argyll
|
Minches and Western Scotland
|
|
Clyde
|
Irish Sea (Clyde and Solway)
|
|
Forth and Tay
|
Northern North Sea
|
|
Moray Firth
|
Northern North Sea
|
|
North Coast
|
Scottish Continental Shelf
|
|
North East
|
Northern North Sea
|
|
Outer Hebrides
|
Scottish Continental Shelf
Minches and Western Scotland
|
|
Orkney Islands
|
Scottish Continental Shelf
|
|
Shetland Isles
|
Northern North Sea (east Shetland)
Scottish Continental Shelf (west Shetland)
|
|
Solway
|
Irish Sea (Clyde and Solway)
|
|
West Highlands
|
Minches and Western Scotland
|
Conclusion
This assessment has only been carried out for two biogeographic regions in Scottish seas. There were not enough sampling stations of the appropriate species in the Minches and Western Scotland and Scottish Continental Shelf for a regional assessment.
The status assessment showed that the levels of EROD in the Northern North Sea were below background, however, elevated levels of EROD activity were found in the Irish Sea (Clyde and Solway). This indicates exposure to organic contaminants in fish from the Irish Sea (Clyde and Solway), which is consistent with other assessments of contaminants.
The PAH assessment also found highest concentrations of PAHs and PAH bile metabolites in the Irish Sea (Clyde and Solway); and the PCB assessment reported that PCB concentrations in sediment and biota were highest in the Irish Sea (Clyde and Solway).
The trend assessment concluded that levels of EROD activity are stable in the two regions assessed (the Irish Sea (Clyde and Solway) and Northern North Sea) between 2002 and 2018.
The 2019 EROD assessment was much more extensive than the assessment in Scotland’s Marine Atlas (Baxter et al., 2011), and the introduction of OSPAR assessment criteria allows transboundary comparison of EROD results. Despite these difficulties, the overall outlook of EROD activity in Scottish seas is similar now to 2011, with the highest levels found in the Irish Sea (Clyde and Solway). This area includes the Clyde, one of Scotland’s most industrialised sea areas. This finding is in keeping with other assessments for contaminants including PAHs and PCBs which also found highest concentrations in the Irish Sea (Clyde and Solway).
The CSEMP sampling design was based around the biogeographic regions used in OSPAR and MSFD assessments, therefore there are insufficient data for status and trend assessments of all SMRs. Each SMR will be within a biogeographic region, however in most SMRs there will be no or few stations.
Knowledge gaps
There is a lack of data to make a regional assessment for all Scottish biogeographic regions. To improve this, further fish sampling sites are required in the Minches and Western Scotland to give sufficient numbers of stations with good geographic spread. Another area lacking data is the Scottish Continental Shelf, a number of monitoring stations are required here for a regional assessment.
The analysis of EROD is only done on certain species of fish and it may not be possible to get sufficient number of sites with the appropriate species in all regions.
For other indicators Environmental Assessment Criteria (EAC) are used to assess environmental harm. An EAC has not been developed by OSPAR for EROD as suppression of EROD activity has been reported at high concentrations of some contaminants. However, development of an EAC would be useful for assessment of EROD activity, especially in situations where the mean EROD activity is below the BAC although not statistically significant as the upper confidence limit exceeds the BAC.
There were insufficient data for the assessment of SMRs. The direction since Scotland’s Marine Atlas (2011) and OSPAR Quality Status Report (2010) has been to establish sufficient coverage to make regional assessments at the biogeographic scale for OSPAR and MSFD assessments.
Additional sampling and analysis would be required if regional assessments were to be made for all SMRs. MSS is currently investigating this, however, EROD activity is only measured in fish and assessment criteria have only been developed for certain species, there may not be suitable species in all SMRs. Furthermore, due to the quantity of fish required for a reliable assessment where a minimum of 3 sites is essential, collecting this many fish from each SMR may not be possible.
Status and trend assessment
This status and trend assessment is an overall assessment for Contaminants in sediment and biota (PAHs, PCBs, PBDEs and metals in sediment and biota) and Biological effects of contaminants.
|
Region assessed
|
Status with confidence
|
Trend with confidence
|
Comments
|
|---|---|---|---|
|
Irish Sea
|
 |
|
Green square with red triangle for status indicates few or no concerns as a whole, but many local concerns, particularly in the Clyde, with some sites exceeding the EAC/EAC-proxy. Two stars for confidence in the status is due to lack of suitable assessment criteria for some determinands (metals in biota and some biological effects measurements)
|
|
Northern North Sea
|
 |
|
Two stars for confidence in the status is due to lack of suitable assessment criteria for some determinands (metals in biota and some biological effects measurements)
|
This Legend block contains the key for the status and trend assessment, the confidence assessment and the assessment regions (SMRs and OMRs or other regions used). More information on the various regions used in SMA2020 is available on the Assessment processes and methods page.
Status and trend assessment
|
Status assessment
(for Clean and safe, Healthy and biologically diverse assessments)
|
Trend assessment
(for Clean and safe, Healthy and biologically diverse and Productive assessments)
|
||
|---|---|---|---|
 |
Many concerns |
No / little change |
|
 |
Some concerns |
Increasing |
|
 |
Few or no concerns |
Decreasing |
|
 |
Few or no concerns, but some local concerns |
No trend discernible |
|
 |
Few or no concerns, but many local concerns |
All trends | |
 |
Some concerns, but many local concerns |
||
 |
Lack of evidence / robust assessment criteria |
||
| Lack of regional evidence / robust assessment criteria, but no or few concerns for some local areas | |||
 |
Lack of regional evidence / robust assessment criteria, but some concerns for some local areas | ||
| Lack of regional evidence / robust assessment criteria, but many concerns for some local areas | |||
Confidence assessment
|
Symbol |
Confidence rating |
|---|---|
|
Low |
|
|
Medium |
|
|
High |
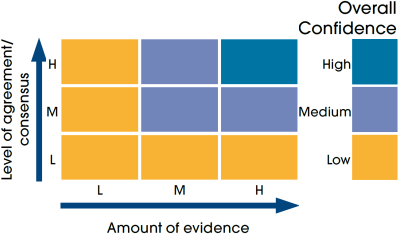
Assessment regions
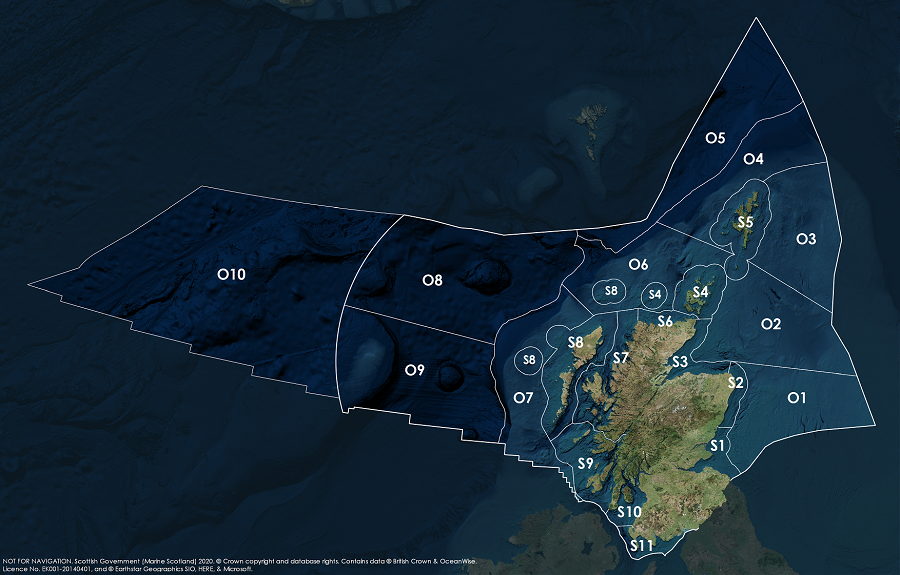
Key: S1, Forth and Tay; S2, North East; S3, Moray Firth; S4 Orkney Islands, S5, Shetland Isles; S6, North Coast; S7, West Highlands; S8, Outer Hebrides; S9, Argyll; S10, Clyde; S11, Solway; O1, Long Forties, O2, Fladen and Moray Firth Offshore; O3, East Shetland Shelf; O4, North and West Shetland Shelf; O5, Faroe-Shetland Channel; O6, North Scotland Shelf; O7, Hebrides Shelf; O8, Bailey; O9, Rockall; O10, Hatton.
