

Background
Seagrass communities (Figure 1) are highly productive important biological features. They are used as shelter, nurseries, spawning and feeding areas by birds, fish and invertebrates, and provide attachment for other organisms such as algae (Levinton, 1995). The presence of seagrass beds stabilises the sediment and helps protect coastlines from erosion (Potorouglou et al., 2017).
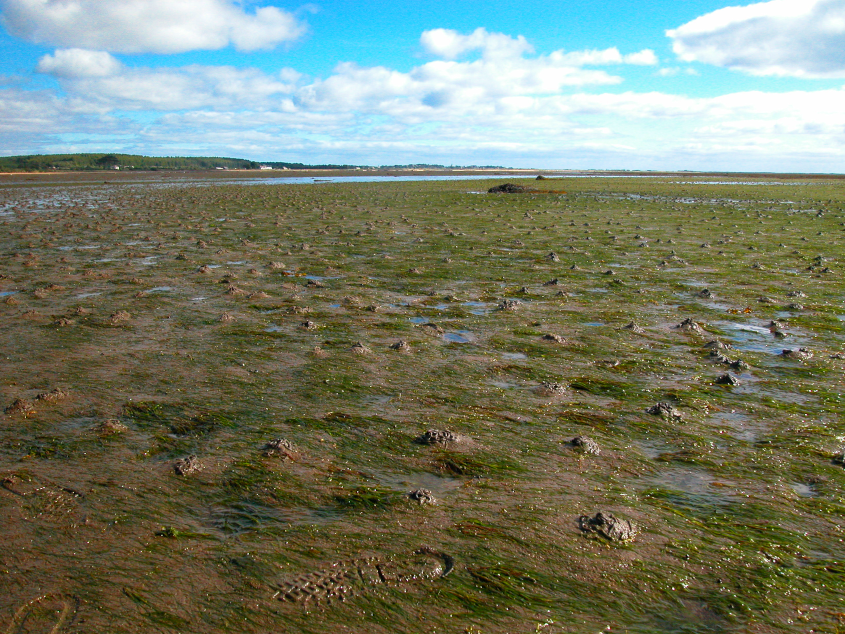
Figure 1: An intertidal seagrass bed at Cuthill Sands in the Dornoch Firth © NatureScot.
For these reasons Scotland has listed seagrass habitats as a Priority Marine Feature (PMF). Seagrasses (Zostera noltii, Zostera angustifolia and Zostera marina) are regarded as indicative of healthy environments and are particularly susceptible to pollution and nutrient enrichment. This makes them useful indicator species for impacted water quality. Although, absence of seagrass does not necessarily indicate adverse influences and some healthy sites can also show pronounced inter-annual changes.
Other pressures on seagrasses include:
- Coastal development.
- Physical impact e.g. bait digging and anchor damage.
- Habitat loss.
- Animal grazing.
- Non-native invasive species.
This assessment of intertidal seagrass uses results from SEPA’s initial trial of the Water Framework Directive (WFD) tool. The tool estimates the change in seagrass bed extent and percentage cover in order to provide an ecological status score for that waterbody. Knowledge of seagrass around Scottish coasts is poor due to limited historical seagrass records and inconsistent sampling techniques. The data described here provide baseline information, using the UK Technical Advisory Group (UKTAG) approved seagrass tool, against which future data can be assessed.
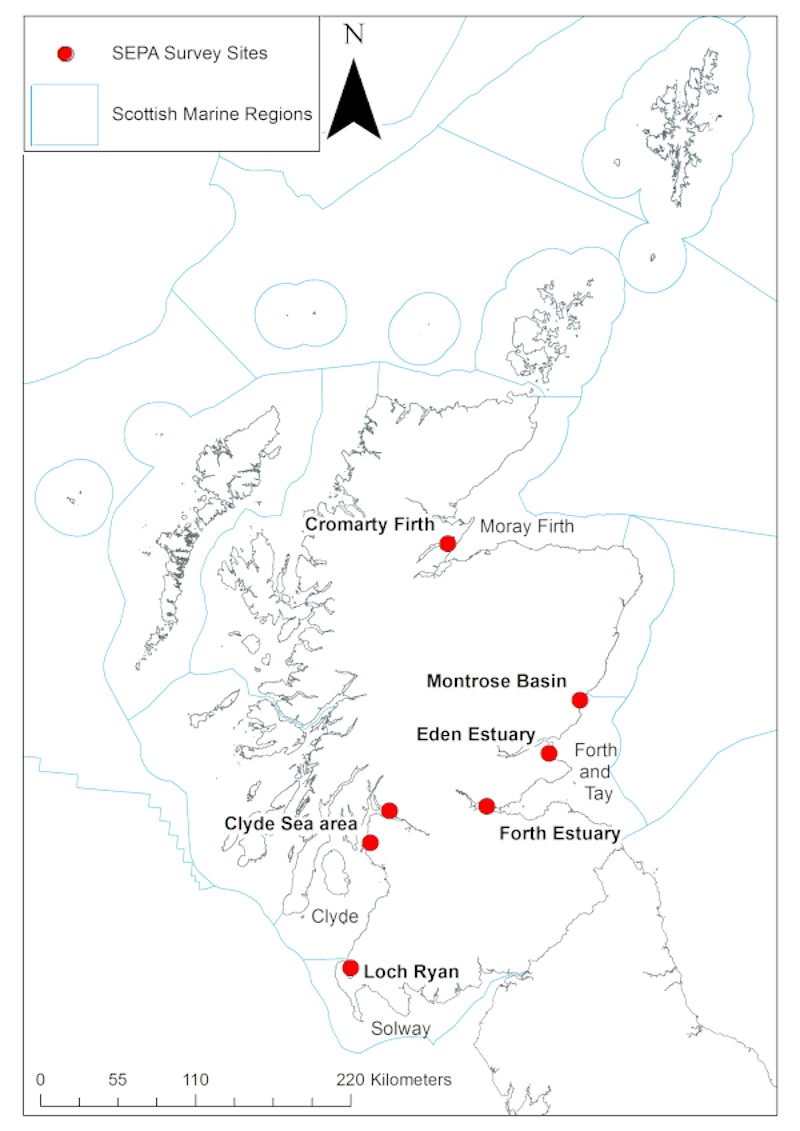
The sites trialled by SEPA are the Cromarty Firth, Montrose Basin, Eden Estuary, Forth Estuary, Clyde Sea area and Loch Ryan (Figure 2).
Globally the majority of seagrass species are completely marine with only a few species extending into the intertidal zone (Barnes & Hughes, 1999). In the UK only five species of seagrass are found: three species of Zostera (Davidson et al., 1991) and two species of Ruppia. Ruppia spp. are more often regarded as seagrass associates and not part of the traditional seagrass arrangement (Kuo & den Hartog, 2001) but their environmental preferences very similar to that of Zostera spp. and they may occur together (Foden & Brazier, 2007). For the purposes of the WFD both genera are monitored.
The three species of Zostera are: Z. noltii, Z. angustifolia and Z. marina. In the UK the distinction is on the basis of morphology and habitat type (Davison & Hughes, 1998). However, there is a body of evidence suggesting that Z. marina is a highly variable species found in both subtidal and intertidal habitats. In the intertidal area it exhibits a smaller morphology with narrow and shorter leaves: this description matches the current description of Z. angustifolia, which is now considered by many to be an intertidal sub-species of Z. marina (Hily et al., 2003). Therefore, it is possible in the future that Z. angustifolia becomes taxonomically subsumed into Z. marina.
In the last century there have been significant losses of seagrass habitat. Seagrass beds in Europe were considered to be widespread and healthy at the beginning of the 20th Century (Hily et al., 2003) before a ‘wasting disease’ struck during the 1930s (den Hartog, 1987; and Giesen, 1990), caused by a pathogenic slime mould protist of the genus Labyrinthula (Vergeer & den Hartog, 1991). Zostera marina plants were particularly affected, with almost 90% loss of populations in Western Europe (Hily et al., 2003).
There were reports prior to the 1930s of declines in England (Butcher, 1934) and France (Lami, 1935) but none as catastrophic as those later on. The disease spreads through leaf to leaf contact and is characterised by lesions that develop into dark spots which quickly spread along the length of the leaf causing it to die within a few weeks (Figure a). After repeated leaf defoliation, the rhizomes become discoloured and die (den Hartog, 1989). Investigations into the disease have led to the theory that it is a secondary decomposer of old leaf material (den Hartog, 1987) linked to already stressed plants (Young, 1937; Tutin, 1938; Rasmussen, 1977) as generally healthy tissue can resist infection (Vergeer & den Hartog, 1994). Numerous attempts to isolate the pathogen from healthy seagrass have failed (Muehlstein et al., 1991). Seagrass beds have progressively recovered but have not reached the same extent as previously and more recently smaller infestations have been reported (Brockelmann et al., 2012).
The Scottish Environment Protection Agency (SEPA) has been trialling the WFD UKTAG (United Kingdom Technical Advisory Group) Seagrass tool since 2012 (WFD-UKTAG, 2014). Under the WFD, seagrasses are assessed as one of the Biological Quality Elements for Classification under Article V of the Water Framework Directive in order to define the ecological status of a transitional coastal water body and develop methods to assess the impact of human-induced pressures.
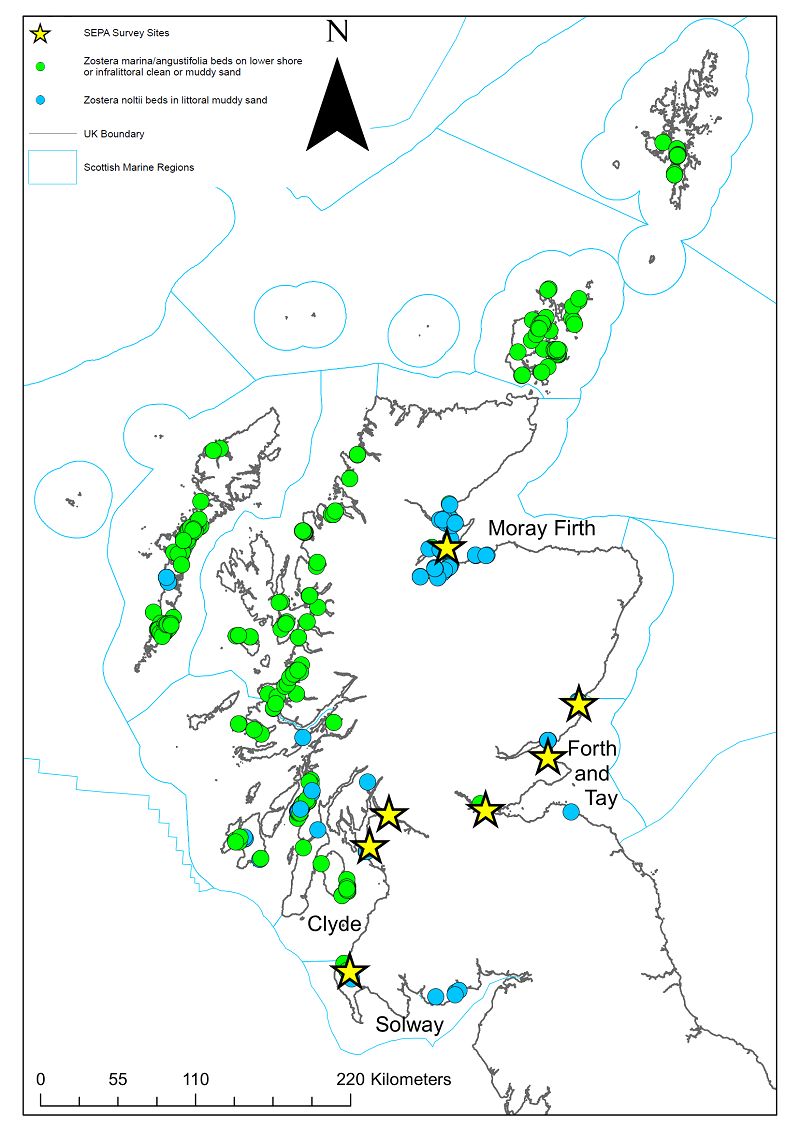
Figure a shows records of Zostera spp. contributing to the Geodatabase of Marine features adjacent to Scotland (GeMS) and the location of SEPA survey sites. These sites (Cromarty Firth, Montrose Basin, Eden Estuary, Forth Estuary, Clyde Sea area and Loch Ryan - Figures 2 and a) were chosen because they have multiple pressures on the water body and are monitored for other chemical or biological aspects. In addition, they are intertidal seagrass beds as SEPA do not monitor subtidal beds. Many of the records of Zostera marina/angustifolia are likely to be subtidal but due to the confusion in species nomenclature it is difficult to separate them. NatureScot undertakes some monitoring of both intertidal and subtidal seagrass beds where these are protected features of MPAs (see NatureScot Site Condition Monitoring for details). However, the NatureScot Site Condition Monitoring work has not yet adopted WFD monitoring methodologies and is not currently undertaken at a suitable temporal frequency to add to the current assessment.
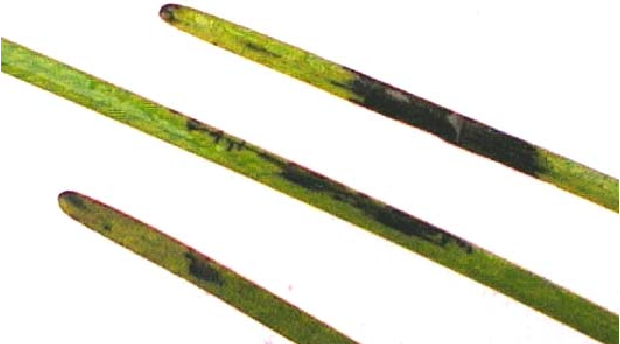
Figure a: Photograph of infected seagrass by Labyrinthula, showing complete blackened region across entire blade, black spots and black streaks (Ralph & Short, 2002).
Seagrasses (WFD-UKTAG, 2014) are assessed as one of the Biological Quality Elements for Classification under Article V of the Water Framework Directive in order to define the ecological status of a transitional coastal water body and develop methods to assess the impact of human-induced pressures.
The WFD seagrass assessment tool is an approved UKTAG method. The tool is composed of three individual parameters, each of which is compared to baseline data or data from the previous assessment. These parameters are:
- Taxonomic composition – number of observed species compared to number of previously recorded species.
- Shoot density / % cover loss – estimated percentage cover expressed as percentage cover loss/gain.
- Spatial bed extent –percentage loss or gain of the total area of seagrass beds.
Taxonomic composition is based on the stability of species richness: the number of species found compared to the previous number found. Zostera spp. are considered to species level and recorded as Z. noltii, Z. angustifolia or Z. marina. Although as discussed above Z angustifolia is regarded by some as an intertidal version of Z. marina, it is treated as a separate taxon for WFD purposes. Due to the difficulty in taxonomic identification of R. cirrhosa and R. maritima, only the genus is identified (WFD-UKTAG (2014)). Therefore, a maximum of four taxa may be found in a Scottish water body.
Shoot density is expressed as percent cover of seagrass compared to the previous percent cover. Under good conditions, the density of a bed should remain the same or increase, and a deterioration of water body quality may cause a reduction in density.
Spatial bed extent is defined by the total area of seagrass beds within the water body with the current bed extent compared to the previous extent.
To determine the ‘health’ of the BQE, the observed conditions of each individual parameter of the tool are compared to previous years data. Each individual parameter is calculated separately and then combined and averaged, with equal weighting. This gives a final numerical Ecological Quality Ratio (EQR) score for that BQE per water body, which in this case is seagrass. An EQR with a value of one represents reference conditions (minimally disturbed) and a value of zero represents severe impact. Figure b gives a simplified overview of the EQR, ecological status class and each metric.
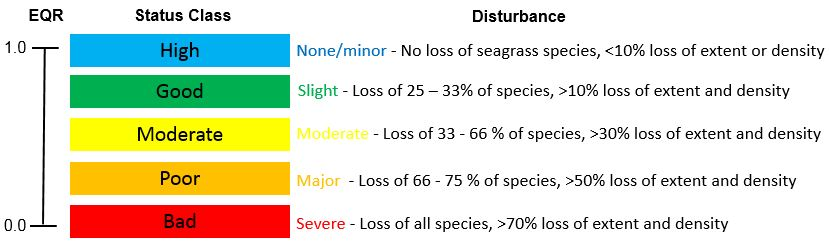
Figure b: Simplified overview of the seagrass ecological status classes.
Data should ideally be collected on an annual basis to calculate an EQR. As more data are collected a 5 year rolling mean should be used to reduce potential ‘noise’ caused by a high degree of natural inter-annual variability. Until then both single year and combined (up to five years) data will be used. Sampling is carried out during the summer months (June – September), at peak seagrass growth. The time for the survey should remain relatively constant year-on-year, unless the peak growth period has altered. The area covered is between mean high water and mean low water on a spring tide. Extent of seagrass cover is estimated from GIS maps generated from data collected using Trimble GPS GeoXH units, capable of mapping to accuracies of 10 cm. Randomly placed 0.25 m2 quadrats are used to assess percent cover of seagrass and taxonomic composition of the area. Assessment is carried out over the entire intertidal area of the water body where seagrass has the potential to grow.
Mapping the edges of the seabed extent by survey staff walking using GPS devices requires expert judgement in deciding where the edge of the bed is as often it does not have a definite edge but instead peters out. The OSPAR guidance on Zostera beds defines them as “…. plant densities should provide at least 5% cover (although when Zostera densities are this low, expert judgement should be sought to define the bed). More typically, however, Zostera plant densities provide greater than 30% cover.”
The assessment of percentage cover is undertaken using quadrat photographs taken in the field. These are assessed by two analysts and a third quality control analyst to reduce errors. Further quality control is achieved through SEPA staff participation in the NE Atlantic Marine Biological Analytical Quality Control Scheme (NMBAQC) ring tests in order to quality check analysis methods.
Results
Hiscock et al. (2004) stated that seagrass beds were especially well developed in Scotland compared to other parts of Britain and Ireland with “…development most likely due to the presence of extensive suitable habitats and possibly uncontaminated waters”. However, in general there is limited verifiable information regarding the extent of intertidal seagrass beds especially on the west coast.
Cleater (1993) described two types of Zostera communities – intertidal and subtidal. The most widespread being intertidal mixed Z. noltii and Z. angustifolia on the east coast and in estuaries. This is typical of what SEPA surveys found in the Montrose Basin and Eden Estuary with the addition of extensive cover of opportunistic algal growth. Excessive cover of opportunistic algae can outcompete seagrass, compromising its health and inhibiting or eliminating it completely (Dennison et al., 1993).
Sites in the Forth Estuary were overall smaller and, therefore, supported much smaller patches of seagrass compared to the rest of Scotland but the average percentage cover of seagrass was higher than at other sites. This higher percentage cover may be due to the much lower amount of opportunistic algae present, which was observed in small areas at the top of shores or near freshwater input.
In Loch Ryan seagrass occurred with minor amounts of algae but the substrate may not have been as suitable for promoting growth as some of the other sites surveyed. For example, in places, historic mussel beds, or mussel scalps inhibited growth, whilst in others no seagrass was present on a shell/gravel/sand substrate.
Table 1 shows the extent of seagrass coverage and the average percent cover of patches in each water body surveyed. The Forth Estuary is spread over multiple water bodies due to its size and variation in morphology.
The results presented are the baseline survey data SEPA will use to run WFD trial classification in future years. Trial classification was completed on three of the sites where time series data exits; with them all being classed as High. The EQR for the Forth Estuary is calculated for the Lower Estuary and the Middle Estuary as it is spread over multiple water bodies due to its size and variation in morphology. More data is needed for the remaining sites surveyed in order to complete classification.
Any real changes to seagrass brought about by human disturbance may take at least 5-10 years (Duarte & Kirkman, 2001) to appear. Therefore, long term monitoring is essential to provide robust data for classifying ecological status as per WFD guidelines. Natural variation in the seagrass beds is mitigated by classifying the data based on a rolling mean, which also allows the identification of underlying trends as well as minimising natural variability.
|
Water body
|
Month/Year surveyed
|
Area (m2)
|
Average % cover
|
EQR
|
Class
|
|
Loch Ryan
|
Aug-2013
|
104,800
|
33.3
|
|
|
|
Eden Estuary
|
Jul-2013
|
172,200
|
28.2
|
1.00
|
High
|
|
Aug-2015
|
558,800
|
29.0
|
|||
|
Montrose Basin
|
Jul-2013
|
1,747,000
|
41.8
|
0.92
|
High
|
|
Aug-2017
|
2,793,416
|
36.0
|
|||
|
Lower Forth Estuary
|
Aug-2014
|
349,264
|
57.6
|
0.87
|
High
|
|
Aug-2018
|
331,475
|
44.9
|
|||
|
Middle Forth Estuary
|
Aug-2014
|
201,339
|
53.3
|
0.89
|
High
|
|
Aug-2018
|
192,299
|
50.7
|
|||
|
Cromarty Firth
|
Aug-2015
|
3,238,571
|
36.5
|
|
|
|
Clyde Estudary Outer (Ardoch & Cardross)
|
Aug-2016
|
108,009
|
32.2
|
|
|
|
Largs Channel (Hunterston)
|
Aug-2016
|
192,895
|
32.6
|
|
|
The tool for seagrass classification of intertidal seagrass was trialled in six estuaries within the Scottish waterbodies between 2013 and 2018. This method requires repeated years of data and as yet this trial is incomplete. However, using data from sites within the estuaries, there are sufficient data to classify three of the estuaries (Montrose Basin, Forth Estuary and Eden Estuary) using this method.
Forth and Tay SMR
Eden Estuary
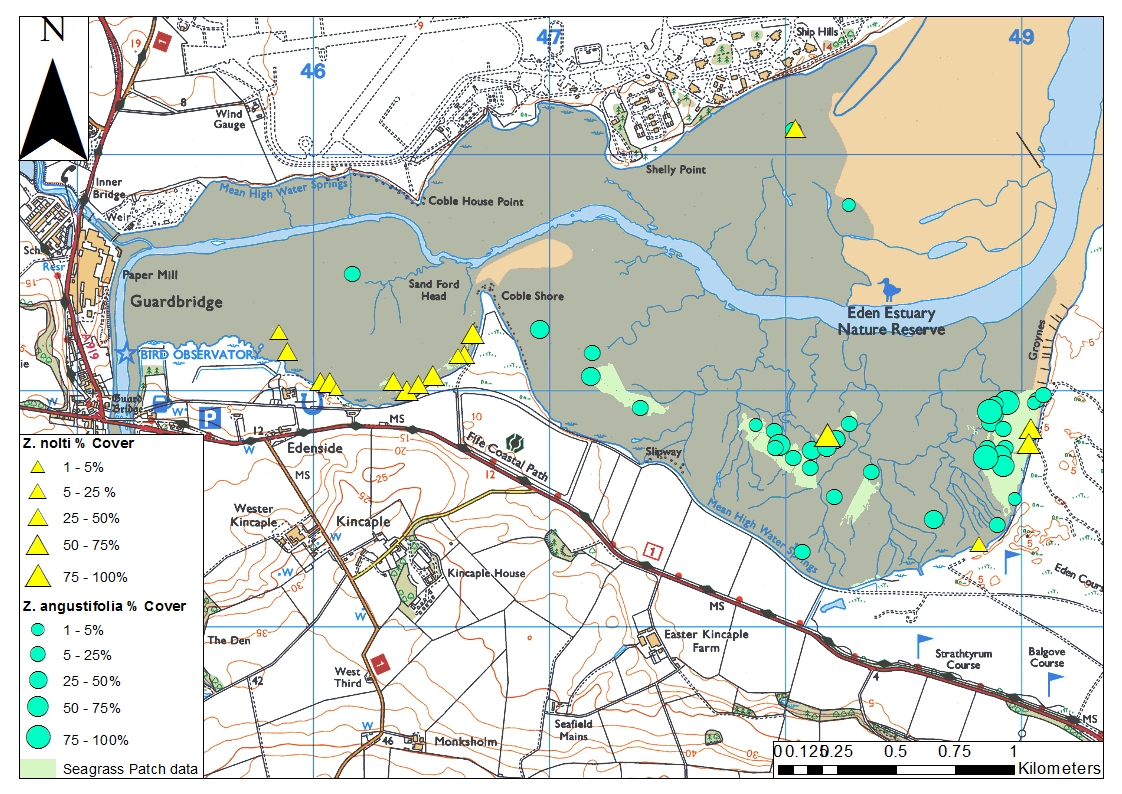
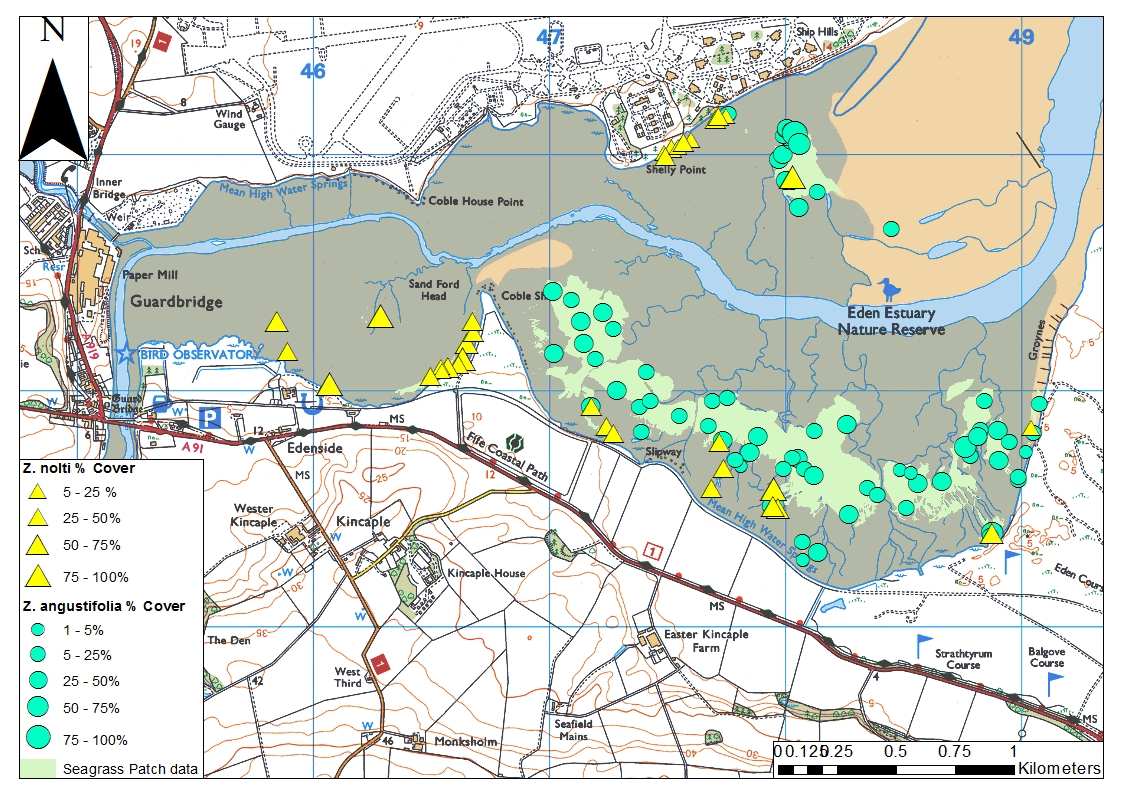
Figure c: Seagrass species distribution and extent across the Eden Estuary in 2013 (left) and 2015 (right)
The first year a full seagrass survey was conducted was 2013, in conjunction with a macroalgal bloom survey, and spatial data collected specifically for the distribution of seagrass beds. Figure c (right) shows the location of seagrass species and the percent coverage of patches found. The average percent cover of these patches ranged between 3 – 51%. As with the survey carried out by NatureScot in 2006. Z. noltii was found to be dominant in the Inner Estuary whilst Z. angustifolia was more prevalent in the Outer Estuary. Seagrass cover over the whole estuary was 172,200 m2 with an average percent cover of 28.21%.
During August 2015, another full seagrass survey was conducted in conjunction with a macroalgal bloom survey (Figure c, left). The survey was carried out by three teams over four days, whilst in 2013 the survey was completed in three days. Therefore, the apparent increase in seagrass coverage may partly be down to a more intensive survey carried out in 2015. Seagrass was present over an area of 558,800 m2 with an average percent cover of 29%.
A trial classification was run on the data of the 2015 seagrass survey using the 2013 data as the baseline. The Eden Estuary is of High ecological status (1.00 EQR). Due to the 2015 survey being more intensive, a third survey would need to be completed to ensure the robustness of this ecological status and it is not a result of more time being spend collecting data.
Montrose Basin
In 2013, SEPA conducted a full seagrass survey where spatial data were collected specifically for the distribution of seagrass (Figure d, right). It was carried out in conjunction with a macroalgal bloom survey and is to be used as the baseline data for future seagrass surveys and WFD classification. The total area of seagrass coverage within the Montrose Basin during 2013 was 1,747,000 m2 with an average density of 42%.
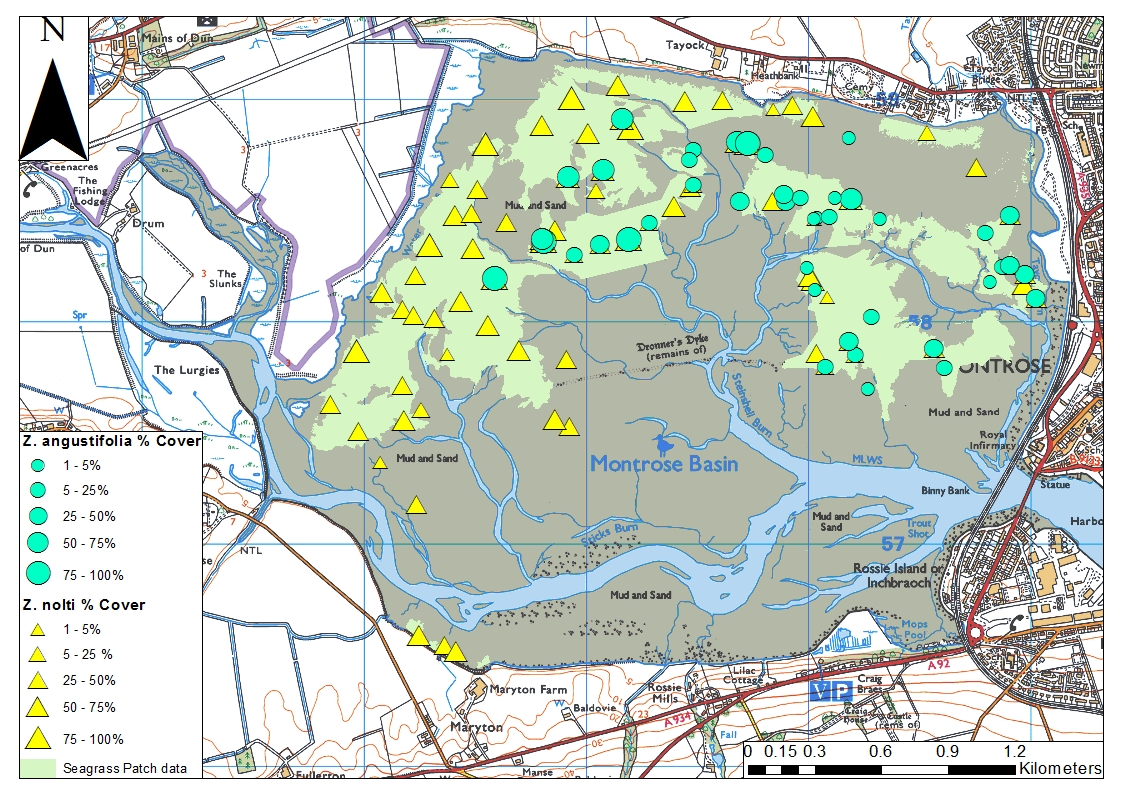
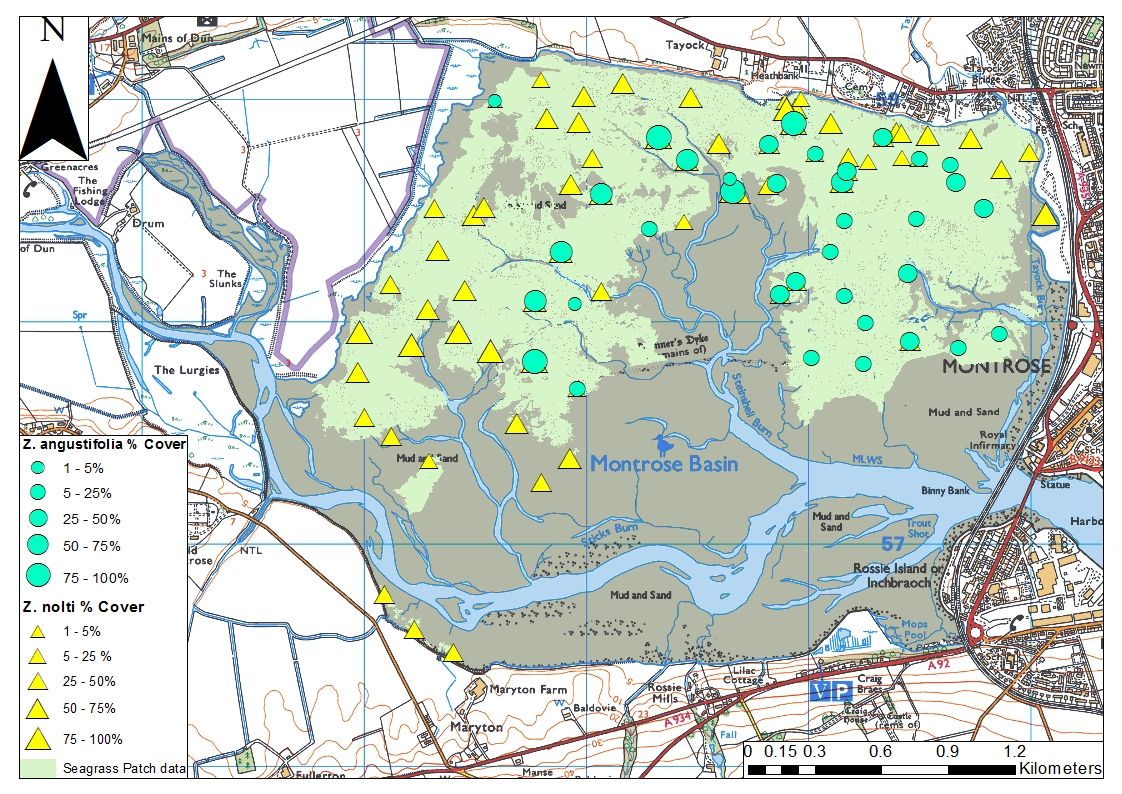
Figure d: Seagrass species distribution and extent across the Montrose Basin in 2013 (left) and 2017 (right)
The survey was repeated in 2017 (Figure d, right) and the total area of seagrass coverage was 2,793,416m2, with an average density of 36%. The increase in coverage may be due to the resolution of aerial imagery obtained in 2017 and not 2013, which helps to determine the extent of beds in areas that are inaccessible due to thixotropic sediments. The average density of seagrass was also reduced but in that year the macroalgal blooms also found in the estuary were reduced which may be due to natural variation.
Using the 2013 data as the baseline, a trial WFD classification was calculated to give an indicative results of High with an EQR of 0.92. In future years, the survey should be repeated in order to determine if results are natural variation or the influence of environmental pressures.
Forth Estuary
Over a two day survey period during August 2014, SEPA staff visited six sites. Of these six sites, five were intensively mapped and species data density and composition were collected (Table a). The sixth site (Torry Bay) was found to be too big to be fully surveyed within half a tidal window and the decision was made at the time to concentrate on the seagrass beds found to collect robust data. During 2014, a Heriot-Watt Masters student (Finlay (2014)) also collected seabed extent data from Torry Bay. The site was surveyed in full so it was decided to use this extent in addition to the SEPA data for baseline information.
|
Waterbody
|
Site
|
2014
|
2018
|
||
|
Area (m2)
|
Average % coverage
|
Area (m2)
|
Average % coverage
|
||
|
Lower Forth Estuary
|
Carriden
|
81,383
|
67.65
|
60,375
|
43.80
|
|
Blackness
|
29,066
|
45.06
|
203,105
|
45.20
|
|
|
Blackness Castle
|
216,680
|
47.50
|
32,080
|
44.30
|
|
|
Hopetoun House
|
4,765
|
64.50
|
21,228
|
40.20
|
|
|
Brucehaven
|
17,370
|
63.10
|
14,687
|
51.00
|
|
|
Middle Forth Estuary
|
Culross
|
2,639
|
53.65
|
17,931
|
48.20
|
|
Torry Bay
|
18,764
|
53.00
|
174,248
|
44.00
|
|
|
Ironmill Bay
|
|
|
120
|
60.00
|
|
|
Total area (m2)
|
370,667 (+ 198,700 for Torry Bay from Finley, 2014)
|
523,774
|
|||
During August 2018, SEPA repeated the Forth seagrass survey. This covered all the same sites as in 2014 apart from Burntisland where only a small patch of seagrass was found in 2014 and it is located in a different waterbody where other sites were not surveyed.
The total area of coverage in 2018 was 523,774 m2 compared to 569,367 m2 surveyed in 2014. A trial classification was run from the results of the 2018 survey on both waterbodies. The Middle and Lower Forth Estuary is of High ecological status (0.89 & 0.87 EQR).
Solway SMR
Loch Ryan
In 2010, SEPA staff conducted a survey of seagrass presence in Loch Ryan and found it to be present at two locations (Figure e). Little information was gathered on percent cover and species composition; only presence/absence of seagrass was noted and some spatial information on the seagrass beds collected. In 2013, a full seagrass survey was conducted and information was collected on all parameters for WFD assessment to be used as baseline data. The proposed survey sample sites were spread across the entire area in both locations, well beyond the extents surveyed in 2010, to ensure that information was collected on all seagrass beds in both areas.
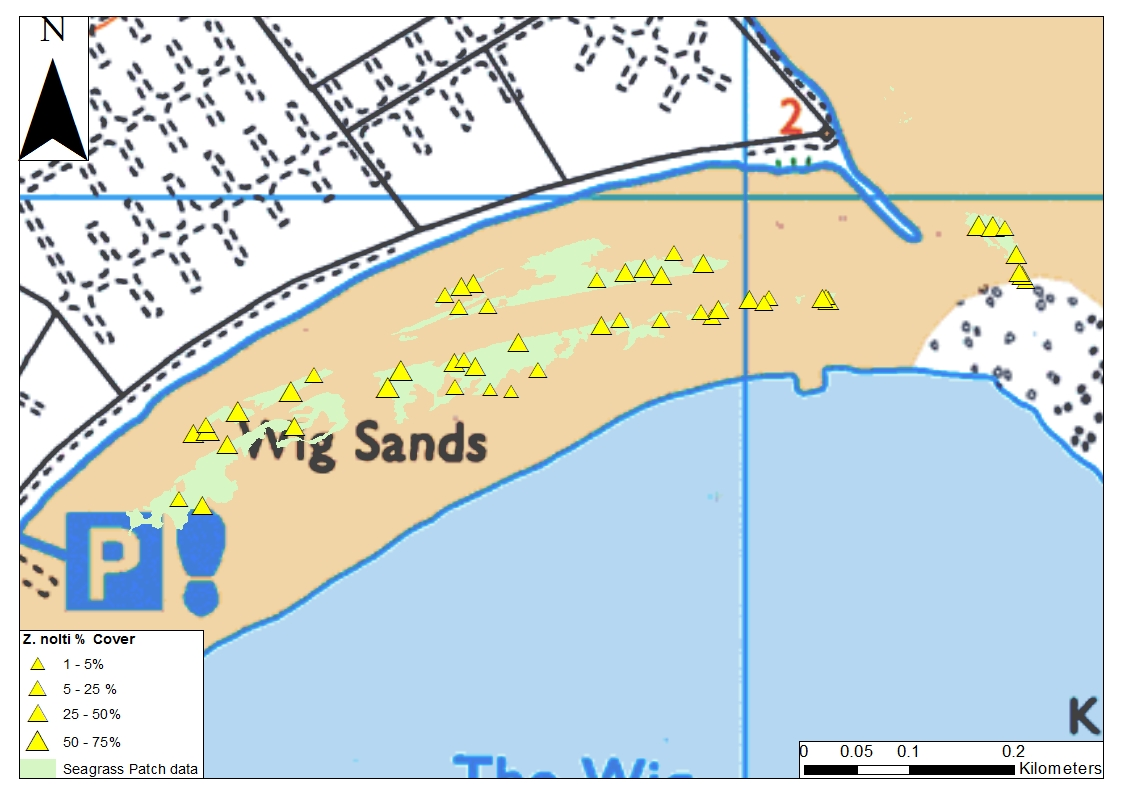
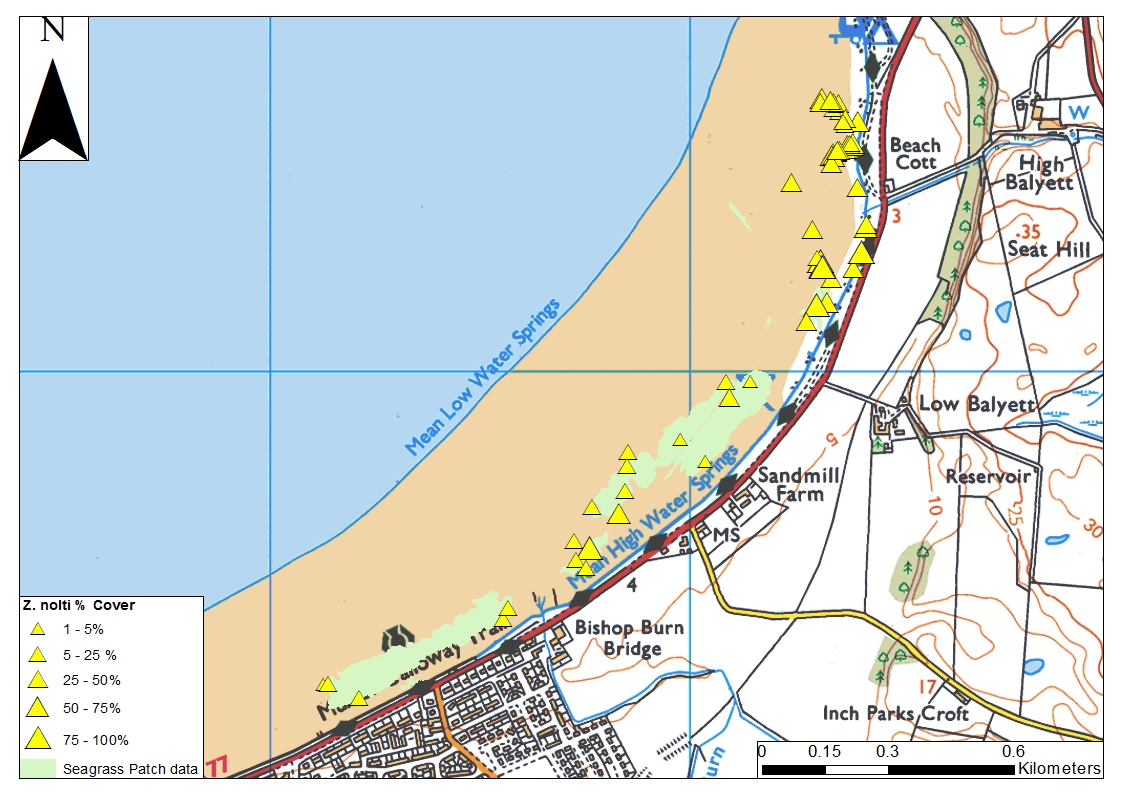
Figure e: Seagrass species distribution and extent at Wig Sands, Loch Ryan 2013 (left) and 2015 (right).
Seagrass beds mapped at Wig Sands (Figure e, left) covered 21,100 m2 with an average percent cover between 30-40%. In the Stranraer area (Figure e, right) the seagrass covered 83,700 m2 with an average percent cover between 12-56%. Z. noltii was the only seagrass species found in the loch.
Moray Firth SMR
Cromarty Firth
During August 2015, the Cromarty Firth, specifically Udale Bay and Nigg Bay, was assessed for seagrass. The seagrass bed extent in Udale Bay was 1,258,764 m2 (Figure f, right), whereas Nigg Bay (Figure f, left) had a much larger extent of 1,979,807 m2. The average percentage cover of seagrass at Udale Bay was higher at 45%, whilst in Nigg Bay it was only 28%. The Cromarty Firth has the largest area of seagrass coverage assessed by SEPA to date.
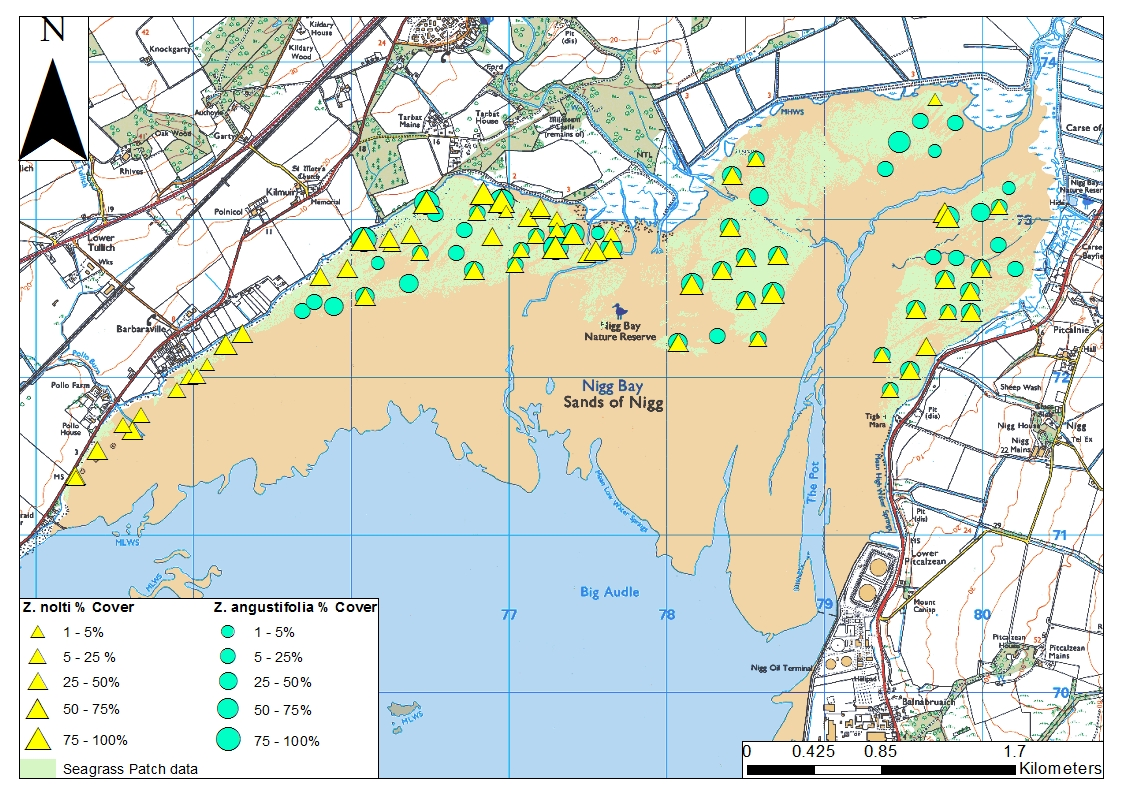
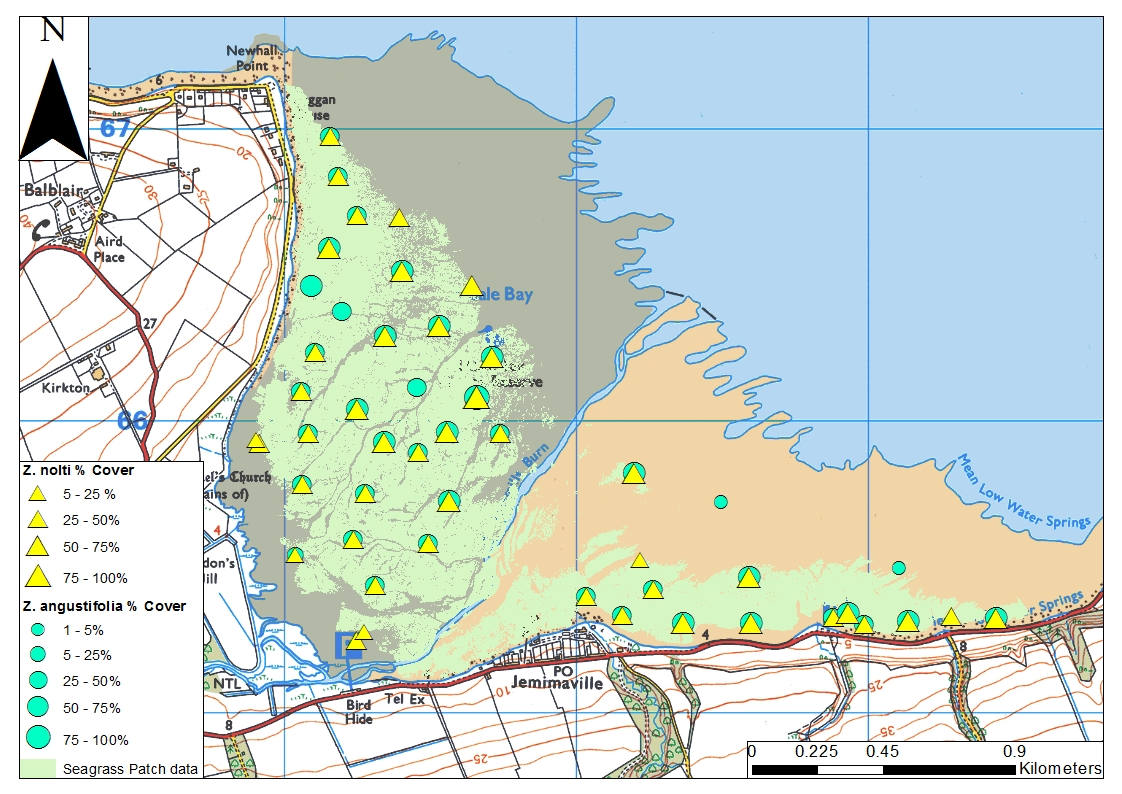
Figure f: Seagrass species distribution and extent at Nigg Bay (left) and Udale Bay (right), Cromarty Firth, 2015.
Clyde SMR
Clyde Estuary & Inner Firth of Clyde
During August 2016, a baseline survey for seagrass at Clyde Estuary (Cardross & Ardoch) and the Inner Firth of Clyde (Hunterston) was completed. The extent of seagrass at Ardoch and Cardross (Figure g,) was 108,009 m2 with an average percent cover 32%. The extent of seagrass at Hunterston (Figure h) was larger at 192,895 m2 with an average percent cover of 33%. Zostera noltii was the only species of seagrass found at both sites.
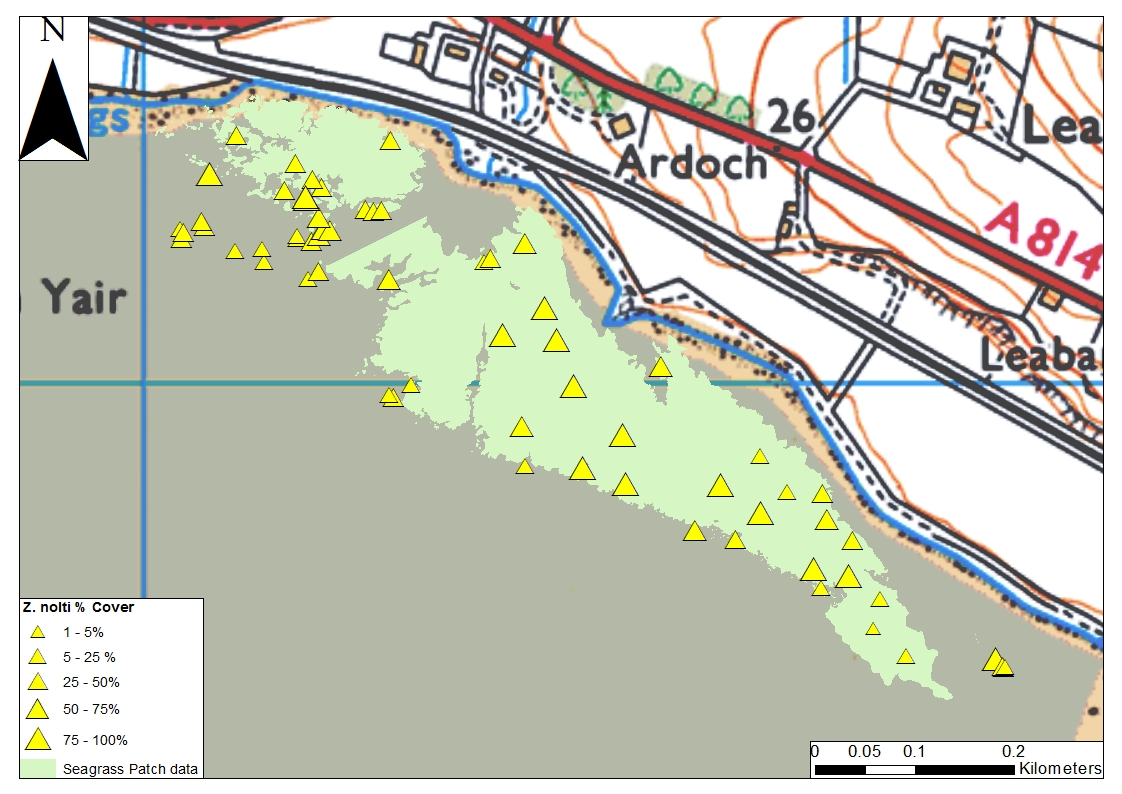
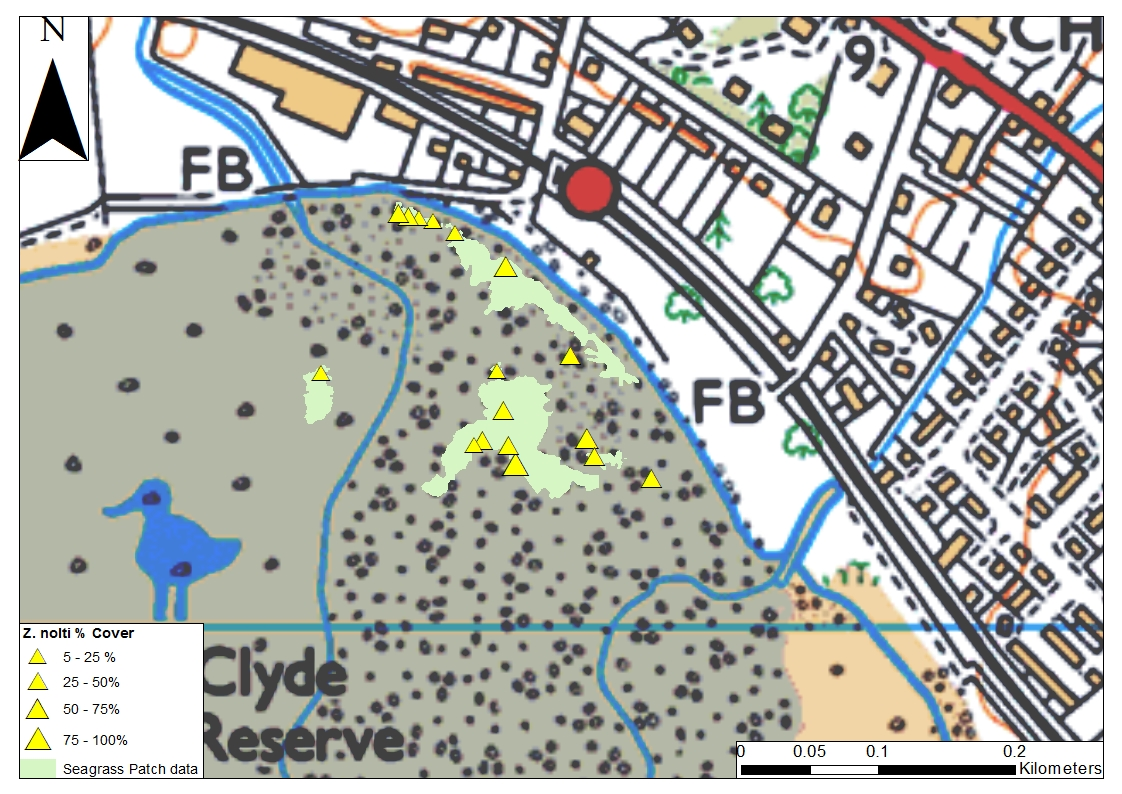
Figure g: Seagrass species distribution and extent at Ardoch (left) and Cardross (right), Clyde Estuary, 2016.
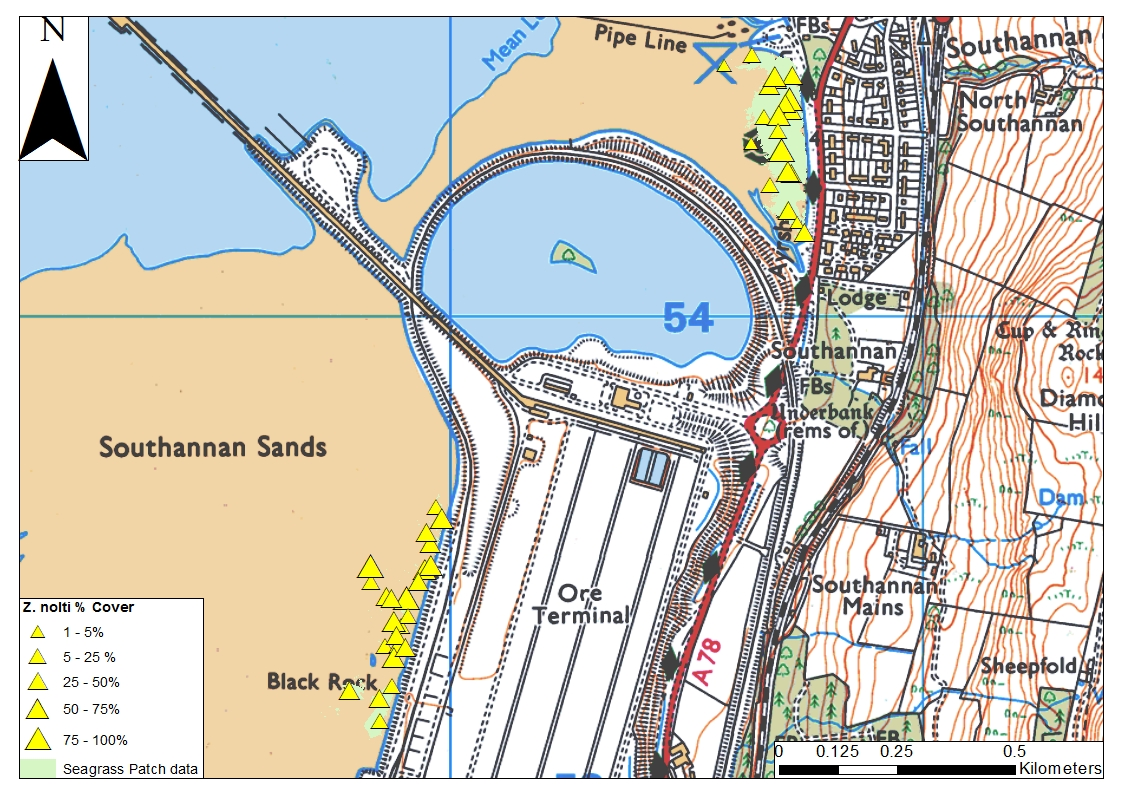
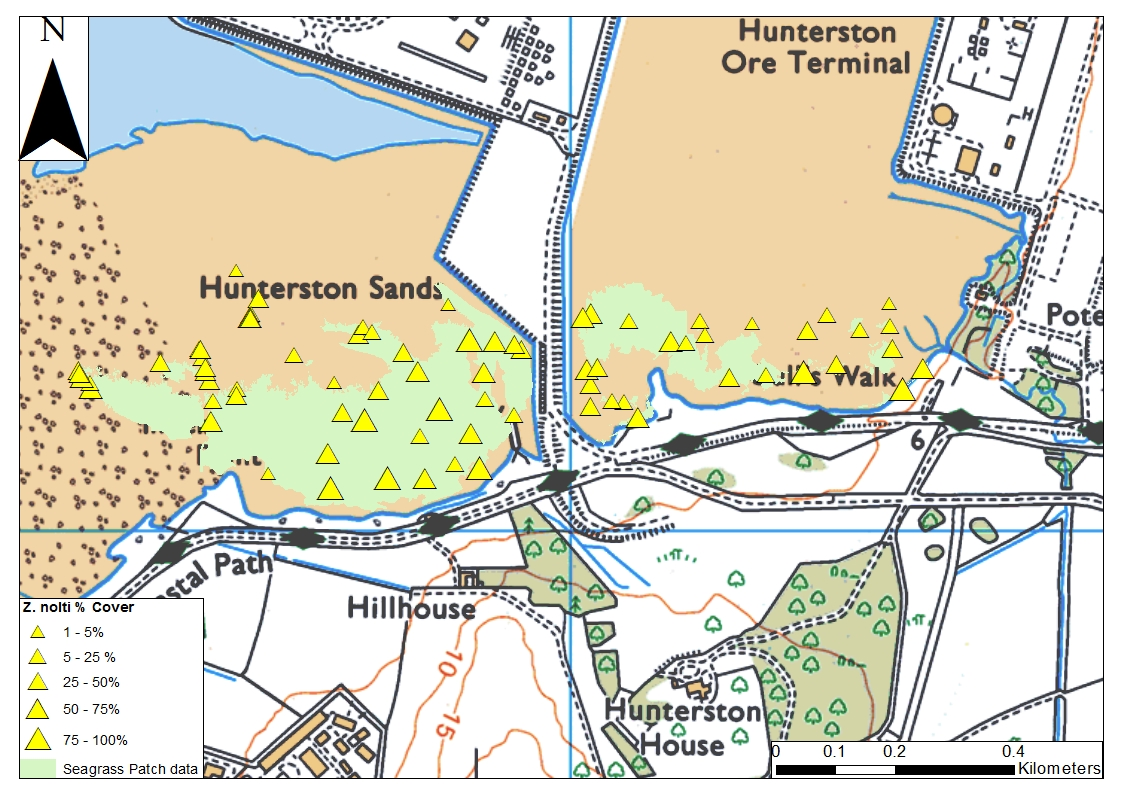
Figure h: Seagrass species distribution and extent at North Hunterston (left) and South Hunterston (right), Clyde Estuary, 2016.
Conclusion
The information described is the first attempt to gain an understanding of the ecological status of Scottish intertidal seagrass. Of the six waterbodies surveyed by SEPA, classification can only be run on three, which are all at high ecological status. This gives a good indicator to the health of seagrass within the Forth and Tay Scottish Marine Region but there is insufficient information to have high confidence in the data. The other sites cannot be classified due to lack of repeat data necessary for the intertidal seagrass tool. In addition, there are no data to classify any of the other Scottish Marine Regions.
Since the 2011 Marine Atlas assessment (Baxter et al., 2011), understanding of the distribution of seagrass has not changed and records are available on Marine Scotland Maps NMPi. However, since 2011 quantitative data has started to be gathered that will enable future assessment of the health of Scottish intertidal seagrass.
The focus on seagrass beds has increased since 2014, as seagrass beds (both subtidal and intertidal) were identified by NatureScot and Marine Scotland as Priority Marine Features (PMFs). Under the Marine (Scotland) Act (2010) these features are recognised as being characteristic of the Scottish marine environment and are protected under legislation or through designated of Marine Protected Areas.
Measures are being proposed to protect and, where necessary, improve seagrass beds. One example is an ongoing review of bottom-contacting mobile fishing activity to inform a consideration of additional management measures to protect subtidal beds of Z. marina beds. This management measure would protect the sub-tidal seagrass beds, however it should be noted there is no known impact of this activity on intertidal seagrass beds. Intertidal seagrass beds are known to be impacted by coastal development, eutrophication and physical disturbance (e.g. from animal grazing or bait digging). An indicator of the success for any management activities for intertidal seagrass beds is the good ecological status of the beds.
The three estuaries classified (Montrose Basin, Forth Estuary and Eden Estuary) from the information available so far, indicate the intertidal seagrass has been classified as being of ’High’ ecological status. However more data from a greater geographic extent would be required to make a thorough assessment for Scottish Marine Regions. As a result, the assessment of Scottish Marine Regions is recorded as 'Lack of evidence'. Whilst this assessment is based on a small amount of data, it verifies that the taxonomic diversity of the seagrass beds studied is diverse and therefore stable. The shoot density is not a cause for concern and there have been no significant changes in the extent of the individual seagrass beds that would indicate any deterioration during the time-period of this assessment.
During the survey of the Montrose Basin and Forth Estuary, aerial imagery was also collected. For the Montrose Basin, this was to determine patch data from the areas of thixotropic sediment. This has been gathered previously for macro-algal bloom only surveys and supplements the data collected in the field. Aerial imagery for this purpose works very well in the Montrose Basin due to the type of sediment and the defined edges of the patches. Unfortunately, this process did not work as well in the Forth Estuary, where the aim was to determine seagrass patches from the aerial imagery reducing the need for extensive ground-truthing. The seagrass patches in the Forth Estuary are much smaller and on or near substrate ranging from mud to coarse sand and rocks which is inhabited by lots of seaweed (such as Fucus spp.). The presence of seaweed confuses the processing as it is picked up by the near infra-red camera and it is difficult to distinguish from the seagrass.
The Eden Estuary was also classified but will not be reported for WFD purposes due to a low confidence in the data. The baseline information did not cover the whole estuary and therefore the perceived increase in seagrass from 2013 to 2015 is due to an increase in survey effort. In future the 2015 data will be used as baseline data for classification.
The overall confidence of this assessment is medium. This is based on there being high confidence in the method, as it is agreed at UK level and the tool for this classification has been intercalibrated at a European Union level. However, the confidence to use this local assessment tool (water body-scale) to determine the quality of seagrass habitats at a regional (Scottish Marine Region) scale has not been tested and greatly reduces the confidence in attributing the results to regional levels. The amount of evidence is high for each site but not all areas have enough (2 years of) data to classify the site for WFD purposes yet. Confidence for the evidence is thus medium. At a Scottish level there is only a small amount of quantitative evidence available (6 sites).
Knowledge gaps
There are a lack of data and knowledge available for Scottish intertidal seagrass in order to carry out an assessment for Scottish Marine Regions. Not only is there a lack of comprehensive baseline data but there is no long-term understanding of ecological trends of Scottish seagrass. SEPA has begun the process of assessing intertidal seagrass at a select number of sites but these are not representative of Scottish seagrass beds as a whole.
The knowledge gaps for seagrass stem from an overall lack of data. More specifically:
- There is a lack of comprehensive baseline data: For the geographic distribution of seagrass Cleator (1993) produced a map of the locations of seagrass beds pre- and post-1940. This leaves questions to how many seagrass sites are still present as there has been no baseline review or data available to carry out an assessment. For ecological data there is also scant data on the species assemblages for established, known seagrass beds.
- There is no long-term understanding of ecological trends of Scottish seagrass, in particular evidence of how pressures impact on both sub-tidal and intertidal seagrass, or evidence of seagrass recovery. It is not known whether fluxes and changes seen are natural fluctuations or are leading to permanent changes in the seagrass beds: The WFD tool used for this assessment focusses on picking up long-term trends, or any decrease of quality. The Seagrass tool was not designed to indicate any reason for change, but would be a trigger for further investigation on the pressures causing a reduction in seagrass cover and/or extent is required.
- For this assessment, there are limited data: SEPA only gathered data from six sites. To have a complete understanding of the health of seagrass in Scotland more sites are required, both from more regional, geographical locations, as well as from more sites within those locations. Seagrass is particularly sensitive to local nutrient enrichment and pollution, therefore scaling-up this assessment to regional seas geographical level is not appropriate. Currently no trends can be established owing to the lack of long-term datasets.
Seagrass – future directions
In the future satellite imagery may be used to monitor and map intertidal and subtidal seagrass. Preliminary work has been undertaken using Sentinel 2 optical data. Sentinel 2 data is freely available and the satellites have a revisit period in Scotland of 2-3 days. Images captured in cloud free conditions and coinciding with low tide have been used to predict the distribution of seagrass.
The process has involved using SEPA datasets of seagrass distribution (obtained from field work) as ‘training datasets’. Satellite data corresponding to those areas of training data are then extracted, including for example reflectance values of red, green and blue bands, and indices derived from a mixture of bands including red edge bands. The red edge bands are within the part of the electromagnetic spectrum between red and near infrared and have found to be useful in distinguishing seagrass from other substrates (e.g. Dierssen et al., 2019, Li et al., 2018). Machine learning is used to build a model relating the training data to the satellite values which is then applied to the whole image to predict where seagrass may be present.
Work is now underway to ground truth the classification in order to determine accuracy of the process. Remote sensing has the potential to provide consistent, rapid monitoring of habitats at a large scale.
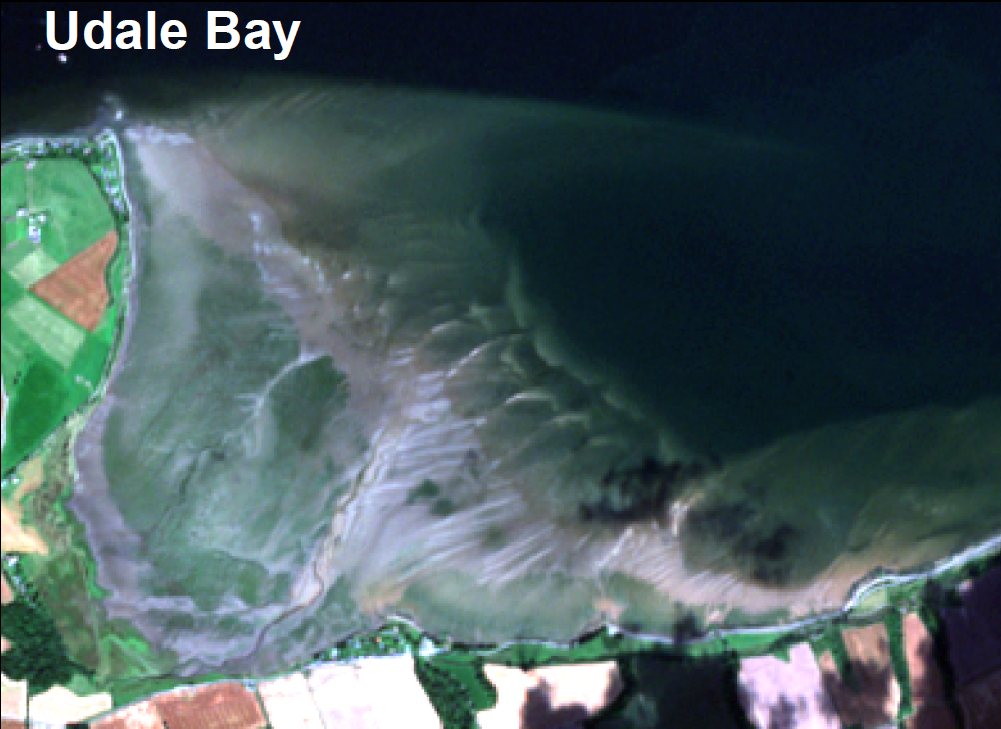 Sentinel 2 - 24th August 2016
Background Sentinel 2 imagery displayed as:
red: red green: green blue: blue |
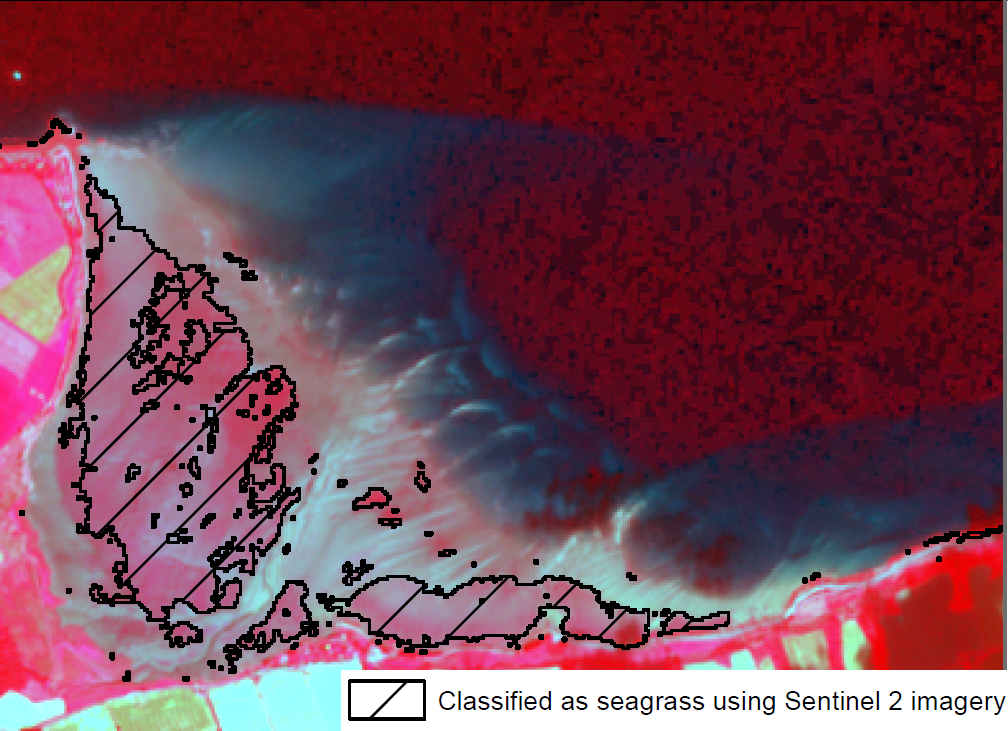 Area classified as seagrass using Sentinel 2 imagery
Background Sentinel 2 imagery displayed as:
red : rededge7 NDVI, green: red, blue:green Training data from Udale created using information from SEPA seagrass polygons (2015) and aerial imagery, through manual selection of larger areas of potential seagrass.
Out of bag error: 1.52%
Accuracy using separate training and validation data: 0.9771 Sentinel 2 data used in classification:
24layers, individual bands, ndvi, linear; spectral unmixing layers, from 20160824, 20160314. |
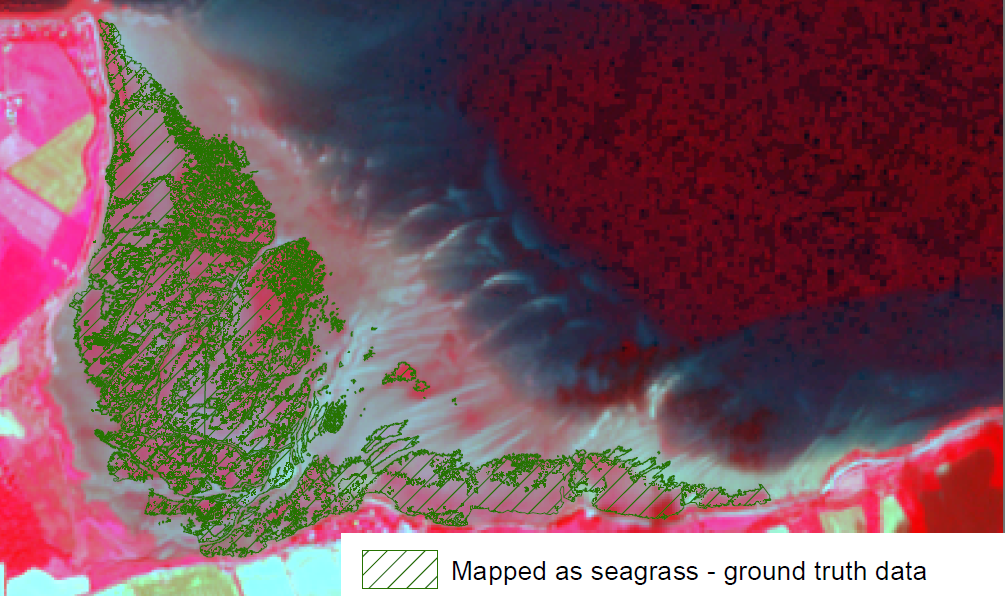 Area classified as seagrass: ground truth data collected by SEPA.
Background Sentinel 2 imagery displayed as:
red : rededge7 NDVI, green: red, blue:green SEPA seagrass polygons: 2015
Developed from information collected by SEPA Marine Ecology section using highly accurate hand held GPS devices and used in conjuction with aerial imagery. |
|
Figure i: The process of classifying seagrass areas with Sentinel 2 data and comparison with SEPA seagrass polygons mapped with GPS in the field. Contains modified Copernicus Sentinel data 2019, processed by JNCC. Contains SEPA data © Scottish Environment Protection Agency and database right 2019. All rights reserved. © NatureScot GIG joblog ID 88296.
|
Status and trend assessment
There are only four marine regions that have been assessed and these are currently listed as ‘grey’ – ‘lack of evidence/robust assessment criteria’ because 2 years’ worth of the required time-series data has not been completed for the majority of the study sites. As a result the WFD classification cannot be completed for them all.
|
Region Assessed |
Status with confidence |
Trend with confidence |
Comments |
|---|---|---|---|
| All Scotland |
 |
|
|
|
Clyde |
|
|
|
|
Forth and Tay |
|
|
Three sites in this region are the Eden Estuary, Montrose Basin and the Forth Estuary. Increase in area extent found in results section is most likely due to increase in survey effort in the Eden and Forth estuaries, therefore one more year’s survey data is needed for increased confidence in this assessment. As such, the status is grey as there is a lack of evidence, but the evidence we have so far is good, hence the medium confidence (two stars). |
|
Moray Firth |
|
|
|
|
Solway |
|
|
This Legend block contains the key for the status and trend assessment, the confidence assessment and the assessment regions (SMRs and OMRs or other regions used). More information on the various regions used in SMA2020 is available on the Assessment processes and methods page.
Status and trend assessment
|
Status assessment
(for Clean and safe, Healthy and biologically diverse assessments)
|
Trend assessment
(for Clean and safe, Healthy and biologically diverse and Productive assessments)
|
||
|---|---|---|---|
 |
Many concerns |
No / little change |
|
 |
Some concerns |
Increasing |
|
 |
Few or no concerns |
Decreasing |
|
 |
Few or no concerns, but some local concerns |
No trend discernible |
|
 |
Few or no concerns, but many local concerns |
All trends | |
 |
Some concerns, but many local concerns |
||
| |
Lack of evidence / robust assessment criteria |
||
| Lack of regional evidence / robust assessment criteria, but no or few concerns for some local areas | |||
 |
Lack of regional evidence / robust assessment criteria, but some concerns for some local areas | ||
| Lack of regional evidence / robust assessment criteria, but many concerns for some local areas | |||
Confidence assessment
|
Symbol |
Confidence rating |
|---|---|
|
Low |
|
|
Medium |
|
|
High |

Assessment regions
 and the Scottish Offshore Marine Regions (OMRs, O1 – O10)")
Key: S1, Forth and Tay; S2, North East; S3, Moray Firth; S4 Orkney Islands, S5, Shetland Isles; S6, North Coast; S7, West Highlands; S8, Outer Hebrides; S9, Argyll; S10, Clyde; S11, Solway; O1, Long Forties, O2, Fladen and Moray Firth Offshore; O3, East Shetland Shelf; O4, North and West Shetland Shelf; O5, Faroe-Shetland Channel; O6, North Scotland Shelf; O7, Hebrides Shelf; O8, Bailey; O9, Rockall; O10, Hatton.
 Regions. These have been used as the assessment areas for hazardous substances.")
, Regions.")