

Background
The assessment of the wider fish community is based on data relating to 167 species collected by the International Bottom Trawl Survey (IBTS) undertaken by Marine Scotland Science and other nations during the first and third quarters of each year. These scientific trawl surveys are used to assess changes in the status of bottom dwelling (demersal) fish communities and to inform fisheries management.
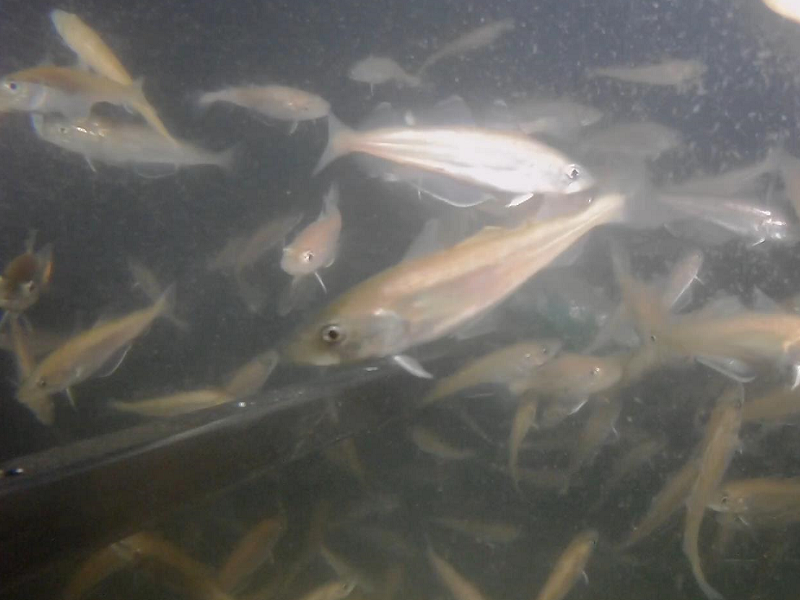
The assessment includes commercial species such as whiting (Merlangius merlangus, Figure 1) and haddock (Melanogrammus aeglefinus), but also includes many species that are not the target of large commercial fisheries, such as the Norway pout (Trisopterus esmarkii), Atlantic horse mackerel (Trachurus trachurus) and Argentines (Argentina sphyraena). Elasmobranchs, such as the the flapper skate (Dipturus intermedius), are also recorded in the survey.
The IBTS dataset is ideal for generating quantitative measures of particular characteristics of the fish community, called community indicators, and these can be used to monitor changes in those characteristics over time and over different regions.
Three community indicators are used in the asessment of the wider fish community. Species Richness counts the number of demersal fish species recorded in any survey sample. The Shannon Diversity Index is a measure of the relative abundance of each species in the sample. Together they provide an indication of biological diversity across the fish community. A size indicator, the Large Fish Indicator (LFI), gives an indication of the proportion of large fish in the community that contribute to a balanced ecosystem.
While not all fish species are targeted commercially, they may still be affected through their unintended capture in the net (by-catch). Relevant assessment surveys that target demersal fish are available and these can provide vital data on the status of some rare and potentially at risk species. The assessment of status, here based on IBTS data, uses three community indicators.
The LFI is an indicator used by the UK Marine Assessment and the OSPAR Quality Status Report. In efforts to examine ecosystem state in the North Sea, the LFI is often defined as the proportion of fish greater than a certain length (e.g., 40 cm) in the biomass of bottom trawl survey catches (Engelhard et al. 2015). The higher the value (varying between 0 and 1), the greater the proportion of large fish in the community.
The presence of large fish in fish communities is important because large fish play a role as top predators, are a main target for fisheries, and contribute to a balanced ecosystem. An LFI of 0.3 is considered a target for Good Environmental Status in the North Sea (Engelhard et al., 2015, ICES CM 2015/P:14).
The two other indicators employed in this assessment provide an indication of biological diversity. Biologically diverse communities are regarded as being more resilient in the face of changing conditions. In the context of a future changing climate, it is therefore important to maintain high values in community indices that reflect diversity.
The need to conserve biodiversity has had a strong influence on the development of an ecosystem approach to managing marine natural resources, and this remains a core aim for the EU Marine Strategy Framework Directive and the Marine (Scotland) Act 2010. A range of metrics, such as species richness and species diversity metrics, can be applied to survey data to act as indicators of change in demersal fish biodiversity.
The indicators which reflect the composition and structure of the demersal fish community examined in this assessment (Species Richness, Species Diversity and Large Fish Indicator) vary in time and space across Scotland’s waters. Assessments such as this can provide information on how the changes in fish community are affected by fishing pressure over time and are useful for informing future fisheries management from an environmental perspective.
The assessment of the wider fish community also includes elasmobranchs (sharks, skates and rays). Over 30 species of sharks, skates and rays have been recorded in Scottish waters, of which 25 are found in coastal waters. All elasmobranchs share life history characteristics that make them vulnerable to overfishing, which means that once depleted, populations take a long time to recover.
Elasmobranchs (e.g. flapper skate (Dipturus intermedius) (Figure a) are slow growing, late to reach maturity and typically have low fecundity, so the number of individual fish recruited into a population on an annual basis is low. Many aspects of their biology, life history and distribution are poorly studied and many knowledge gaps remain. Single stock assessments of elasmobranchs are not performed. Elasmobranchs are caught as by-catch and are recorded in IBTS and Deepwater trawls surveys. To further establish status in smaller geographical areas, local tagging and tracking surveys and genetic studies are carried out, see Flapper skate case study.
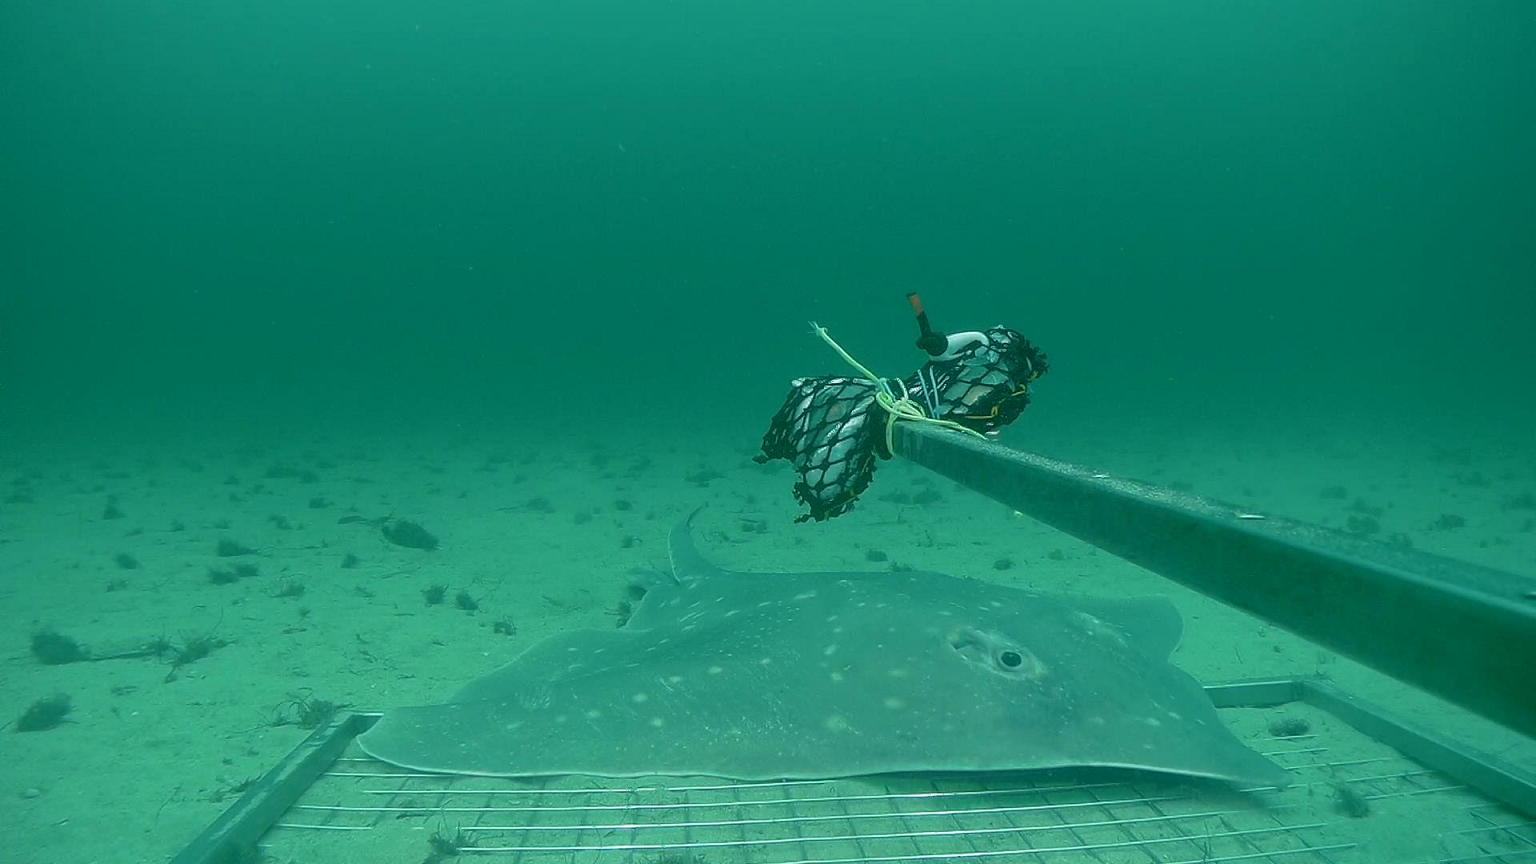
Figure a: Flapper skate (Dipturus intermedius).
The full range of species used in this wider fish community assessment is shown in Table a.
| Scientific Name | Common Name |
| Agonus cataphractus | Hooknose |
| Alosa alosa | Allis shad |
| Alosa fallax | Twaite shad |
| Amblyraja radiata | Starry ray |
| Ammodytidae | Sandeel |
| Anarhichas lupus | Catfish |
| Anguilla anguilla | European eel |
| Arctozenus risso | Spotted barracudina |
| Argentina | NA |
| Argentina silus | Greater argentine |
| Argentina sphyraena | Lesser argentine |
| Argyropelecus hemigymnus | Half-naked hatchetfish |
| Argyropelecus olfersii | Hatchetfish |
| Arnoglossus imperialis | Imperial scaldfish |
| Arnoglossus laterna | Scaldfish |
| Belone belone | Garfish |
| Blennius ocellaris | Butterfly blenny |
| Brama brama | Atlantic pomfret |
| Brosme brosme | Tusk |
| Buglossidium luteum | Solenette |
| Callionymus lyra | Dragonet |
| Callionymus maculatus | Spotted dragonet |
| Callionymus reticulatus | Reticulated dragonet |
| Capros aper | Boarfish |
| Centrolabrus exoletus | Rock cook |
| Cepola macrophthalma | Red bandfish |
| Cetorhinus maximus | Basking shark |
| Chelidonichthys cuculus | Red gurnard |
| Chelidonichthys lucerna | Tub gurnard |
| Chimaera monstrosa | Rabbit ratfish |
| Chirolophis ascanii | Yarrell's blenny |
| Ciliata mustela | Five-bearded rockling |
| Ciliata septentrionalis | Northern rockling |
| Clupea harengus | Herring |
| Coelorinchus caelorhincus | Hollow snout grenadier |
| Conger conger | Conger eel |
| Coryphaenoides rupestris | Roundnose grenadier |
| Cottunculus microps | Polar sculpin |
| Ctenolabrus rupestris | Goldsinny wrasse |
| Cyclopterus lumpus | Lumpsucker |
| Dicentrarchus labrax | Bass |
| Diplecogaster bimaculata bimaculata | Two-spotted clingfish |
| Dipturus batis | Blue skate |
| Dipturus linteus | Sailray |
| Dipturus oxyrinchus | Longnosed skate |
| Echiichthys vipera | Lesser weever |
| Echiodon drummondii | Pearlfish |
| Enchelyopus cimbrius | Four-bearded rockling |
| Engraulis encrasicolus | Anchovy |
| Entelurus aequoreus | Snake pipefish |
| Epigonus telescopus | Black cardinal fish |
| Etmopterus spinax | Velvet belly |
| Eutrigla gurnardus | Grey gurnard |
| Gadiculus argenteus | Silvery pout |
| Gadiculus thori | NONE |
| Gadus morhua | Cod |
| Gaidropsarus argentatus | Arctic rockling |
| Gaidropsarus macrophthalmus | Bigeye rockling |
| Gaidropsarus mediterraneus | Shore rockling |
| Gaidropsarus vulgaris | Three-bearded rockling |
| Galeorhinus galeus | Tope |
| Galeus melastomus | Black mouthed dogfish |
| Galeus murinus | Mouse catshark |
| Gasterosteus aculeatus aculeatus | Three-spined stickleback |
| Glyptocephalus cynoglossus | Witch |
| Gobiidae | NA |
| Helicolenus dactylopterus | Bluemouth |
| Hexanchus griseus | Bluntnose sixgill shark |
| Hippoglossoides platessoides | Long rough dab |
| Hippoglossus hippoglossus | Halibut |
| Labrus bergylta | Ballan wrasse |
| Labrus mixtus | Cuckoo wrasse |
| Lepidion eques | North Atlantic codling |
| Lepidorhombus boscii | Four spot megrim |
| Lepidorhombus whiffiagonis | Megrim |
| Leptoclinus maculatus | Spotted snake blenny |
| Leucoraja circularis | Sandy ray |
| Leucoraja fullonica | Shagreen ray |
| Leucoraja naevus | Cuckoo ray |
| Limanda limanda | Common dab |
| Liparis liparis liparis | Striped seasnail |
| Liparis montagui | Montagu's seasnail |
| Lophius budegassa | Black bellied angler |
| Lophius piscatorius | Angler |
| Lumpenus lampretaeformis | Snakeblenny |
| Lycodes gracilis | Eelpout |
| Lycodes vahlii | Vahl's eelpout |
| Macroramphosus scolopax | Longspine snipefish |
| Macrourus berglax | Rough-head grenadier |
| Malacocephalus laevis | Softhead rat tail |
| Maurolicus muelleri | Pearlside |
| Melanogrammus aeglefinus | Haddock |
| Merlangius merlangus | Whiting |
| Merluccius merluccius | Hake |
| Micrenophrys lilljeborgii | Norway bullhead |
| Microchirus variegatus | Thickback sole |
| Micromesistius poutassou | Blue whiting |
| Microstomus kitt | Lemon sole |
| Molva dypterygia | Blue ling |
| Molva molva | Ling |
| Mullus barbatus barbatus | Red mullet |
| Mullus surmuletus | Striped red mullet |
| Mustelus asterias | Starry smooth hound |
| Mustelus mustelus | Smooth hound |
| Myctophum punctatum | Spotted lanternfish |
| Myoxocephalus scorpioides | Arctic sculpin |
| Myoxocephalus scorpius | Bullrout |
| Myxine glutinosa | Hagfish |
| Nerophis ophidion | Straight-nosed pipefish |
| Pagellus acarne | Spanish sea bream |
| Pagellus bogaraveo | Red sea bream |
| Pagellus erythrinus | Pandora |
| Parablennius gattorugine | Tompot blenny |
| Petromyzon marinus | Sea lamprey |
| Pholis gunnellus | Butterfish |
| Phrynorhombus norvegicus | Norwegian topknot |
| Phycis blennoides | Greater forkbeard |
| Platichthys flesus | Flounder |
| Pleuronectes platessa | Plaice |
| Pollachius pollachius | Pollack |
| Pollachius virens | Saithe |
| Pterycombus brama | Atlantic fanfish |
| Raja brachyura | Blond ray |
| Raja clavata | Thornback ray |
| Raja montagui | Spotted ray |
| Raniceps raninus | Tadpole fish |
| Rostroraja alba | White skate |
| Salmo | NA |
| Salmo trutta trutta | Sea trout |
| Sardina pilchardus | Pilchard |
| Scomber colias | Atlantic chub mackerel |
| Scomber scombrus | Mackerel |
| Scophthalmus maximus | Turbot |
| Scophthalmus rhombus | Brill |
| Scorpaena scrofa | Scorpionfish |
| Scorpaenidae | NA |
| Scyliorhinus canicula | Lesser spotted dogfish |
| Scyliorhinus stellaris | Nurse hound |
| Sebastes mentella | Redfish |
| Sebastes norvegicus | Golden redfish |
| Sebastes viviparus | Norway haddock |
| Serranus scriba | Painted comber |
| Solea solea | Dover sole |
| Sprattus sprattus | Sprat |
| Squalus acanthias | Spurdog |
| Stomias boa ferox | Boa dragonfish |
| Syngnathus | NA |
| Syngnathus acus | Great pipefish |
| Syngnathus rostellatus | Nilsson's pipefish |
| Syngnathus typhle | Broad-nosed pipefish |
| Taurulus bubalis | Sea scorpion |
| Trachinus draco | Greater weever |
| Trachipterus arcticus | Dealfish |
| Trachurus trachurus | Horse mackerel |
| Trachyrincus murrayi | Murray's rat tail |
| Trigla lyra | Piper gurnard |
| Trigloporus lastoviza | Streaked gurnard |
| Triglops murrayi | Moustache sculpin |
| Trisopterus esmarkii | Norway pout |
| Trisopterus luscus | Bib |
| Trisopterus minutus | Poor cod |
| Xenodermichthys copei | Bluntsnout smooth-head |
| Zenopsis conchifer | Silvery John dory |
| Zeugopterus punctatus | Topknot |
| Zeugopterus regius | Eckstrom's topknot |
| Zeus faber | John dory |
| Zoarces viviparus | Viviparous blenny |
The dataset used for this assessment is the ‘The Groundfish Survey Monitoring and Assessment Data Product (Greenstreet & Moriarty, 2017a, b; Moriarty et al., 2017) derived from the IBTS survey.
The same community indices used in the 2011 Scottish Marine Atlas (Baxter et al., 2011) were applied to this assessment: Species Richness, the Shannon Diversity Index and the Large Fish Indicator. Species richness, diversity and size composition of the demersal fish community were assessed at the scale of ICES (International Council for the Exploration of the Sea) statistical rectangles (30 min latitude by 1 degree longitude, or ~ 30 nautical miles by 30 nautical miles). Within the assessment, the ICES rectangles included in the analyses were constrained to those rectangles which fell within the Scottish Marine Regions (SMRs) or Offshore Marine Regions (OMRs). The Faroe Shetland Channel, Bailey, Rockall and Hatton were not included in this assessment as these regions are covered in the deep sea fish assessment.
The Large Fish Indicator (as defined in EC 2010/477/EU) was calculated by taking the weight of demersal fish greater than 40 cm in length divided by the total weight of all demersal fish in each haul. The mean LFI value was calculated at the scale of each ICES rectangle over the time period of interest. Results are presented as descriptions of observations of the community indices plotted on the maps.
To examine trends, two time periods were chosen: 1999 to 2008 and 2009 to 2017. The 1999 to 2008 period was chosen to match the earlier assessment of the demersal fish community (Chapter 4 in Baxter et al., 2011). Mean values of each community indicator were calculated for each ICES rectangle within each of the defined assessment periods.
Results
All three community indicators show some change between the 2009 - 2017 and the 1999 - 2008 assessment periods.
Changes in species richness (Figure 2) and species diversity (Figure 3) are evident across these time periods, but magnitude and direction of this change differs spatially, with offshore areas showing decreases in both cases.
The Species Richness indicator has decreased in many offshore waters, but some increases are seen in some coastal waters between the West Highlands and the Outer Hebrides, north of the Orkney Islands and in coastal waters of North East Scotland.
Species diversity for 2009 - 2017, as indicated by the Shannon Diversity Index, has also increased in coastal waters, particularly around the West Highlands and Argyll, as well as waters around Orkney and the North East region. However, it decreased around Shetland and in many offshore waters.
In contrast to the two indicators relating to species composition, the Large Fish Indicator showed a widespread increase in value across assessed waters between the 1999-2008 and the 2009 - 2017 assessment periods (Figure 4). However, despite these increases, the LFI remains below the GES target of 0.3 (Figure 5) in the majority of cells assessed in 2009 - 2017.
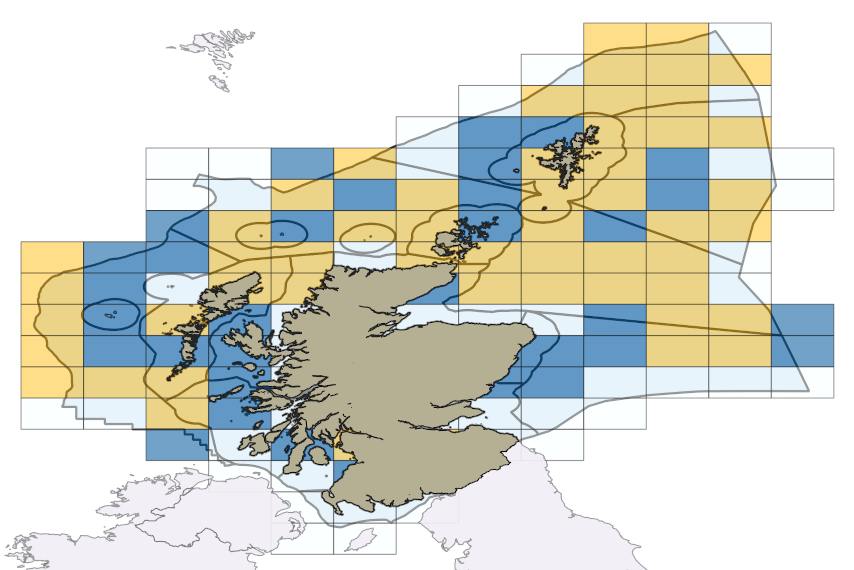
Figure 2: The difference in the Species Richness indicator between the 1999 - 2008 assessment period and the 2009 - 2017 assessment period.
Blue indicates an increase in the index (greater Species Richness), yellow a decrease (reduced Species Richness), and no colour reflects zero change. All maps show Scottish Marine Regions and Offshore Marine Regions, overlying ICES statistical rectangles.

Figure 3: The difference in the Shannon Diversity Index indicator between the 1999 - 2008 assessment period and the 2009 - 2017 assessment period.
Blue indicates an increase in the index (more diversity), yellow a decrease (less diversity), and no colour reflects zero change.
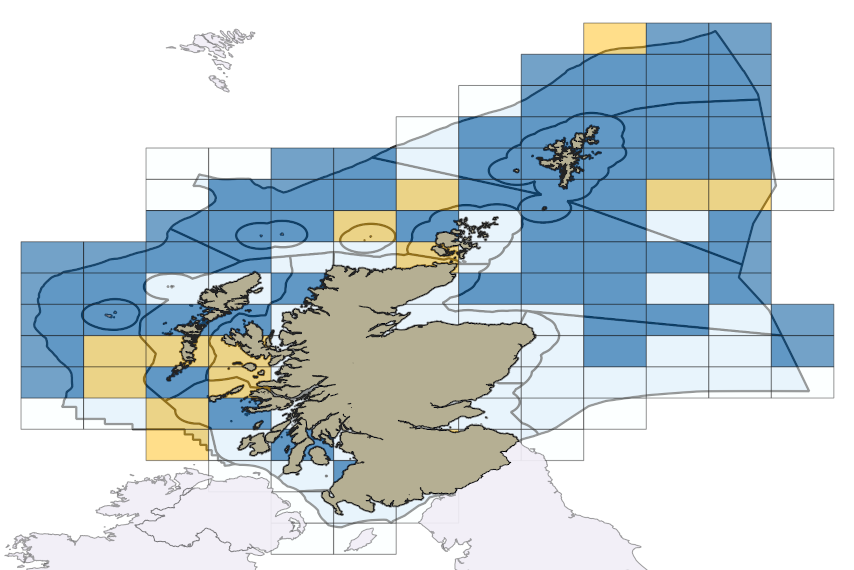
Figure 4: The difference in the Large Fish Indicator between the 1999 - 2008 assessment period and the 200 9 -2017 assessment period.
Blue indicates an increase in the index (more larger fish), yellow a decrease (less larger fish), and no colour reflects zero change.
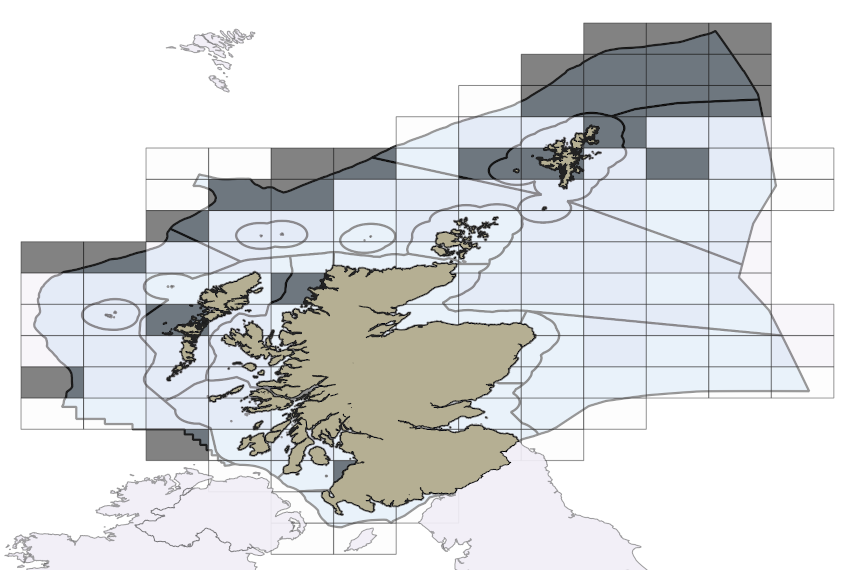
Figure 5: The Large Fish Indicator in the 2009 - 2017 assessment period with values above the GES criteria 0.3 in grey shading.
Maps for the individual community indicator values during the 2009 - 2017 and 1999 - 2008 assessment periods for: Species Richness (Figures b and c), Shannon Index (Figures d and e), and the Large Fish Indicator (Figures f and g). All maps show Scottish Marine Regions and Offshore Marine Regions, overlying ICES statistical rectangles.


Conclusion
The state of Scotland’s demersal fish community is partly influenced by human activities, such as commercial fishing, as well as factors such as climate change. Recent measures to reduce fishing mortality in Scottish waters have benefitted the demersal fish community (Engelhard et al., 2015). This may be reflected in the increased values for the Large Fish Indicator across assessed waters between the 1999 - 2008 and the 2009 - 2017 assessment periods. Whilst the exact nature of causality may be unclear, the LFI has been shown to be susceptible to changes in a small suite of species (Speirs et al., 2016) being driven by a handful of species rather than the full suite being assessed. It is also likely influenced by climate change (Queiros et al., 2018). Nevertheless, there remains a need for continued monitoring of demersal fish in Scottish waters.
The three indicators assessing the status of the wider fish community all show changes between the two assessment periods: 1999 - 2008 and 2009 - 2017. The magnitude and direction of changes in indicators reflecting species richness and species diversity varied spatially, however, offshore areas showed a consistent decrease in status across both indicators.
The most notable increase in status between the three community indicators examined, in terms of magnitude and spatial coverage, was found in the Large Fish Indicator. The LFI showed an increase in the majority of assessed cells during the current assessment period that was most pronounced in the waters to the west of the Outer Hebrides and around Shetland and north of Shetland. It is noteworthy that the waters to the west of Scotland also had increased values of the species richness and species diversity indicators.
Knowledge gaps
Rarest and perhaps most at risk species are not sampled sufficiently well to permit adequate assessment. Current levels of survey effort limit the applicability of analyses to those species that are adequately sampled at these levels of effort.
Status and trend assessment
A regional traffic light assessment would not be appropriate for the wider fish community given the large scale movement of many species and the conflicting patterns revealed by the indicators in this assessment. As such, only a Scotland wide status is presented.
|
Region assessed |
Status with confidence |
Trend with confidence |
|---|---|---|
| All Scotland |
|
|
This Legend block contains the key for the status and trend assessment, the confidence assessment and the assessment regions (SMRs and OMRs or other regions used). More information on the various regions used in SMA2020 is available on the Assessment processes and methods page.
Status and trend assessment
|
Status assessment
(for Clean and safe, Healthy and biologically diverse assessments)
|
Trend assessment
(for Clean and safe, Healthy and biologically diverse and Productive assessments)
|
||
|---|---|---|---|
 |
Many concerns |
No / little change |
|
 |
Some concerns |
Increasing |
|
 |
Few or no concerns |
Decreasing |
|
 |
Few or no concerns, but some local concerns |
No trend discernible |
|
 |
Few or no concerns, but many local concerns |
All trends | |
 |
Some concerns, but many local concerns |
||
 |
Lack of evidence / robust assessment criteria |
||
| Lack of regional evidence / robust assessment criteria, but no or few concerns for some local areas | |||
 |
Lack of regional evidence / robust assessment criteria, but some concerns for some local areas | ||
| Lack of regional evidence / robust assessment criteria, but many concerns for some local areas | |||
Confidence assessment
|
Symbol |
Confidence rating |
|---|---|
|
Low |
|
|
Medium |
|
|
High |

Assessment regions
 and the Scottish Offshore Marine Regions (OMRs, O1 – O10)")
Key: S1, Forth and Tay; S2, North East; S3, Moray Firth; S4 Orkney Islands, S5, Shetland Isles; S6, North Coast; S7, West Highlands; S8, Outer Hebrides; S9, Argyll; S10, Clyde; S11, Solway; O1, Long Forties, O2, Fladen and Moray Firth Offshore; O3, East Shetland Shelf; O4, North and West Shetland Shelf; O5, Faroe-Shetland Channel; O6, North Scotland Shelf; O7, Hebrides Shelf; O8, Bailey; O9, Rockall; O10, Hatton.
 Regions. These have been used as the assessment areas for hazardous substances.")
, Regions.")