

What, why and where?
Coastal erosion is a naturally occurring process which periodically affects soft shoreline. Coastal erosion and coastal flooding are interlinked and are considered jointly.
Flooding is the responsibility of the property owner. SEPA published the second National Flood Risk Assessment (NFRA) in December 2018. The NFRA identifies the areas at most risk of flooding and underpins flood response planning. Flood risk management strategies and local plans, prepared under the Flood Risk Management (Scotland) Act 2009 ensure that long-term proactive planning and investment decisions protect the areas at greatest risk of flooding. SEPA estimate that over 28,000 properties are at coastal flood risk.
Landowners are also responsible for protecting their property from coastal erosion. Local authorities have powers (but not obligations) under the Coast Protection Act 1949 to protect land from the sea and can fund coast protection work from their general capital grant from the Scottish Government.
Dynamic Coast, Scotland’s national coastal change assessment, identified past and anticipated coastal changes (e.g. Figure 1) across the erodible coast. This project identified that three-quarters of the £18bn of buildings and infrastructure within 50 m of the shoreline are protected by natural defences (£13bn) such as sand dunes; compared with artificial defences (£5bn) such as sea walls.
Coastal protection schemes since 2011.
Three schemes have been completed without grant aid since 2011; these are at Kirkcaldy (2014), £9.0M, Johnshaven (2012) and Benbecula Airport (2018). Network Rail has also completed three to protect coastal railways at Langbank (2015), Craigendoran (2018/2019) and Stranraer (2019/20).
Flood protection schemes since 2011.
The Scottish Flood Defence Asset Database lists completed schemes as: Dundee Water front (2018) £6.5M and Kirkwall (2019) £1.1M.
One managed realignment scheme was completed (in 2018 at the RSPB reserve at Skinflats (Firth of Forth)). Here flood defences protecting previously claimed land have been breached to allow in tidal water, to re-initiate natural processes.
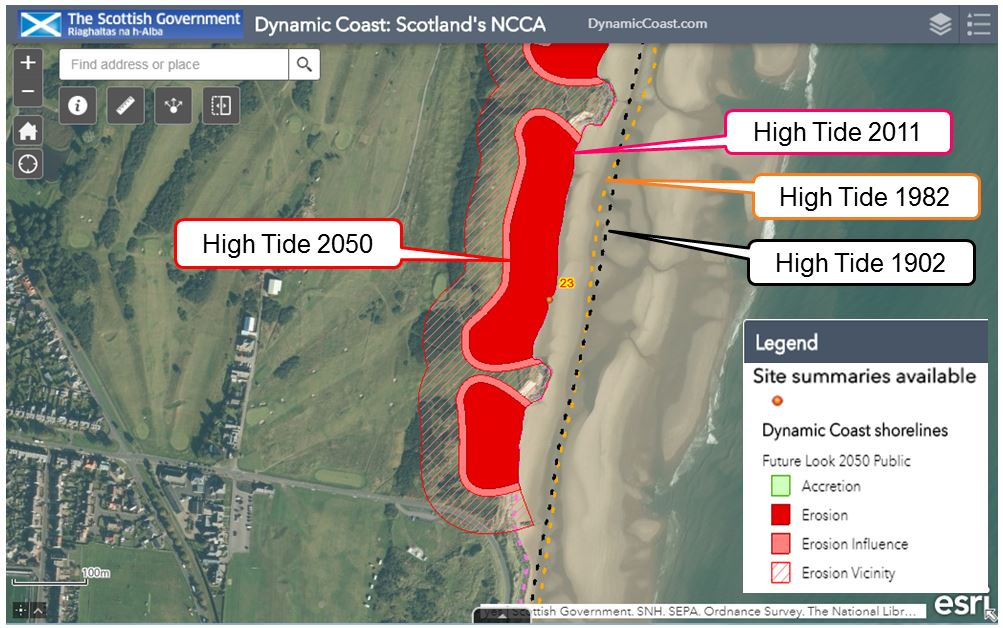
Figure 1: Past and anticipated coastal changes at Montrose (Angus), based on the historic, recent and modern tide line (Mean High Water Springs). Source: Dynamic Coast.
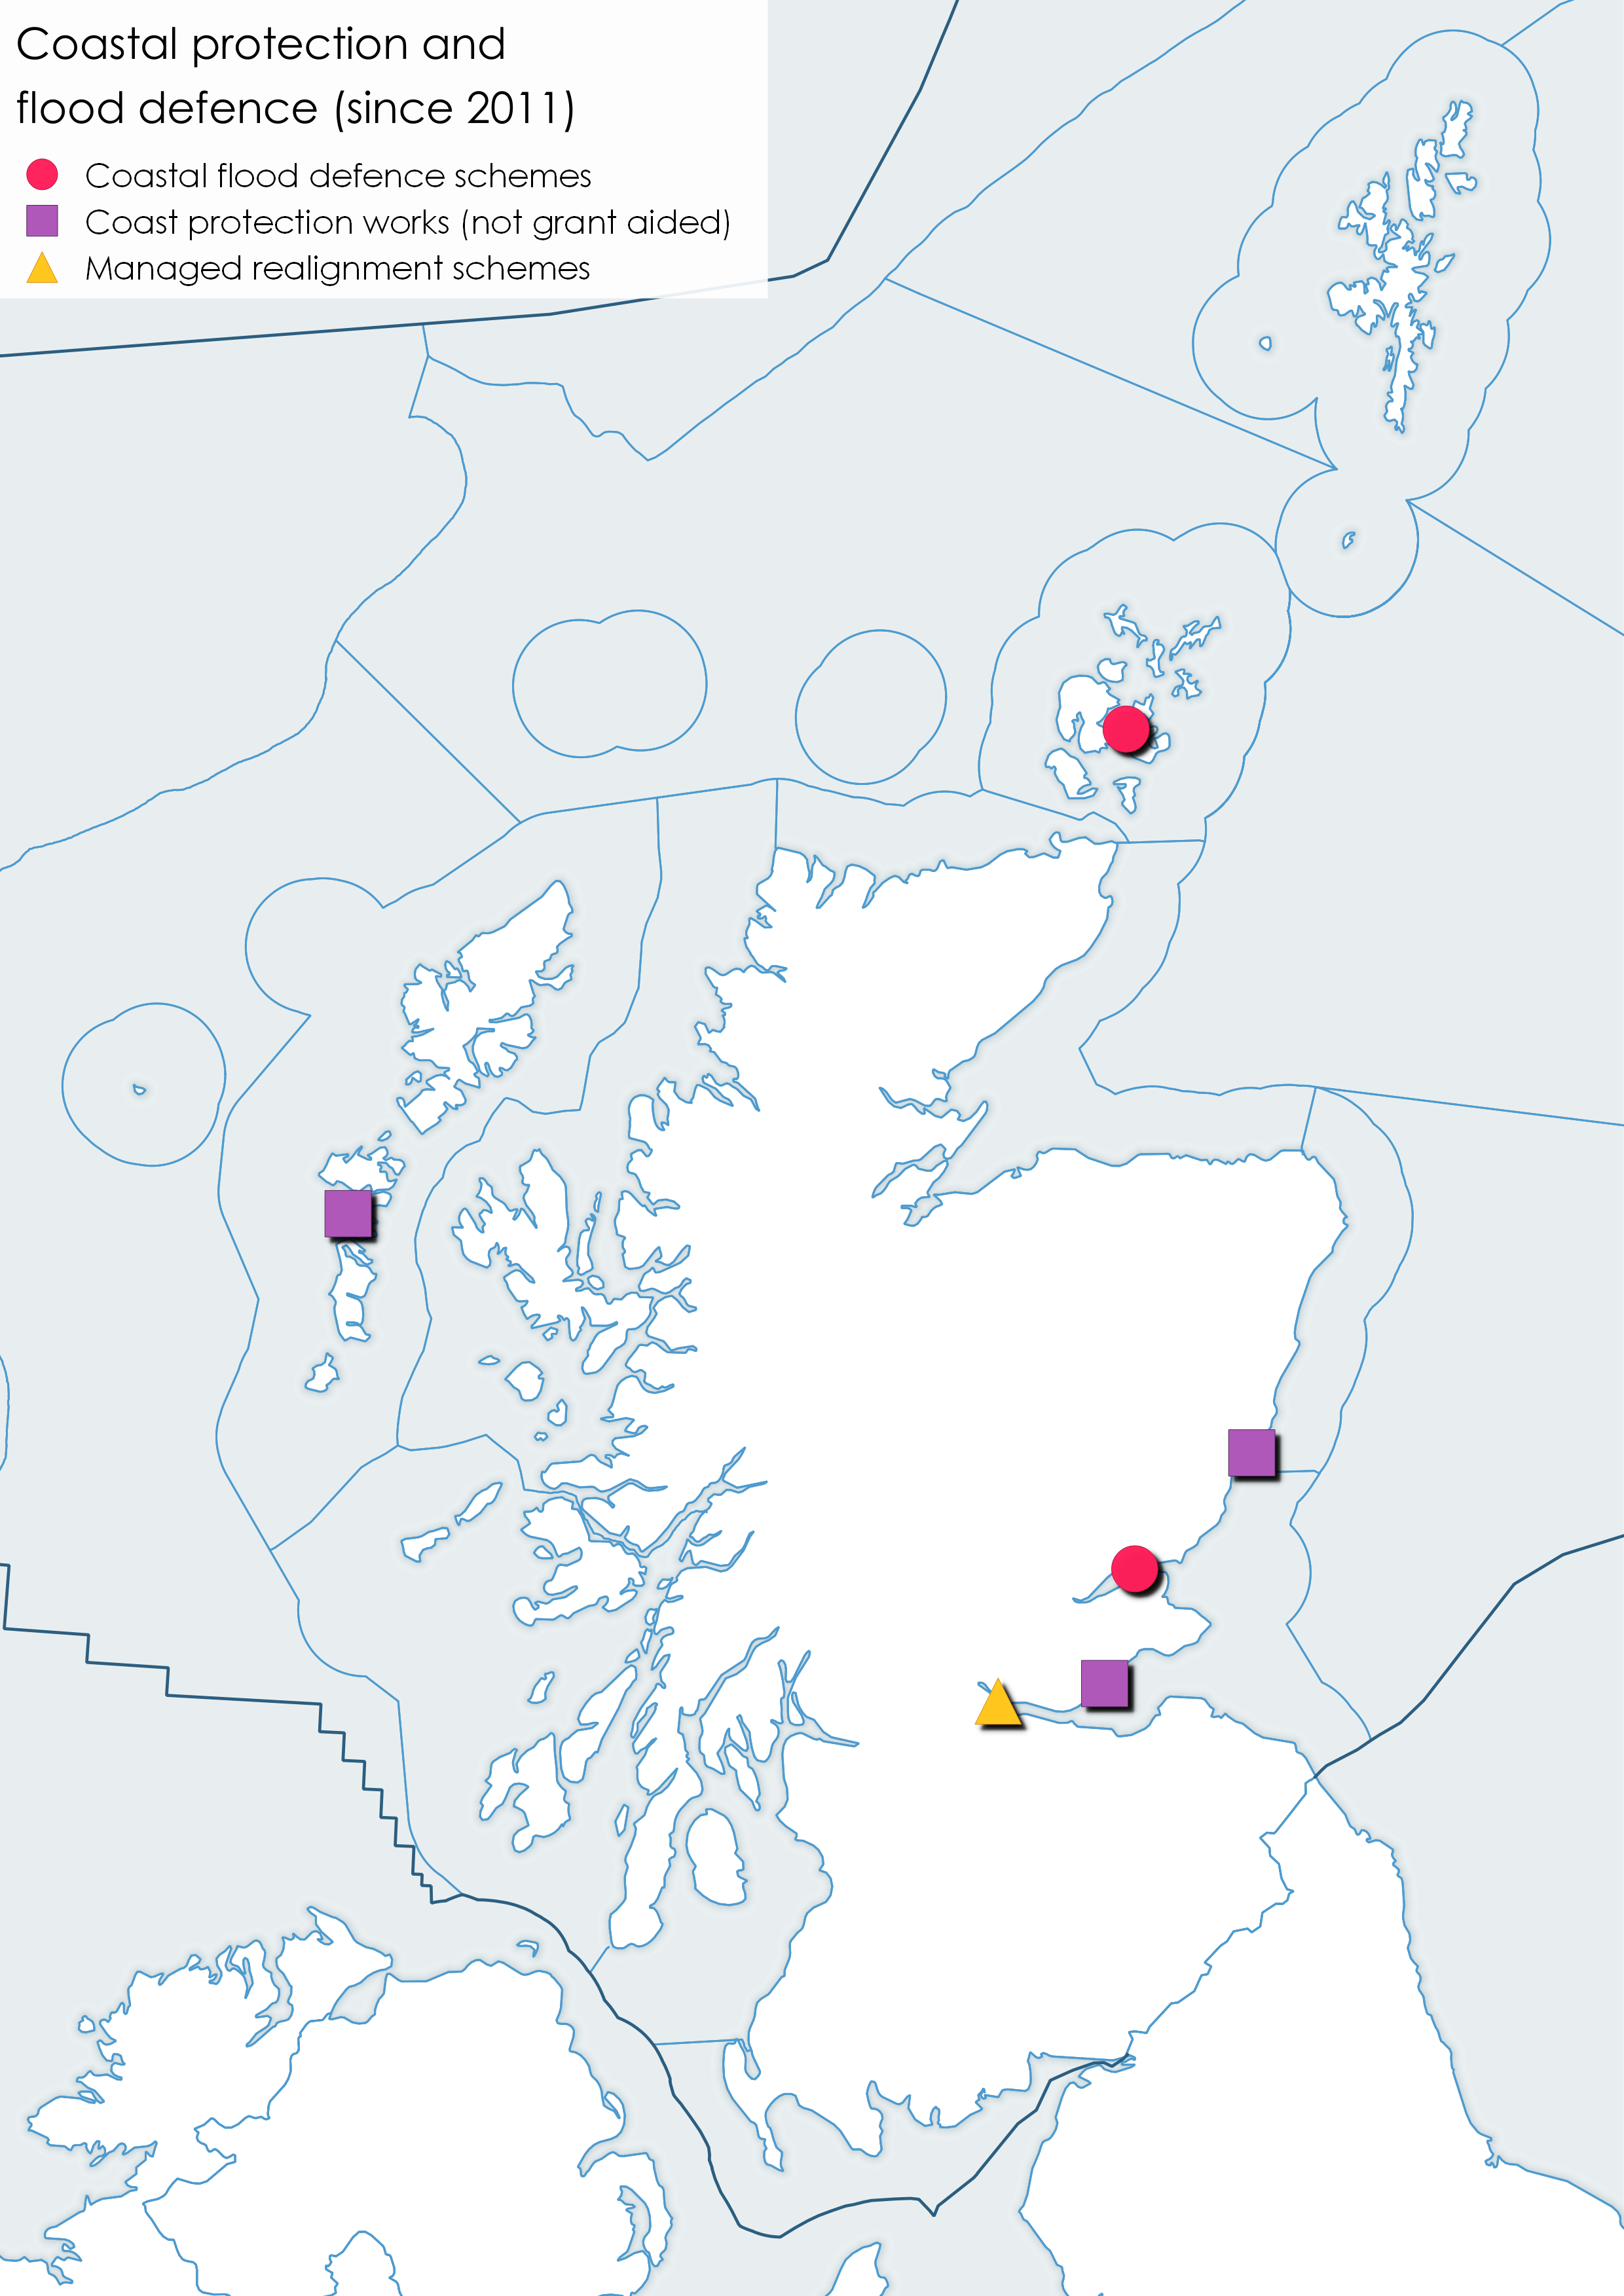
Figure 2: Coastal protection and Flood protection scheme locations since 2011 (excludes schemes under development). Source: Marine Scotland, Scottish Government and SEPA.
Hard rocky coast and other areas of mixed sediments that are largely resilient to coastal erosion dominate Scotland’s coastline. Dynamic Coast (2017) identified that together they make up a coastal length of 15,613 km or 78% of the shoreline by length. The ‘mixed’ description reflects that where superficial consolidated sediments (overburden) lies on top of bedrock it will have limited erosion potential. The soft coast makes up 19% of the shoreline by length, extending to 3,802 km; artificial coast makes up the remaining 3%, extending over 591 km. The distribution of these categories varies around the coast with the east coast (coastal cells 1-3) having a larger proportion of soft and artificial sections of coast and the north, west and island coasts (coastal cells 4-11) reflecting a long, rock-dominated and often fjordlike coastline (Figure a).
Use of coastal cells as a coastal management tool is based on a recognition that the processes that shape and alter the coast are unrelated to administrative boundaries but are related to changes and interruptions to sediment availability by natural boundaries (headlands). Changes in erosion, accretion and sediment supply in one coastal cell are regarded to be largely unrelated to, and unaffected by, conditions in adjacent coastal cells, and the cell can be seen as self-contained in terms of sediment movement. Within a cell, any engineering structures that interrupt alongshore sediment delivery on the updrift side of a coast may impact on the downdrift coast. Within estuaries, sediment may circulate freely between both banks and so the inner portions of major firths and estuaries are defined as sub-cells (Ramsey and Brampton, 2000). Whilst the cell system is ideal from a scientific perspective, it remains that Local Authorities jurisdiction may straddle a cell boundary. It should be noted that whereas there is some similarity between coastal cells and Scottish Marine Regions, they are not the same geographical areas.
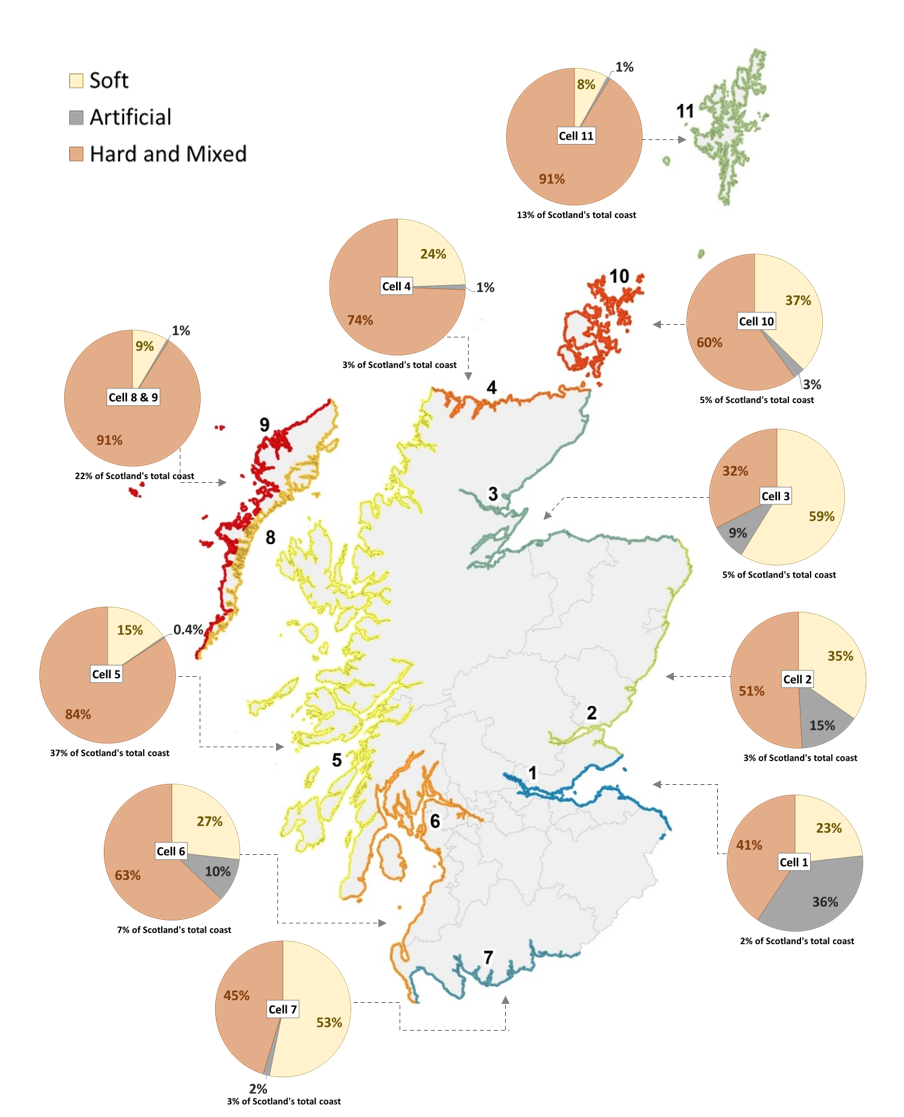
Figure a: Distribution of hard & mixed, soft and artificial coastlines in Scotland by coastal cell. Source: NCAA.
Where there is an overlap with coastal flood risk, the works to mitigate erosion can be included in the local flood risk management plan. If so, flood risk capital monies may be available. Shoreline Management Plans are not compulsory and only a few local authorities have voluntary plans.
The Dynamic Coast project highlights the important role of natural coastal defences protecting almost three-quarters of the £18bn of assets at the coastline. Such national-scale awareness-raising is important when considering future management demands, but so too are examples of local action.
St Andrews West Sand Partnership has been ‘Building with Nature’ for decades, by enhancing the resilience of their beaches, sand dunes and salt marshes.
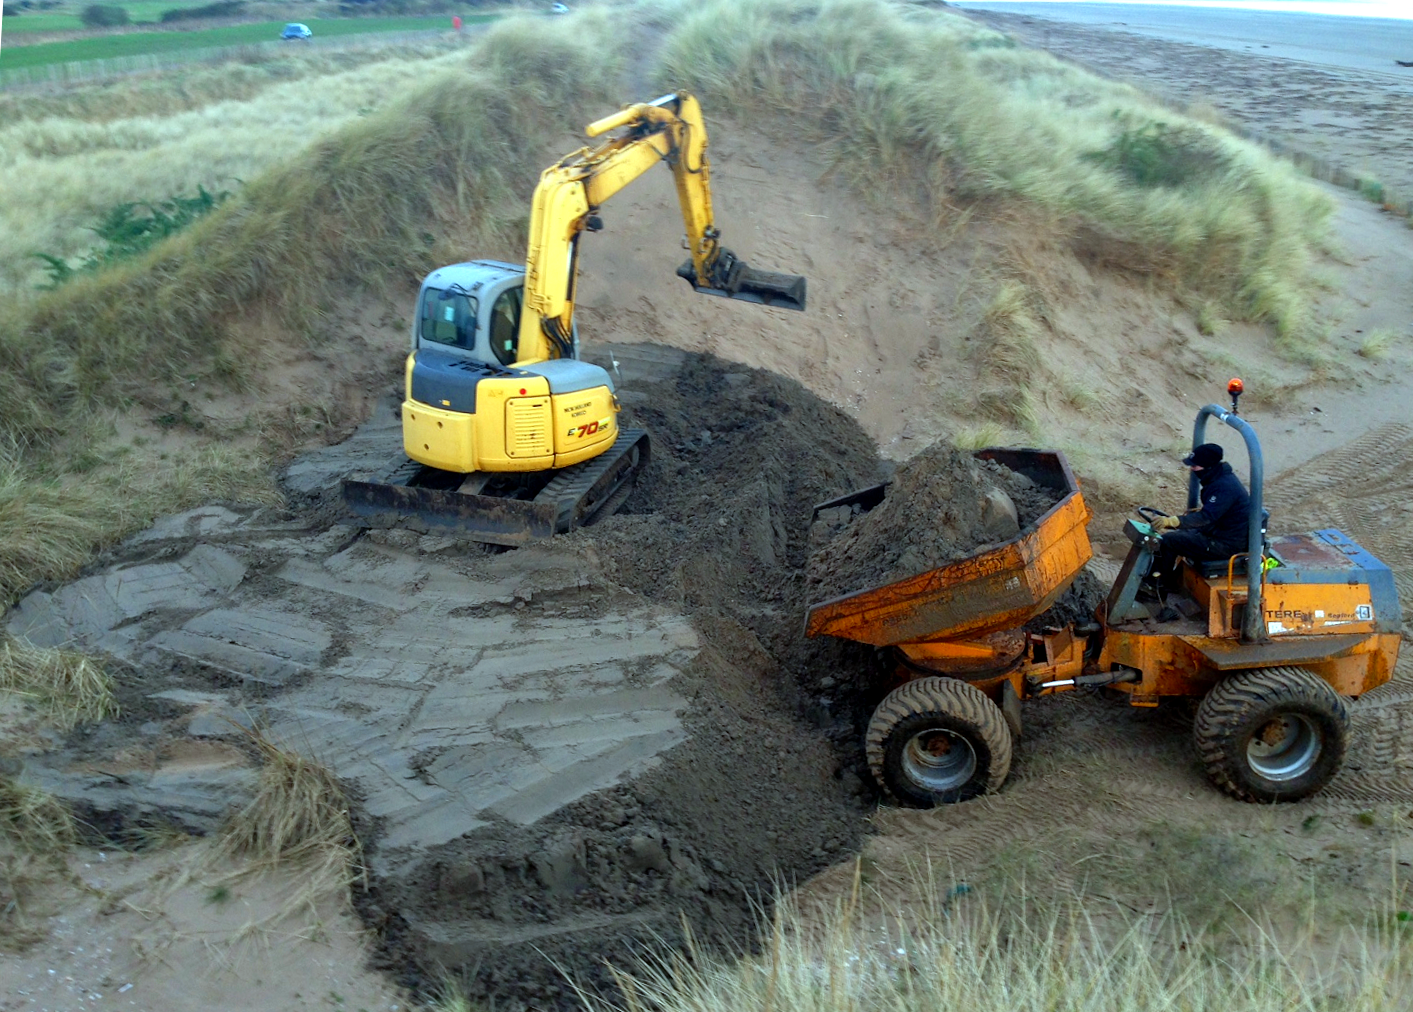
Figure b: St Andrews Links repair the natural coastal defences protecting golf course from flooding and erosion (2016). © G. Moir.
The majority of coastal settlements and infrastructure were built before flood and erosion risk assessments were available and before awareness of increased threat posed from climate change. As a result current protection schemes are addressing this historic deficit whilst also attempting to safeguard such assets from future climate change.
The frequency of coastal flood events is increasing due to rises in mean sea level, and this is expected to continue throughout the century.
The Dynamic Coast project has shown that the extent of shoreline that is building seawards (accreting) has fallen by 22%. The extent eroding has increased 39% since the 1970s compared with the historic baseline. The rate of coastal erosion has also doubled to an average of 1m per year, since the 1970s. This pattern is consistent with climate change expectations and more extensive and rapid erosion is anticipated in the coming decades.
The Dynamic Coast project has transformed the understanding of coastal change. The first phase of research (2015 to 2017) established a National Coastal Change Assessment (NCCA). This summarised 130 years of coastal change across all of Scotland’s erodible shores (beaches, dunes and saltmarshes) and projected the changes forward to 2050. The results are available in maps and reports on the Dynamic Coast web site.
Phase 2 of the research (2018 - 2020) aims to ‘enhance the evidence base and ability to adapt’. Concluding in 2020 it considers multiple research questions including: the extent and resilience of natural coastal flood protection features; climate change accelerations; technological improvements and the development of adaptation and resilience plans at 7 super sites.
The erosion maps available at DynamicCoast.com, join SEPA’s flood maps enabling communities and developers to better understand the risks and plan ahead.
The Dynamic Coast project used over one million data points to compare the changes during the historic period (1890s to 1970s) and recent period (1970s to modern) across Scotland. Where the amount of recent erosion was greater than potential mapping errors (10m or 0.5m/yr) then the recent annual erosion rate was projected landwards to consider areas at future risk. The anticipated erosion areas were only projected landwards in areas thought to be susceptible to erosion (Coastal Erosion Susceptibility Model).
The coastal changes are available as online web maps and the changes and assets at risk have been summarised via ten summary reports. Figure 1 shows the historic (1902), recent (1982) and modern (2011) shoreline at Montrose alongside the anticipated 2050 shoreline.
Some of the main findings from phase 1 are:
- Artificial coast (protected by human structures with no beach frontage) was identified within the National Coastal Change Assessment, based on an analysis of geological datasets and aerial imagery, and is depicted on the OS MasterMap MHWS line.
- The artificial coast measured 541 kms in the 1970s and 590 kms in modern mapping. More than 90% of defences were installed before the 1970s maps but the lack of comprehensive modern air photography to corroborate means the modern extents are an underestimate.
- The soft coastline (coasts with the potential to erode) makes up 19% (3,802 kms) of the Scottish coast. However, between a half and a third of all coastal buildings, roads, rail and water network lie in these erodible sections.
- Since the 1970s, 865 kms of the soft coastline has moved position: 11% (423 kms) has advanced (accreted); 12% (442 kms) has retreated (eroded); and the remaining 77% (2,936 kms) has remained approximately stable.
- Compared with the historic period (1890 to 1970 and adjusted for time period), the proportion of advancing coast has fallen by 22%, since the 1970s. The proportion of retreating coast has increased by 39%. Larger shifts in the balance of erosion and accretion are found particularly on the east coast and Solway Firth.
- Where coastal changes occur, they are faster than before. Nationally, average erosion rates since the 1970s have doubled from before to 1.0 m/yr whilst accretion rates have almost doubled to 1.5 m/yr.
- The observed changes since the 1970s are consistent with expectations of climate change.
- The NCCA has established the total length of the Mean High Water Spring tideline in Scotland is 21,305 kms, based on the Ordnance Survey’s MasterMap dataset (captured at 1:1,250, 1:2,500 and 1:10,000 scales in urban, rural and mountain/moorland areas respectively).
Phase 2 of the research (2018 - 2020) will:
- Create a map and spatial database summarising natural coastal defence features.
- Consider implications of an expansion and acceleration of erosion due to climate change.
- Use new technologies to enhance understanding of coastal changes (including vegetation edge).
- Develop Adaptation & Resilience plans at 7 Super Sites, based on detailed assessments.
- Develop sector summary cards to increase adaptational awareness.
- Consider social vulnerability of coastal erosion.
- Trial novel Earth observation technologies to improve coastal change.
The Scottish Flood Defence Asset Database (SFDAD) provides flood risk management practitioners with information on fluvial and coastal flood protection schemes, including where defences exist, the level of protection provided (which may now be out-of-date) and the general areas benefitting from them.
|
Ref
|
Location
|
Details
|
Cost (£M)
|
|
A
|
Dundee water front (2018)
Forth and Tay SMR
|
Dundee flood protection scheme protects the £1 billion water front development as well as homes and roads between the docks and the airport. A variety of materials were used including reinforced concrete, concrete blocks and natural stone to build a new, set-back flood defence wall, as well as flood gates to facilitate pedestrian, cyclist and vehicle access.
Works which provide a 1 in 200 year standard of protection including an allowance for climate change were completed in 2018.
|
6.5
|
|
B
|
Kirkwall (2015)
Orkney Islands SMR
|
The Kirkwall flood protection scheme is designed to protect low lying parts of central Kirkwall from coastal flooding. The scheme includes is designed to a 1 in 200 year standard of protection including an allowance for climate change.
The stone clad seawall along the harbour is augmented with glass panels and flood gates creating a 1.1 m high uninterrupted barrier, approximately 750 metres in length between Ayre Mills and St Catherine’s Place.
Works were completed and flood gates tested in 2019
|
1.1 |
|
Ref
|
Location
|
Details
|
|
1
|
Johnshaven (2012)
(North East SMR)
|
Constructed in 2 phases, rock armour protection along approximately 250m shoreline to protect roads and properties from flooding and erosion. Completed between 2009 and 2012.
Funded directly by Aberdeenshire Council
|
|
2
|
Kirkcaldy (2014)
Forth and Tay SMR
|
The seawall was refurbished and heightened by 0.5 m. New seating and lighting was installed to make it a more attractive place for locals and visitors to enjoy.
The promenade was raised by 0.25 m and five new access ramps to the beach installed. Rock armour was placed along the 1.8 km of the frontage
Works were completed in 2014. The costs of £9m were met by Fife Council.
|
|
3
|
Benbecula Airport (2018)
(Outer Hebrides SMR)
|
Highlands and Islands Airports Ltd completed Phase 3 of works to protect Benbecula airport from erosion and flooding.
|
|
Ref
|
Location
|
Details
|
|
4
|
Craigendoran
(2018/2019)
|
Network Rail will carry out civil engineering work which will reduce flood risk to identified sections of the rail network. Works planned to Craigendoran Coastal Defence for 2018/19. Works to improve durability of the wall and backfill during storm conditions and overtopping. Works are to ensure the wall's stability against wave action and overtopping, reducing the risk of line closure or speed restriction.
|
|
5
|
Langbank (2015)
(Clyde SMR)
|
Network Rail carried out civil engineering work to reduce flood risk to identified sections of the rail network. Langbank Coastal Defence works were completed in 2015. The works involved laying rock armour protection to the track embankment.
|
|
6
|
Stranraer (2019/20)
(Solway SMR)
|
The Network Rail Initial Industry Plan is being developed for submission to The Scottish Government September 2016. Stranraer Harbour Coastal Defence. Works scheduled for 2019/20. Works involve identifying the extent of voiding and implementing a repair solution.
|
Contribution to the economy
Coastal protection and flood protection schemes do not in themselves contribute to economic Gross Value Added (GVA). Work under both coastal erosion and flood risk management can be viewed as preventative spend as they help limit damage to property, reduce business losses and protect livelihoods. Each project undergoes detailed cost benefit analysis to determine the best scheme option. The potential losses are categorised as:
- Residential and non-residential properties
- People
- Community facilities
- Utilities assets
- Transport links
- Environmental designated areas
- Designated cultural heritage sites
- Agricultural land
For the flood protection schemes listed above SEPA estimate, for various risk levels, the anticipated risk to people and damage likely to be incurred without flood and coastal defence (see example on SEPA web site). These damages are used to balance the cost of mitigating flooding against the losses that could be incurred. These are then used to estimate the potential economic benefit of the scheme.
For example, the Dundee flood protection scheme, completed in 2018, costing £6.5m, protects the £1 billion water front development as well as homes and roads between the docks and the airport.
The damage mitigated by a flood scheme does not always outweigh the estimated costs of construction and this must be assessed for each option.
Coastal erosion and flood risk are interlinked. Both can have a devastating impact on the lives, businesses and communities of those affected. People whose homes are flooded may need to be in temporary accommodation for many months. The impact on local businesses can be great and in some cases businesses never re-open after a flood.
It has not been possible to determine a trend since the previous assessment, even at the national level, as budgets are not always declared and schemes can take several years to implement.
Following an agreement with COSLA (Convention of Scottish Local Authorities) in 2016 Scottish Government guarantees a minimum of £42M each year until 2026 to fund prioritised flood risk management actions, including flood schemes. This agreement gives local authorities certainty to deliver the actions set out in the Local Flood Risk Management Plans. Local Authorities can also allocate additional resources from within their overall funding.
Examples of socio-economic effects
- Protection of people, property, businesses and infrastructure.
- Conserving or enhancing amenity value of coastal land.
- Options such as salt marsh habitat creates defence with lower maintenance cost.
- Maintenance and sustainability in the face of sea level and climate change.
- Disruption during construction.
- May encourage development in low lying areas.
Pressures on the environment
An OSPAR agreed list of marine pressures is used to help assessments of human activities in the marine environment. The marine pressure list has been adapted for use in Scotland via work on the Feature Activity Sensitivity Tool (FeAST). Coastal erosion and flood risk management activities can be associated with 20 marine pressures – please read the pressure descriptions and benchmarks for further detail.
The list of marine pressures is used to help standardise assessments of activities on the marine environment, and is adapted from an agreed list prepared by OSPAR Intercessional Correspondence Group on Cumulative Effects (ICG-C) (see OSPAR 2014-02 ‘OSPAR Joint Assessment and Monitoring Programme (JAMP) 2014-2021’ Update 2018’ (Table II).
The Feature Activity Sensitivity Tool (FeAST) uses the marine pressure list to allow users to investigate the sensitivity of Scottish marine features. It also associates all pressures that might be exerted by a defined list of activities at a particular benchmark. The extent and impact of each pressure from a given activity will vary according to its intensity or frequency. The extent and impact of the pressure will also vary depending on the sensitivity of the habitat or species on which it is acting. The existence of multiple activities, and potentially multiple pressures, at specific locations will result in a cumulative impact on the environment.
FeAST is a developing tool. A snap shot from 2019 was used for the development of SMA2020. Please consult the FeAST webpage for further information and up to date information.
The list of pressures below associated with this activity is given in alphabetical order. Clicking the pressure will give you more information on the pressure and examples of how it may be associated with the activity.
Nature is playing an important role along the coast protecting properties and communities from flooding. It is essential to understand how to protect these natural assets. The Flood Risk Management (Scotland) Act 2009 requires SEPA to identify and map all natural and artificial structures that might pose a significant flood risk if removed. SEPA aim to complete this work in 2020. The map will help stakeholders recognise the protection structures such as sand dunes and salt marshes provide.
Dynamic Coast and SEPA flood maps can help stakeholders better plan coastal developments to ensure that they are resilient to the impacts of flooding and erosion now and in the future.
When natural features are protected or enhanced they can provide additional amenity benefits for the community and improved or new habitats for wildlife.
Forward look
SEPA’s 2018 national flood risk assessment estimates that with climate change the number of properties at risk from coastal flooding is expected to increase to over 54,000 properties by 2080s.
Evidence from the Dynamic Coast project helps identify and anticipate coastal changes to better adapt to sea level rises of up to 0.9 m forecast along the east coast by the end of the century.
The anticipated increase in extent and rate of coastal erosion due to increased sea level rise is being investigated by the second phase of Dynamic Coast research; this will be published in 2020.
Findings from the Dynamic Coast 1 show that:
- if recent erosion rates were to continue in the future, by 2050 at least 50 residential and non-residential buildings, 1.6 kms of railway, 5.2 kms of road and 2.4 kms of clean water network as well as significant areas of runways, cultural and natural heritage sites are expected to be affected by coastal erosion. These numbers are likely to be underestimates.
- if erosion rates increase in the future, as expected with climate change, Dynamic Coast and SEPA’s National Flood Risk Assessment are likely to underestimate the extent of assets at risk from future coastal erosion and associated coastal flooding. Large numbers of assets are sited close to potentially erodible coasts (including 30,000 buildings, 1,300 km of roads and 100 kms of railway lines).
To help mitigate the effects of coastal flood risk a number of coastal flood protection schemes are under development.
- South Ford (South Uist) (Comhairle nan Eilean Siar) starting 2020 - to reduce flood risk on South Uist as well as the southern coast of Benbecula. To include the construction of embankments, beach recharge at Gualan Island, sand dune/machair restoration and maybe property level protection for any residual risk.
- Broughty Ferry (Dundee City) starting 2019 - to include new sea walls and set-back embankments, sand dune replenishment and rock armour to provide a 1 in 200 year standard of protection.
- Caol (Highland) starting 2020/21 – to include sections of embankments, sheet piled and concrete retaining walls, and rock armour revetments along the embankment to reduce wave overtopping and protect against erosion.
- Millport (North Ayrshire) – the current option includes a breakwater with flood walls which will also protect against wave overtopping and erosion. Options will be available for statutory consultation in 2020 with an anticipated construction date in autumn 2021.
There are also fluvial schemes under development that have an associated elements of coastal flood protection at:
- Whitesands (Solway SMR),
- Arbroath, Grangemouth, Musselburgh and Stirling (Forth and Tay SMR),
- Gruggies Burn Dumbarton (Clyde SMR).
|
Ref
|
Location
|
Details
|
|
1
|
South Ford (Outer Hebrides SMR)
|
The South Fords Scheme aims to reduce flood risk on South Uist as well as the southern coast of Benbecula. The scheme will likely include the construction of embankments, beach recharge at Gualan Island, sand dune/machair restoration.
The flood protection scheme is being designed to a standard of 1 in 100 years (locally 1 in 200 years) and will include an allowance for climate change. Construction is expected to commence in 2020.
|
|
2
|
Broughty Ferry (Forth and Tay SMR)
|
The 1 km scheme protecting Brought Ferry comprises new sea walls including set back walls and stepped revetments with standard of protection of 1 in 200 years.
|
|
3
|
Caol (West Highland)
|
The Caol Flood Protection Scheme includes sections of embankments, sheet piled and concrete retaining walls, and rock armour revetments along the embankment to reduce wave overtopping and protect against erosion. The scheme has a standard of protection of 1 in 200 years. Construction is expected to be complete before the end 2021. Cost is estimated at £9.7 million
|
|
4
|
Millport (Clyde SMR)
|
It is recommended that the council progress work on the proposed coastal flood protection scheme for Millport. The scheme includes a breakwater with flood walls. These will also protect against wave overtopping and erosion.
|
|
The following schemes under development are primarily fluvial but have an element of coastal flooding to a greater or lesser extent
|
||
|
5
|
Arbroath (Forth and Tay SMR)
|
Coastal flood defences are proposed for Arbroath to complement the flood protection works on the Brothock Water. The scheme is expected to provide a 1 in 200 Standard of Protection.
|
|
6
|
Whitesands (Solway SMR)
|
This scheme is primarily for river flooding from the Nith. The area does have a tidal influence, so it does help with coastal events, however, this element is very minimal at present.
|
|
7
|
Grangemouth (Forth and Tay SMR)
|
A flood protection scheme has been proposed for the Grangemouth area. It would include the River Carron, Grange Burn, River Avon and the Forth Estuary shoreline. The scheme would consist of flood defences, sediment management, tidal barriers/ gates and natural flood management and would provide a 1 in 200 year standard of protection. Implementation of this scheme is likely to span a 10 year period from 2017 - 2027.
|
|
8
|
Musselburgh (Forth and Tay SMR)
|
A flood protection scheme has been proposed for Musselburgh to reduce flood risk from the River Esk and tidal surges. The scheme would consist of flood defences and earth embankments and would provide a 1 in 200 year standard of protection. Scheme development will also include natural flood management elements.
|
|
9
|
Stirling (Forth and Tay SMR)
|
A flood protection scheme has been proposed for Stirling. The scheme would consist of flood embankments and would provide a 1 in 200 year standard of protection.
This scheme is principally fluvial but will provide protection from the Upper Forth Estuary.
|
|
10
|
Gruggies Burn, Dumbarton (Clyde SMR)
|
The Council is undertaking preparation work on the proposed flood protection scheme for Gruggies Burn. Further design work is required to refine the preferred option for the scheme, which at present is to maximise upstream flood storage and construct defences from Hunter's Burn to Castle Street, and downstream of Castlegreen Street, to address coastal flooding. In addition to these actions the use of property level protection within the scheme will be investigated.
|
Information from phase 2 of Dynamic Coast will help identify the lengths of coastline at most risk and the assets along those coastlines. Local authorities and other landowners will be able to use this information to estimate the costs and benefits of carrying out coast protection works.
Economic trend assessment
Trend assessments are not applicable to coast protection and flood defence. While the quantity and location of projects changes, there are no discernible time series either at the national or regional level that provide a meaningful indication for progress. Trend assessment is made more difficult as the risks posed by climate change and continued development pressure mean there is an increasing risk of assets being damaged from coastal flooding and coastal erosion.
This Legend block contains the key for the status and trend assessment, the confidence assessment and the assessment regions (SMRs and OMRs or other regions used). More information on the various regions used in SMA2020 is available on the Assessment processes and methods page.
Status and trend assessment
|
Status assessment
(for Clean and safe, Healthy and biologically diverse assessments)
|
Trend assessment
(for Clean and safe, Healthy and biologically diverse and Productive assessments)
|
||
|---|---|---|---|
 |
Many concerns |
No / little change |
|
 |
Some concerns |
Increasing |
|
 |
Few or no concerns |
Decreasing |
|
 |
Few or no concerns, but some local concerns |
No trend discernible |
|
 |
Few or no concerns, but many local concerns |
All trends | |
 |
Some concerns, but many local concerns |
||
 |
Lack of evidence / robust assessment criteria |
||
| Lack of regional evidence / robust assessment criteria, but no or few concerns for some local areas | |||
 |
Lack of regional evidence / robust assessment criteria, but some concerns for some local areas | ||
| Lack of regional evidence / robust assessment criteria, but many concerns for some local areas | |||
Confidence assessment
|
Symbol |
Confidence rating |
|---|---|
|
Low |
|
|
Medium |
|
|
High |

Assessment regions
 and the Scottish Offshore Marine Regions (OMRs, O1 – O10)")
Key: S1, Forth and Tay; S2, North East; S3, Moray Firth; S4 Orkney Islands, S5, Shetland Isles; S6, North Coast; S7, West Highlands; S8, Outer Hebrides; S9, Argyll; S10, Clyde; S11, Solway; O1, Long Forties, O2, Fladen and Moray Firth Offshore; O3, East Shetland Shelf; O4, North and West Shetland Shelf; O5, Faroe-Shetland Channel; O6, North Scotland Shelf; O7, Hebrides Shelf; O8, Bailey; O9, Rockall; O10, Hatton.
 Regions. These have been used as the assessment areas for hazardous substances.")
, Regions.")