
What, why and where?
Submarine cables are critical infrastructure, delivering communications, internet, and power inwards to Scotland and outwards to international partners via an extensive network totalling 6,120 km (Figure 1) (6,006 km active; 114 km under construction). Cables are generally owned and operated by private or corporate entities. There are also military cables on the seabed, which are not covered here.
Telecommunication cables are responsible for approx. 99% of global communications and carry telephone calls, internet connections and data.
There are numerous international submarine cables connecting Scotland and the rest of the UK to the global digital economy. There are also domestic fibre optic inter-island cables delivering broadband to remote communities.
Telecommunications cables are predominantly fibre optic, and have different requirements for installation, maintenance and general handling than subsea power cables which vary significantly in size and weight.
There have been about 400 km of new fibre optic cables laid since 2011 including the Highlands and Islands project connecting numerous Scottish Islands with high capacity fibre optic broadband connections (Figure 2).
Power cables
There are three main types of power cable installed:
- Distribution cables - link the Scottish mainland to the islands, except Shetland and Fair isle, and interconnections between islands.
- Transmission cables - provide bulk transport of power between areas of power generation and centres of demand.
- Export cables - provide a connection between offshore generation sites such as wind, wave or tidal energy farms.
Power cables completed since 2011 include the Kintyre to Hunterston cable (220kV high voltage alternating current (HVAC)) and the Caithness to Moray cable (320kV high voltage direct current (HVDC)).
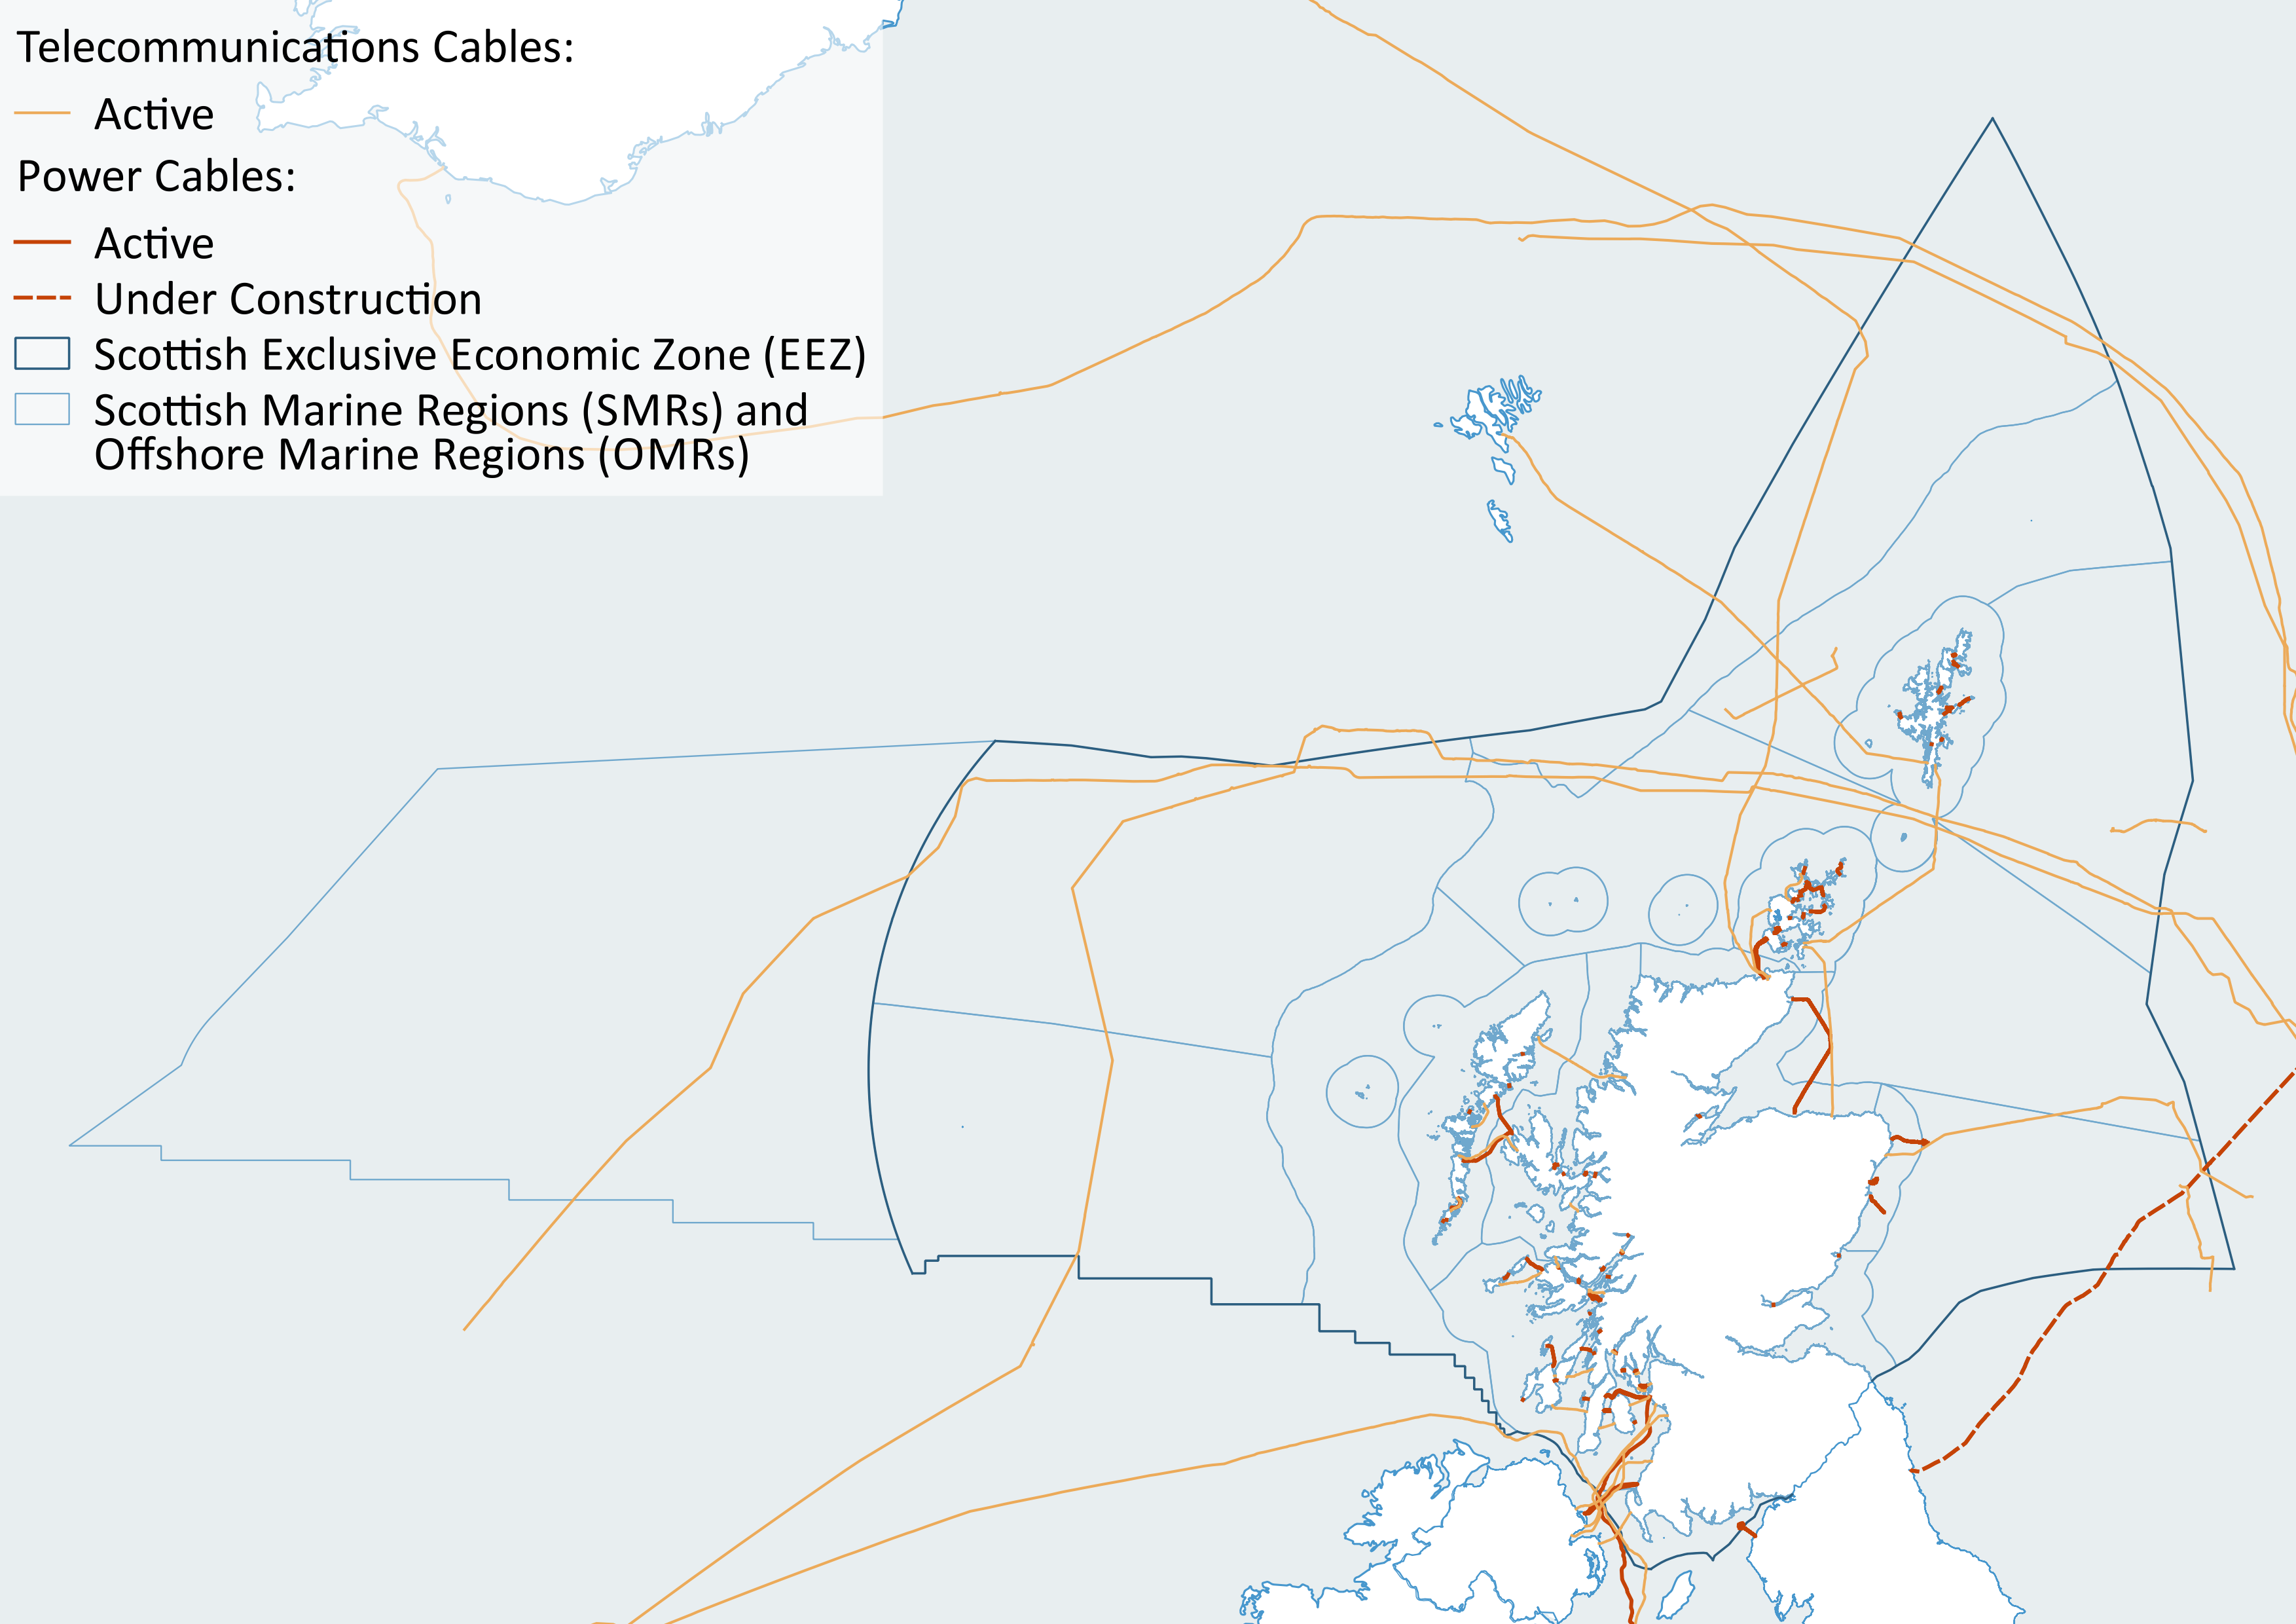
Figure 1: Active and under construction telecommunications and power cables in Scottish seas (July 2019). Source: KIS-ORCA / MS Maps NMPi.
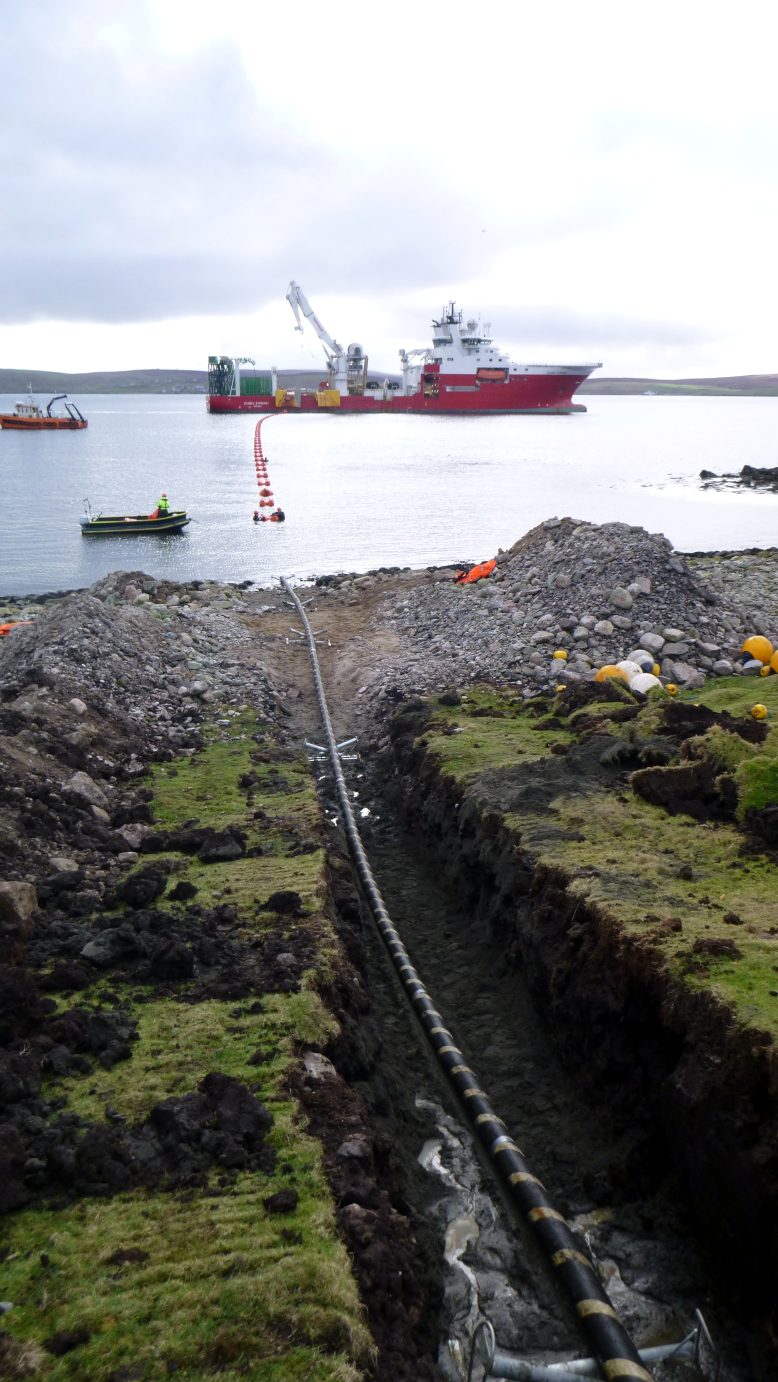
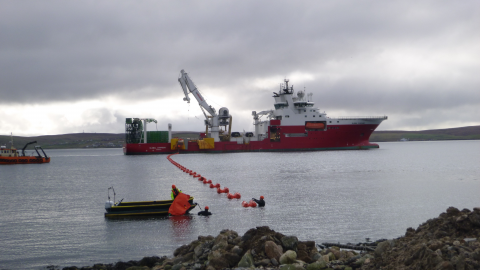
Figure 2: Global Symphony cable laying in Shetland. © Global Marine Group.
When designing a cable route, the engineer will seek a suitable route around any seabed obstructions (natural or man-made) and aim for soft sediment where they can be buried. However in some areas of Scottish waters this is not possible and cables are laid on the seabed surface due to rocky seabed or other reasons: so there are both buried and surface laid cables. Cables may also be protected with additional measures such as rock placement, rock bags or concrete mattresses.
Today, new international telecommunications cables are exclusively fibre optic which carries many thousands of simultaneous transmissions. Domestic inter-island cables have been upgraded in the last few years and there is now a significant fibre optic network domestically in Scottish waters as well as some copper cables still in existence.
The Scottish Government had responsibility for designing and implementing fibre broadband roll-out in Scotland, which led to the Digital Scotland Superfast Broadband (DSSB) programme beginning in 2013. The programme was split into two projects – one focusing on the Highlands and Islands and the other covering the ‘Rest of Scotland’ (RoS).
As part of the deployment, approximately 11,000 km of new fibre and copper cable were installed, including approximately 400 km of new subsea cable (e.g. connecting the Outer Hebrides to the mainland, and the Western Isles). New subsea cable was provided for 20 crossings to the Scottish Isles (Figure a).
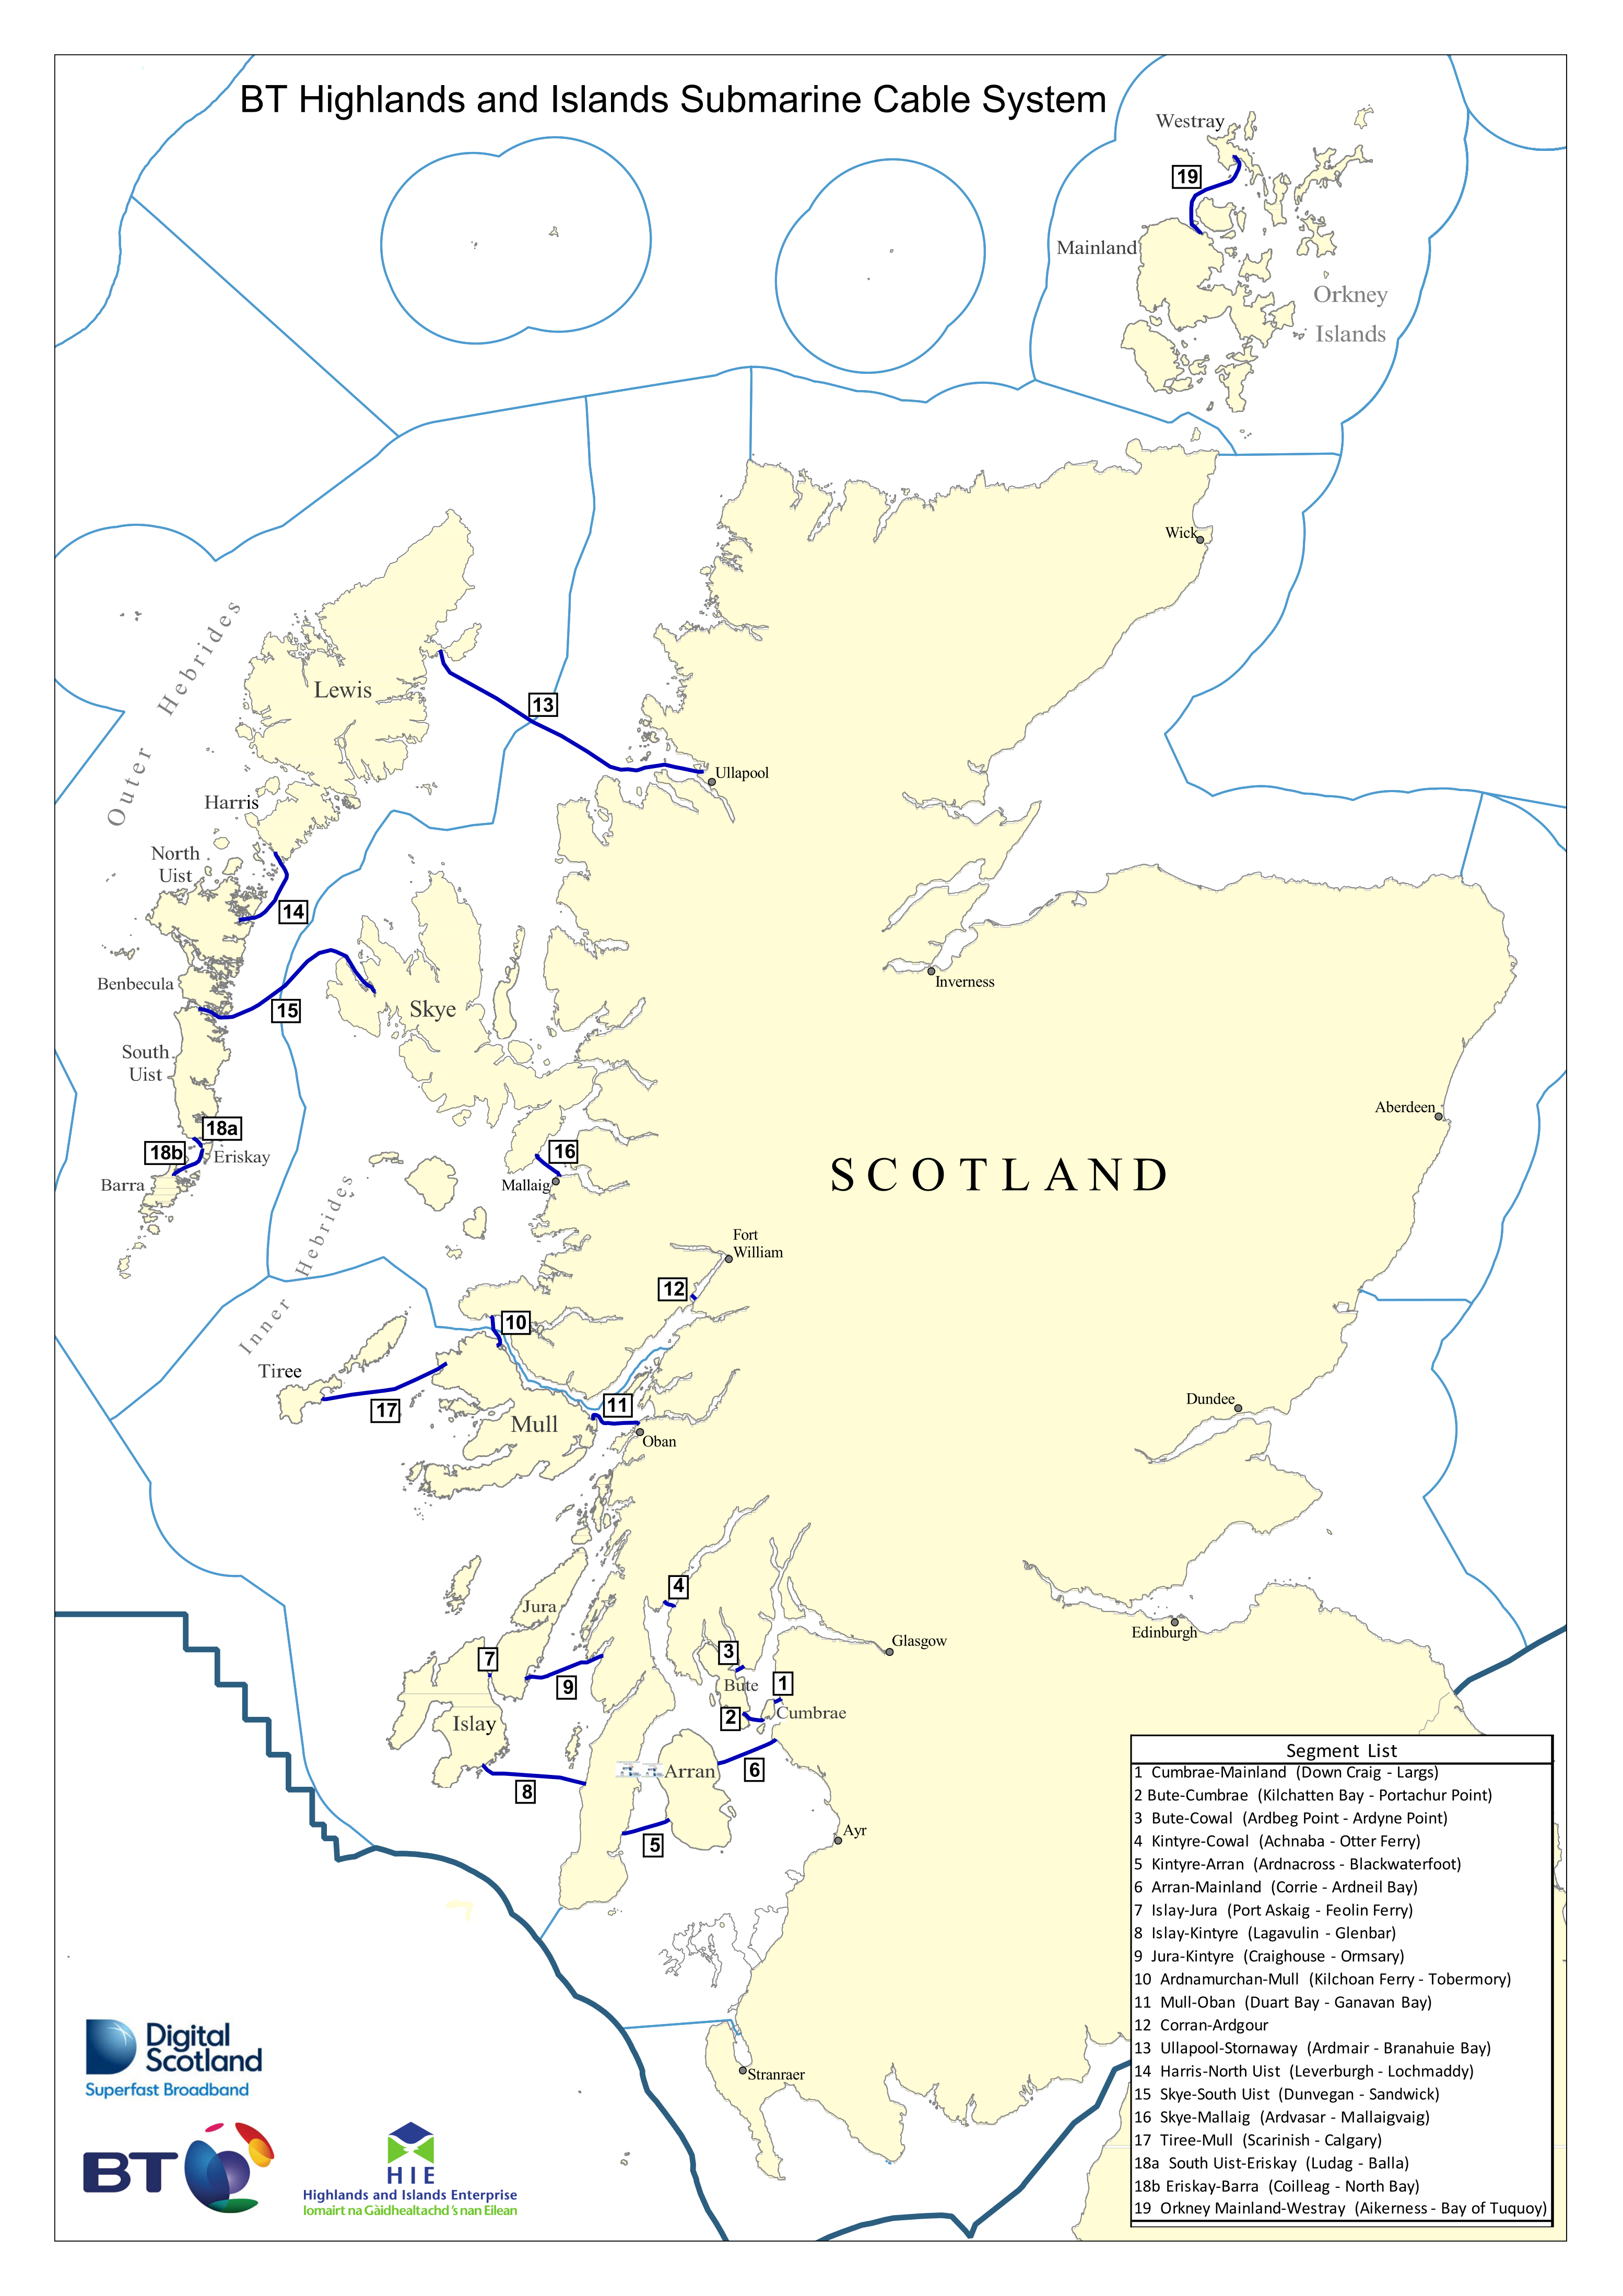
Figure a: Openreach Highlands and Islands subsea cable system installed as part of the DSSB programme. Source: BT Group/ Openreach, DSSB, HIE, 2018 (Yardley et al, 2019).
There are three main types of power cable installed:
Power distribution cables link the Scottish mainland to the islands, except Shetland and Fair isle, and interconnect between islands. They vary in voltage from 11 kV to 33 kV and in diameter from 100 to 200 mm. All power distribution cables are alternating current (AC) cables. Power distribution cables are usually surface laid but are buried or protected where required.
Power transmission cables provide bulk transport of power between areas of power generation and centres of demand. They usually operate above 132 kV and utilise either high voltage alternating current (HVAC) or high voltage direct current (HVDC) technology. The cables vary in diameter and configuration, HVAC cables are between 200 & 400 mm in diameter and are usually installed as a single cable containing 3 conductors and a communications cable. HVDC cables are between 130 and 180 mm in diameter. They are usually laid as bundle comprising 2 power cables, one for each pole, and 1 communications cable. Power Transmission cables are usually buried into the seabed, or protected with rock berms or a cable protection system.
Power export cables provide a connection between offshore generation sites such as wind, wave or tidal energy farms to a landfall site. The connections can utilise a variety of voltages and technologies dependent on the volume of power to be exported. The design and installation of these links is generally similar to Power transmission or distribution cables.
The repair of damage to a power cable usually requires the recovery of the damaged section of the cable to a surface vessel. To undertake a repair the cable is cut on the seabed using a diver or remotely operated vehicle. One cut end is recovered to the deck of a suitable vessel, the damaged section is cut away and a new section of cable jointed in-line with the undamaged cable. The vessel then moves to recover the other cut end, while the newly jointed cable is paid out. The damaged section is cut away and the new section is jointed to the undamaged cable. The repaired cable is then laid down on the sea bed. This type of repair normally requires that the extra cable length is approximately 3 times the depth of water to effect the repair. This loop of cable is laid down on the seabed in an Omega or hairpin configuration and maybe jetted into the seabed or protected using rock.
Subsea power cables create a comprehensive electricity network, connecting Scottish Islands, as well as providing potential for connection to the European Super grid project. The grid project aims to provide energy sharing across the continent through interconnectors, and increasing the potential to use renewable energy or import renewable energy from places such as Iceland or Norway which both have abundant hydro or geothermal renewable energy sources.
There is a growing network of cables bringing offshore marine renewable energy (wind, wave and tidal energy) production to landfall in Scotland.
In July 2019, there were 6,006 km of active cable, 5,030 km for telecommunications and 976 kms for power in Scottish seas. There was a 3% (147 km) increase in the length of active telecomm cables (Table a) and a 103% increase (495 km) in the length of active power cables (Table b) between March 2015 and July 2019 (based on equivalent data sets). A further 114 km of power cable are under construction. Locations of cables under construction, proposed, disused and some historic cable infrastructure (where sections may remain on seabed) are shown in data layers on MS Maps NMPi (each 'cables' on NMPi).
Up to date guidelines and information on submarine cables is available from the European Subsea Cables Association web site. The organisation has compiled guidelines on recommended industry practices and cable protection methods (available on request).
|
Scottish Marine Region
|
2015
|
2019
|
Change 2015 to 2019
|
|
|
km
|
%
|
|||
|
Solway
|
75
|
75
|
0
|
0%
|
|
Clyde
|
285
|
285
|
0
|
0%
|
|
Argyll
|
155
|
157
|
2
|
1%
|
|
West Highlands
|
94
|
94
|
0
|
0%
|
|
Outer Hebrides
|
93
|
93
|
0
|
0%
|
|
North Coast
|
56
|
56
|
0
|
0%
|
|
Orkney Islands
|
158
|
167
|
9
|
6%
|
|
Shetland Isles
|
198
|
198
|
0
|
0%
|
|
Moray Firth
|
36
|
36
|
0
|
0%
|
|
North East
|
29
|
29
|
0
|
0%
|
|
Offshore Marine Region
|
||||
|
Rockall
|
176
|
176
|
0
|
0%
|
|
Bailey
|
796
|
796
|
0
|
0%
|
|
Hatton
|
362
|
362
|
0
|
0%
|
|
North Scotland Shelf
|
626
|
626
|
0
|
0%
|
|
Faroe Shetland Channel
|
693
|
693
|
0
|
0%
|
|
North and West Shetland Shelf
|
257
|
264
|
7
|
3%
|
|
East Shetland Shelf
|
340
|
395
|
55
|
16%
|
|
Fladen and Moray Firth Offshore
|
303
|
303
|
0
|
0%
|
|
Long Forties
|
150
|
224
|
73
|
49%
|
|
Total
|
4,883
|
5,030
|
147
|
3%
|
|
Scottish Marine Region
|
2015
|
2019
|
Change 2015 to 2019
|
|
|
km
|
%
|
|||
|
Solway
|
65
|
68
|
3
|
4%
|
|
Clyde
|
59
|
255
|
196
|
333%
|
|
Argyll
|
86
|
88
|
2
|
3%
|
|
West Highlands
|
48
|
78
|
30
|
63%
|
|
Outer Hebrides
|
35
|
67
|
32
|
93%
|
|
North Coast
|
40
|
40
|
0
|
-1%
|
|
Orkney Islands
|
111
|
123
|
12
|
11%
|
|
Shetland Isles
|
35
|
49
|
14
|
40%
|
|
Moray Firth
|
0
|
64
|
64
|
|
|
North East
|
0
|
66
|
66
|
|
|
Forth and Tay
|
0
|
1
|
1
|
|
|
Offshore Marine Region
|
||||
|
Fladen and Moray Firth Offshore
|
2
|
66
|
64
|
3,200%
|
|
Long Forties
|
0
|
11
|
11
|
|
|
Total
|
481
|
976
|
495
|
103%
|
Contribution to the economy
Subsea cables facilitate other benefits through the deployment of telecoms infrastructure. It is therefore difficult to isolate the direct use value of the cables from the industries they support. In 2019 (Yardley et al, 2019) published an independent report on benefits likely to be realised as a result of the Digital Scotland Superfast Broadband programme (DSSB) deployment, showing every public pound invested in fibre broadband in Scotland is delivering almost £12 (£11.60) of benefits to the Scottish economy.
An Economic and Social Evaluation of the UK Subsea Cables Industry (Elliot et al., 2016), compiled by the University of Huddersfield, states “a preliminary estimate of the economic value of the UK telecommunications subsea cables industry to the digital economy values it at £62.8 billion per annum. The impact of the UK electricity subsea cables industry is smaller but still significant at £2.8 billion per annum.”
More generally, the economic and social benefits of the internet underpin the Scottish Government's Digital Strategy. Employment in the Scottish digital sector was 64,100 in 2015 and produced exports in Scotland of £4.24 billion (Scottish Government, 2017), though again it is difficult to determine how much of this can be directly attributed to submarine cables.
It is not possible to quantify the economic contribution of subsea cables directly, as no separate information on GVA or employment are available. GVA (Gross Value Added) is the value of goods and services produced minus the cost of raw materials and other inputs used to produce them. However, the length of active telecommunications cables increased by 3% and the length of active power cables increase by 103% between 2015 and 2019. This may indicate an increasing contribution to the Scottish economy but this has not been quantified. The large increase in the length of active power cables is due to the growing network of cables bringing offshore marine renewable energy (wind, wave and tidal energy) production to landfall in Scotland.
Examples of socio-economic effects
- Internet provision.
- Business and social communication (domestic and international).
- Employment and research.
- Possible restrictions other seabed uses.
Pressures on the environment
An OSPAR agreed list of marine pressures is used to help assessments of human activities in the marine environment. The marine pressure list has been adapted for use in Scotland via work on the Feature Activity Sensitivity Tool (FeAST). Subsea cable activities can be associated with 19 marine pressures – please read the pressure descriptions and benchmarks for further detail.
The list of marine pressures is used to help standardise assessments of activities on the marine environment, and is adapted from an agreed list prepared by OSPAR Intercessional Correspondence Group on Cumulative Effects (ICG-C) (see OSPAR 2014-02 ‘OSPAR Joint Assessment and Monitoring Programme (JAMP) 2014-2021’ Update 2018’ (Table II).
The Feature Activity Sensitivity Tool (FeAST) uses the marine pressure list to allow users to investigate the sensitivity of Scottish marine features. It also associates all pressures that might be exerted by a defined list of activities at a particular benchmark. The extent and impact of each pressure from a given activity will vary according to its intensity or frequency. The extent and impact of the pressure will also vary depending on the sensitivity of the habitat or species on which it is acting. The existence of multiple activities, and potentially multiple pressures, at specific locations will result in a cumulative impact on the environment.
FeAST is a developing tool. A snap shot from 2019 was used for the development of SMA2020. Please consult the FeAST webpage for further information and up to date information.
The list of pressures below associated with this activity is given in alphabetical order. Clicking the pressure will give you more information on the pressure and examples of how it may be associated with the activity.
Forward look
In today's digital world the importance of the communications sector and its contribution to the economy is widely recognised. European Subsea Cables Association (ESCA) data estimate that >99% of international trans-ocean internet and communications traffic is carried by cable. Submarine cables will be vital for the foreseeable future. The extent to which any new cables will be laid in Scottish waters is not known. The number of additional submarine cables will depend on a variety of factors such as the destination countries and the most suitable starting point for such a cable.
The installation of new power cables depends on a number of factors including: the role of possible interconnectors between countries to share power and the need to bring ashore electricity generated by new offshore wind, wave or tidal farms. Overall need will be influenced by the intention to improve security and stability in electricity supply as well as possible increasing demand to meet decarbonisation targets.
Possible power transmission improvements include:
- Western Isles to mainland Scotland HVDC Link
- Shetland to Caithness HVDC link
- Orkney to Caithness HVAC link
- Eastern HVDC link
- new 1,400 MW interconnector between Norway and Peterhead (NorthConnect), due to be completed 2023.
Economic trend assessment
There are no trend data on the contribution of subsea cables to the Scottish economy. The increase in the length of subsea cables between 2015 and 2019 may indicate an increasing contribution to the Scottish economy but this has not been quantified.
This Legend block contains the key for the status and trend assessment, the confidence assessment and the assessment regions (SMRs and OMRs or other regions used). More information on the various regions used in SMA2020 is available on the Assessment processes and methods page.
Status and trend assessment
|
Status assessment
(for Clean and safe, Healthy and biologically diverse assessments)
|
Trend assessment
(for Clean and safe, Healthy and biologically diverse and Productive assessments)
|
||
|---|---|---|---|
 |
Many concerns |
No / little change |
|
 |
Some concerns |
Increasing |
|
 |
Few or no concerns |
Decreasing |
|
 |
Few or no concerns, but some local concerns |
No trend discernible |
|
 |
Few or no concerns, but many local concerns |
All trends | |
 |
Some concerns, but many local concerns |
||
 |
Lack of evidence / robust assessment criteria |
||
| Lack of regional evidence / robust assessment criteria, but no or few concerns for some local areas | |||
 |
Lack of regional evidence / robust assessment criteria, but some concerns for some local areas | ||
| Lack of regional evidence / robust assessment criteria, but many concerns for some local areas | |||
Confidence assessment
|
Symbol |
Confidence rating |
|---|---|
|
Low |
|
|
Medium |
|
|
High |

Assessment regions
 and the Scottish Offshore Marine Regions (OMRs, O1 – O10)")
Key: S1, Forth and Tay; S2, North East; S3, Moray Firth; S4 Orkney Islands, S5, Shetland Isles; S6, North Coast; S7, West Highlands; S8, Outer Hebrides; S9, Argyll; S10, Clyde; S11, Solway; O1, Long Forties, O2, Fladen and Moray Firth Offshore; O3, East Shetland Shelf; O4, North and West Shetland Shelf; O5, Faroe-Shetland Channel; O6, North Scotland Shelf; O7, Hebrides Shelf; O8, Bailey; O9, Rockall; O10, Hatton.
 Regions. These have been used as the assessment areas for hazardous substances.")
, Regions.")