
What, why and where?
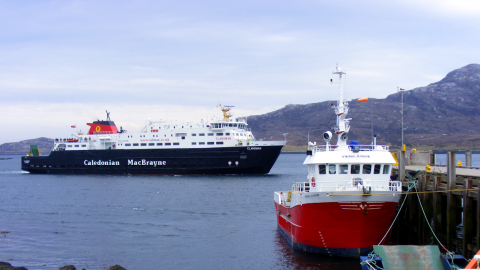
Ferries are an essential part of Scotland's transport network (Figure 1) whose services cover both island and mainland communities. This section covers the movement of people (passengers, cars and commercial vehicles) on ferries and cruise ships and the associated infrastructure.
Ferry passenger numbers increased by 6% from 9.7 to 10.3 million between 2014 and 2018. The number of vehicles that ferries carried, which includes cars, commercial vehicles and busses, increased by 12% from 3.0 to 3.5 million in the same period.
The number of cruise ships calling into Scottish ports has risen from 446 in 2012 to 825 in 2018.
Transport Scotland is responsible for legislation, policy and guidance relating to Scotland's ferries, looking after services, ports, harbours and canals across the country. They are also responsible for some of the lifeline ferries and ports, including ferry networks connecting the islands and mainland communities. A lifeline ferry is a ferry that is required in order for a community to be viable.

. Note: Passenger numbers from Corran Ferry route are excluded as these numbers are estimated.")
Ferries
There are several types of ferry operating in and around Scotland, these include: lifeline services by Caledonian McBrayne (CalMac) and North Link and private services such as those to Northern Ireland. The Rosyth to Zeebrugge ferry route was the only one between Scotland and Europe until 2018, when it ceased operating.
Scottish Transport Statistics are presented by Transport Scotland for each Scottish Marine Region (SMR). Figure a and Table a show that the routes across all the SMRs are relatively stable in terms of passenger numbers. The exceptions are in the Forth and Tay Region where the passenger and car numbers on the Rosyth – Zeebrugge route fell to zero between 2010 and 2011. Also there was an increase in West Highland from 2013 with the inclusion of the Corran Ferry route between 2012 and 2013. No ferry routes start or terminate at ports in the Moray Firth SMR.
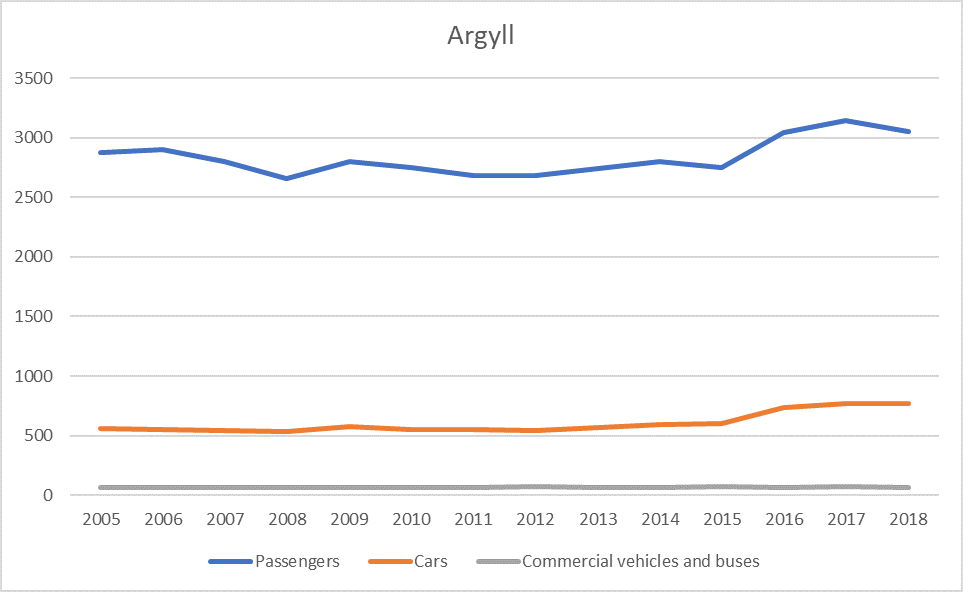
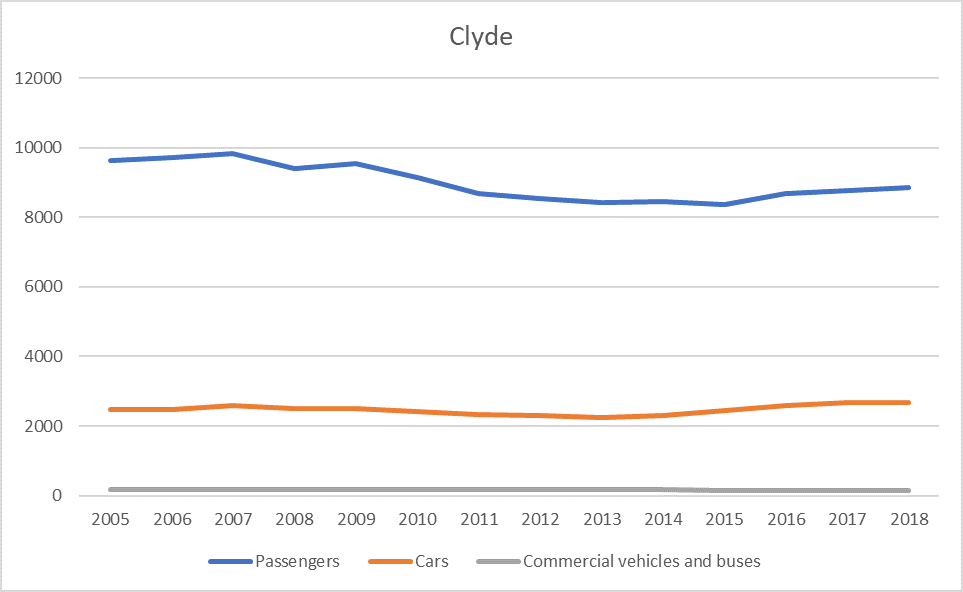
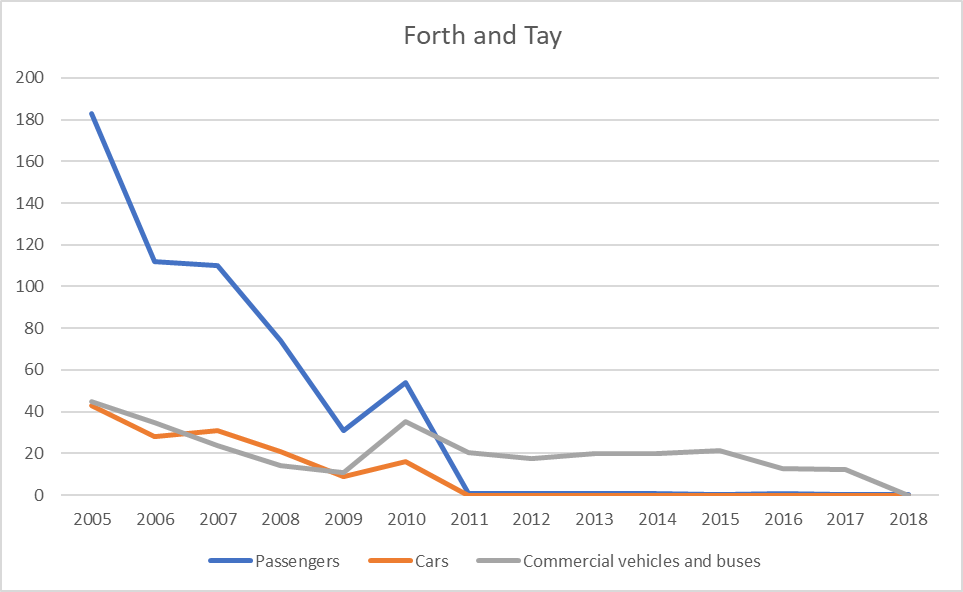
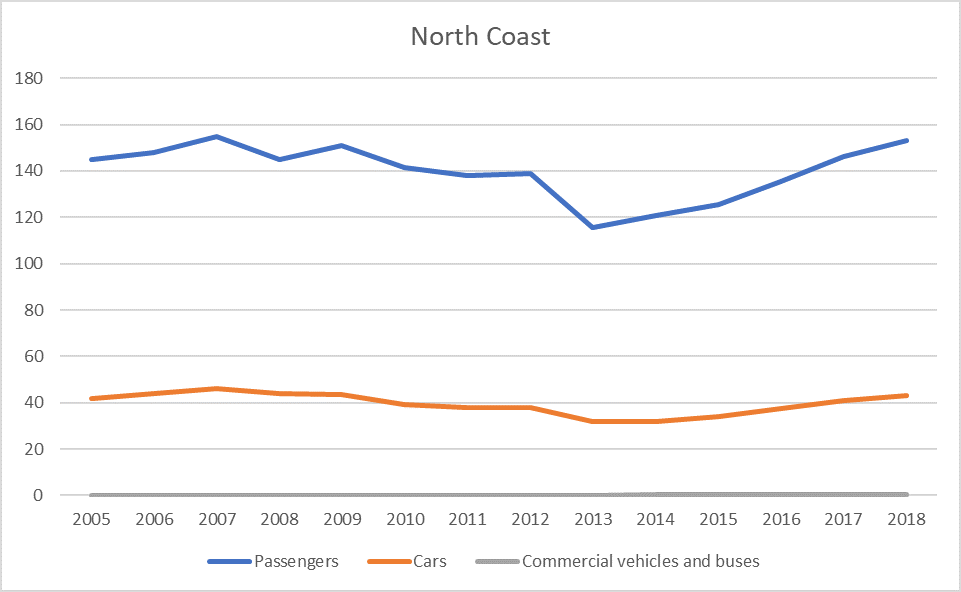

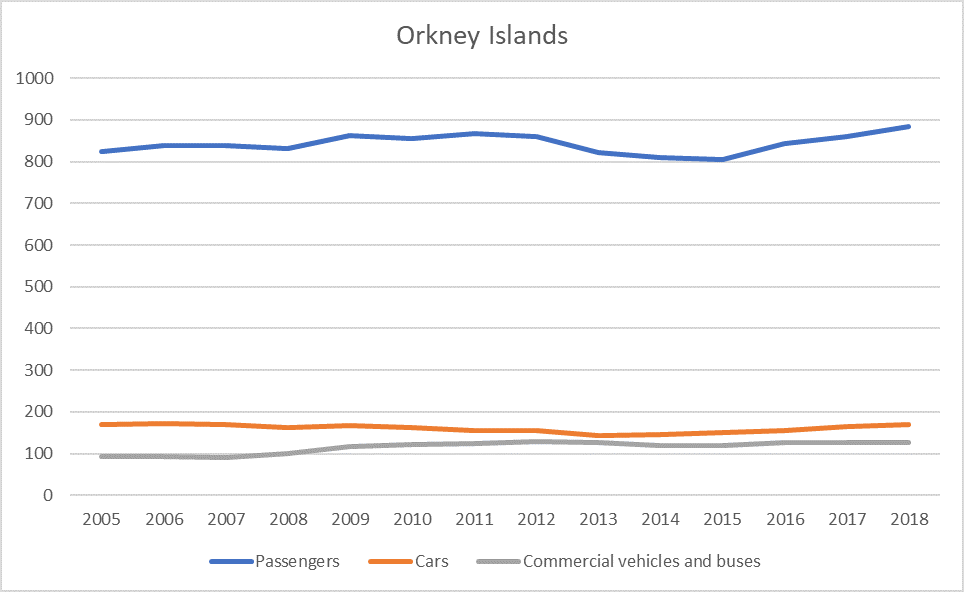
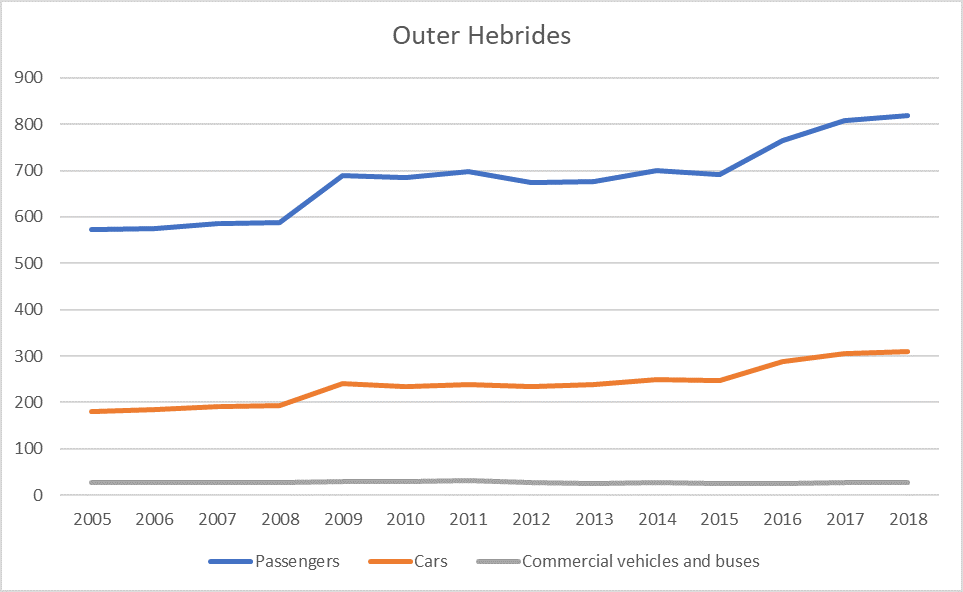
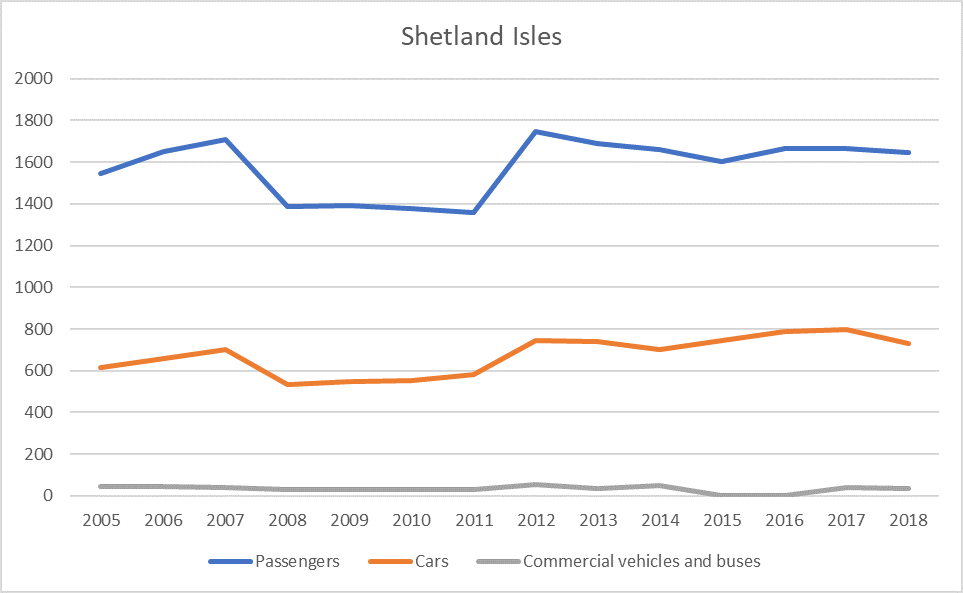
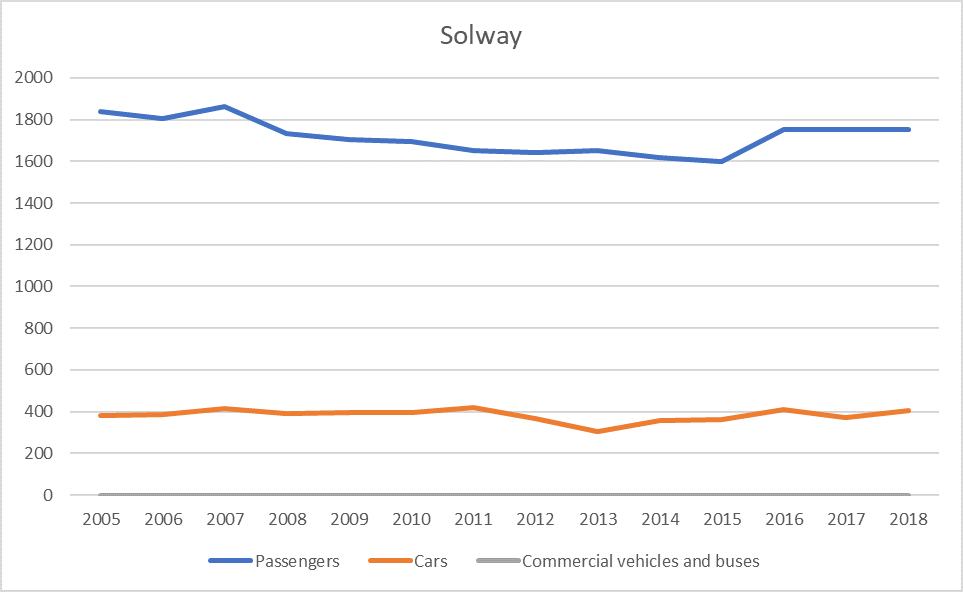
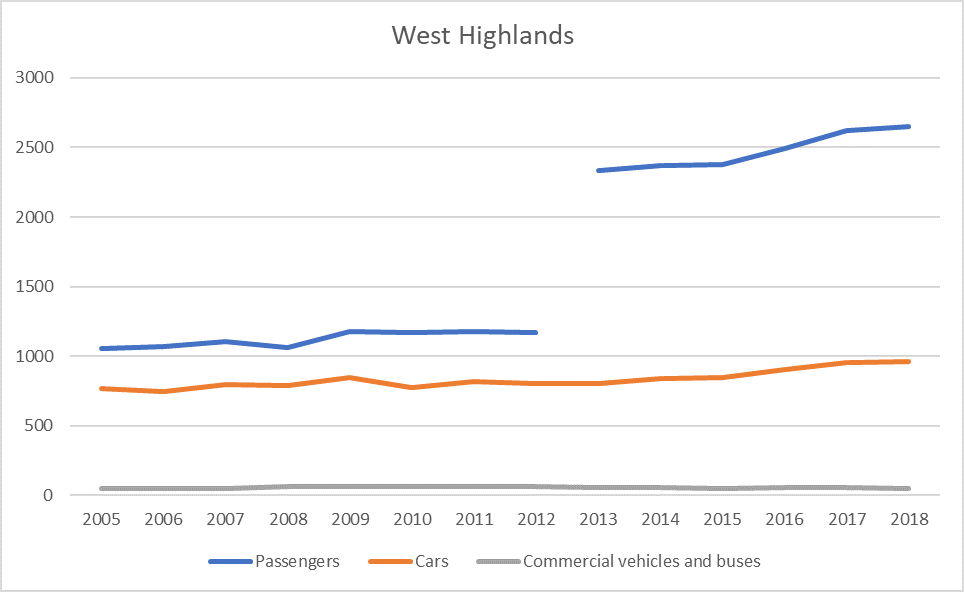
Figure a: Ferry route traffic (passengers, cars and commercial vehicles and buses, Y axis = '000s.) per Scottish Marine Region 2009 - 2018.
Source: Scottish Transport Statistics. Note: The graphs show all traffic within an SMR even where a route starts in one SMR and finishes in another. Totals from these graphs should therefore not be added together as there will be double counting. The passenger numbers for West Highlands include estimated passenger numbers for the Corran Ferry from 2013 onwards.
|
|
Passenger numbers (‘000s)
|
Change in passenger numbers
2014 to 2018
|
|
|
Scottish Marine Region
|
2018
|
Change (thousands)
|
% change
|
|
Solway
|
1,750
|
134
|
8%
|
|
Clyde
|
8,865
|
403
|
5%
|
|
Argyll
|
3,053
|
252
|
9%
|
|
West Highlands
|
2,652
|
279
|
12%
|
|
Outer Hebrides
|
818
|
118
|
17%
|
|
North Coast
|
153
|
33
|
27%
|
|
Orkney Islands
|
885
|
75
|
9%
|
|
Shetland Isles
|
1,662
|
4
|
0%
|
|
Moray Firth
|
0
|
0
|
|
|
North East
|
150
|
-1
|
-1%
|
|
Forth and Tay
|
0
|
-1
|
-93%
|
|
All Scotland
|
10,279
|
600
|
6%
|
Note: For each SMR the table shows all traffic within it even where a route starts in one SMR and finishes in another. Therefore SMR numbers should not be added together as there will be double counting. The passenger numbers for West Highlands include estimated passenger numbers for the Corran Ferry from 2013 onwards. The Scotland number does not include this double counting and excludes Corran Ferry passengers.
In 2018, Clyde had 44% of passenger transport, with Argyll next busiest (15%) and then the West Highlands (13%). Clyde also had 44% of car transport, with West Highlands the next busiest (16%). Clyde and Orkney Island had about the same commercial vehicles and bus transport (30% and 27% respectively).
In 2018, the busiest ferry route within Scotland in terms of passengers and vehicles carried is the service between Gourock and Dunoon, which carried 1,372,700 passengers. There were 634,300 cars carried on this route and 36,300 commercial vehicles and buses in 2018.
The second busiest Scottish ferry route over recent years in terms of passenger numbers has been the Cairnryan / Belfast route. This route carried 1.2 million passengers in 2018. Cairnryan/Loch Ryan is Scotland’s main port for carrying goods and passengers to Northern Ireland.
The second busiest route within Scotland in terms of cars carried is the Corran Ferry from Ardgour to Nether Lochaber operated by Highland Council. This route carried 261 thousand vehicles in 2018.
In 2011 the Rosyth ferry from the Forth and Tay region stopped carrying passengers, which explains the sudden drop in the chart. From 2013 the statistics included the Corran Ferry route for the West Highlands region for the first time.
Scottish Ministers carry out strategic planning, for example, the Scottish Ferry Services Ferries Plan (2013 - 2022) (Transport Scotland, 2012) sets out strategic guidance for ferry services in Scotland from 2013 to 2022. The Ferries Plan made recommendations regarding:
- where investment should be focussed to make improved connections for island and remote rural communities;
- improving reliability and journey times;
- seeking to maximise the opportunities for employment, business, leisure and tourism;
- promoting social inclusion.
The following are examples of improvements completed since 2013:
- two vessels for Arran all summer (May-September) resulting in more of sailings;
- new two year summer only (May-September) pilot ferry service between Campbeltown and Ayrshire, via Arran - 3 days per week;
- improved winter service between Oban and Coll and Tiree; and between Oban and Barra/South Uist;
- improved service to the Small Isles;
- additional later evening sailing to Cumbrae;
- extend the operating day on the Colintraive-Rhubodach service until 9 pm all year round; and
- introduce a temporary summer service on a Saturday from Colonsay, via Islay, to Kennacraig.
Additionally, the need to improve ship efficiency and create cleaner solutions has been recognised. For example, recent additions to CalMac’s fleet include 3 diesel-electric hybrid ferries, using a combination of battery and conventional diesel power. These vessels have doubled the capacity of other vessels in their class, use up to 38% less fuel and produce 7,000 tonnes less CO2 than the vessels they replaced.
Brodick harbour redevelopment
In April 2018 the new Brodick Ferry Terminal opened following a £30.7 million infrastructure upgrade project, which has transformed the harbour area.

The project has created a flagship harbour for the Isle of Arran, a popular visitor destination, and provides facilities that will support the local economy and the island tourist industry.
Work to transform the harbour began in January 2016 and has delivered a 110 m, two-berth pier. It is designed to accommodate the new dual-fuel vessel, MV Glen Sannox, when it enters service, with a dedicated berth for PS Waverley that can accommodate other commercial vessels, including cruise ships. The two-storey terminal building houses the ticket office, toilets, harbour staff offices and a 120-seat departure lounge. Outside, there is an increased marshalling area featuring six lanes, offering parking for heavy goods vehicles and service vehicles; six bus stances with two modern shelters; and parking for up to 65 cars.
The new terminal building has photovoltaic roof tiles to generate electricity for the building, a biomass heating system fuelled by locally sourced wood chips, a natural air ventilation system, on-site segregated bicycle routes and storage, and electric vehicle charging points in the parking area. In addition, the majority of dredged and excavated material was re-used in the project as fill for the marshalling area, and excess material was donated to the Brodick Improvement Committee to use in the recovery of Brodick Beach.
Cruise ship port calls
Key ports for visiting cruise liners include: Kirkwall; Invergordon; Lerwick; Greenock; Leith; Rosyth; Queensferry; and Oban (Scottish Government, 2015). Many of these calls are transit calls, where the cruise ships uses the port, with passengers disembarking and embarking, but the port call is one of the stops on a voyage, not the start or end port. Turnaround Calls are those where cruise ships use the port as the start and/or end port of a voyage. The Orkney Islands is the most popular cruise ship destination in the UK, with over 140 cruise ships calling into Kirkwall and Stromness annually (Table b). Destinations include Iceland, Norway, Denmark and Germany as well as tours around Scotland’s Highlands and Islands.
|
Scottish Marine Region
|
2012
|
2013
|
2014
|
2015
|
2016
|
2017
|
2018
|
|
Clyde
|
46
|
52
|
54
|
59
|
65
|
65
|
67
|
|
Argyll
|
41
|
51
|
44
|
74
|
121
|
115
|
101
|
|
West Highlands
|
39
|
46
|
47
|
45
|
48
|
68
|
108
|
|
Outer Hebrides
|
27
|
23
|
37
|
43
|
60
|
43
|
41
|
|
North Coast
|
10
|
8
|
8
|
6
|
11
|
11
|
14
|
|
Orkney Islands
|
77
|
75
|
79
|
87
|
116
|
143
|
150
|
|
Shetland Isles
|
52
|
39
|
49
|
41
|
79
|
71
|
91
|
|
Moray Firth
|
67
|
64
|
55
|
56
|
63
|
93
|
97
|
|
North East
|
11
|
15
|
8
|
13
|
24
|
30
|
28
|
|
Forth and Tay
|
76
|
81
|
76
|
77
|
89
|
123
|
128
|
|
Total
|
446
|
454
|
457
|
501
|
676
|
762
|
825
|
Facilities for cruise ships have been improving, for example:
- in 2013 Scrabster Harbour built a new pier, the £17 million Jubilee Quay development. It was not specifically built for cruise ships, but the development allowed them to relocate other operations away from their main cruise ship berth to accommodate more cruise vessels.
- in 2016 Scrabster built new tender pontoons to facilitate passengers coming ashore.
- as part of the development of Inverness marina, passenger pontoons were incorporated that have been specifically used to land cruise ship passengers who are being tendered ashore.
- since 2017 there is a new deep water quay at Mair’s Pier for cruise ships at Lerwick.
. © Orkney Harbours.")
Contribution to the economy
According to Scotland’s Marine Economic Statistics (Scottish Government, 2019) marine transport sectors contributed the following Gross Value Added (GVA) and employment to the Scottish economy.
In 2017, passenger water transport generated £90 million in GVA and employment for 1,100 people (headcount). From 2013 to 2017, the GVA from passenger water transport (adjusted to 2017 prices) decreased by 8% to £90 million. The longer term trend, from 2008 to 2017, showed passenger water transport GVA fluctuating from year to year, with a low of 51 million in 2011, a high of 131 million in 2014 and the 2017 value 8% lower than the 2008 value.
Employment in 2017 fell to 1,100, its lowest in the series, from a high of 1,800 in 2014. From 2008 to 2017, employment fell by 27%.
. Source: Scotland’s Marine Economic Statistics (Scottish Government, 2019).")
The source data underpinning the estimate of the economic contribution of Sea and coastal passenger water transport includes:
- transport of passengers overseas and coastal waters, whether scheduled or not;
- operation of excursion, cruise or sightseeing boats;
- operation of ferries, water taxis etc.; and
- renting of pleasure boats with crew for sea and coastal water transport (e.g. for fishing cruises).
Examples of socio-economic effects
- Sea transport remains environmentally efficient.
- Sector is a significant economic contributor providing added value, employment, skills and training.
- Ferries enable the movement of people, goods and services to and from island and remote communities improving their connectivity.
- Many ports are close to expanding residential areas which can limit their development.
Pressures on the environment
An OSPAR agreed list of marine pressures is used to help assessments of human activities in the marine environment. The marine pressure list has been adapted for use in Scotland via work on the Feature Activity Sensitivity Tool (FeAST). Maritime transport (passengers, ferries & cruise ships) activities can be associated with 27 marine pressures – please read the pressure descriptions and benchmarks for further detail.
The list of marine pressures is used to help standardise assessments of activities on the marine environment, and is adapted from an agreed list prepared by OSPAR Intercessional Correspondence Group on Cumulative Effects (ICG-C) (see OSPAR 2014-02 ‘OSPAR Joint Assessment and Monitoring Programme (JAMP) 2014-2021’ Update 2018’ (Table II).
The Feature Activity Sensitivity Tool (FeAST) uses the marine pressure list to allow users to investigate the sensitivity of Scottish marine features. It also associates all pressures that might be exerted by a defined list of activities at a particular benchmark. The extent and impact of each pressure from a given activity will vary according to its intensity or frequency. The extent and impact of the pressure will also vary depending on the sensitivity of the habitat or species on which it is acting. The existence of multiple activities, and potentially multiple pressures, at specific locations will result in a cumulative impact on the environment.
FeAST is a developing tool. A snap shot from 2019 was used for the development of SMA2020. Please consult the FeAST webpage for further information and up to date information.
The list of pressures below associated with this activity is given in alphabetical order. Clicking the pressure will give you more information on the pressure and examples of how it may be associated with the activity.
Forward look
The ‘Vessel Replacement and Deployment Plan 2016’ (VRDP) (Transport Scotland, 2018) outlines the future make-up of the ferry fleet serving the Clyde and Hebrides ferry service network. The overview includes how existing, planned and prospective vessels could be deployed across the Clyde and Hebrides ferry service network to deliver the Government’s Ferries Plan commitments and better meet forecast demand. The VRDP informs new vessel and harbour investments.
Ports are identifying the need for new development to support the growing number of cruise ships visiting Scotland. For example, Stornoway is in the process of developing a new multifunctional deep water berth which will accommodate the largest cruise vessels as well as general cargo, renewables industry, oil and gas and ferry infrastructure. It is scheduled to open in 2021.
At Greenock there is new pontoon under construction to accommodate cruise vessels, due to be open for the 2020 cruise season. An application is being made for a new cruise terminal with completion planned for the 2021 season.
Scrabster Harbour is currently developing plans for a new £18 million 250 m cruise berth for completion in 2021.
Inverness plans expansion of the port infrastructure that could accommodate specific requirements for cruise ships.
Lerwick Port Authority has plans for dredging at North Ness channel and Mair’s Pier to accommodate cruise ships over 240 metres as well as a long range capital project (in planning) for a town centre deep water berth, capable of accommodating large cruise ships.

Economic trend assessment
Trends for Scotland are based on ferry passenger numbers within Scotland and between Scotland and Northern Ireland or other EU countries (2014-2018). They do not include double counting.
Trends for Scottish Marine Regions are based on ferry passenger numbers (2014-2018). They include double counting as all journeys within an SMR are included even where a route starts in one SMR and finishes in another.
Confidence is 2 stars ** (medium). Based on published statistics supplied by ferry companies with some quality issues.
|
SMR |
Trend with confidence |
|
Argyll |
|
|
Clyde |
|
|
Forth and Tay |
|
|
Moray Firth |
|
|
North Coast |
|
|
North East |
|
|
Orkney Islands |
|
|
Outer Hebrides |
|
|
Shetland Isles |
|
|
Solway |
|
|
West Highlands |
|
|
Scotland |
|
This Legend block contains the key for the status and trend assessment, the confidence assessment and the assessment regions (SMRs and OMRs or other regions used). More information on the various regions used in SMA2020 is available on the Assessment processes and methods page.
Status and trend assessment
|
Status assessment
(for Clean and safe, Healthy and biologically diverse assessments)
|
Trend assessment
(for Clean and safe, Healthy and biologically diverse and Productive assessments)
|
||
|---|---|---|---|
 |
Many concerns |
No / little change |
|
 |
Some concerns |
Increasing |
|
 |
Few or no concerns |
Decreasing |
|
 |
Few or no concerns, but some local concerns |
No trend discernible |
|
 |
Few or no concerns, but many local concerns |
All trends | |
 |
Some concerns, but many local concerns |
||
 |
Lack of evidence / robust assessment criteria |
||
| Lack of regional evidence / robust assessment criteria, but no or few concerns for some local areas | |||
 |
Lack of regional evidence / robust assessment criteria, but some concerns for some local areas | ||
| Lack of regional evidence / robust assessment criteria, but many concerns for some local areas | |||
Confidence assessment
|
Symbol |
Confidence rating |
|---|---|
|
Low |
|
|
Medium |
|
|
High |

Assessment regions
 and the Scottish Offshore Marine Regions (OMRs, O1 – O10)")
Key: S1, Forth and Tay; S2, North East; S3, Moray Firth; S4 Orkney Islands, S5, Shetland Isles; S6, North Coast; S7, West Highlands; S8, Outer Hebrides; S9, Argyll; S10, Clyde; S11, Solway; O1, Long Forties, O2, Fladen and Moray Firth Offshore; O3, East Shetland Shelf; O4, North and West Shetland Shelf; O5, Faroe-Shetland Channel; O6, North Scotland Shelf; O7, Hebrides Shelf; O8, Bailey; O9, Rockall; O10, Hatton.
 Regions. These have been used as the assessment areas for hazardous substances.")
, Regions.")