

What, why and where?
Most defence use of the coast and sea is by the Royal Navy (RN) (submarine base, jetties and exercise areas). In addition coastal locations for the Army (training camp and firing ranges), Royal Air Force (bases, coastal Air Weapon Ranges and Danger Areas) and Defence Test and Evaluation Ranges (used to trial weapon systems) are also important. Detailed information about the intensity of defence use of the seas is not available for reasons of national security. However, the firing ranges, for example, are not in constant use but vary depending on operational requirements. Areas where defence activity takes place are shown in Figure 1.
The Royal Navy’s primary bases/establishments in Scotland are Her Majesty's Naval Base Clyde (HMNB Clyde) (Figure 2), Royal Marine (RM) Condor (Arbroath) and HMS Caledonia (Rosyth). There are other Reserve Forces and University units and also test and evaluation facilities at the Inner Sound Raasay, Loch Goil and Loch Fyne.
By far the largest site is HMNB Clyde, which includes the port of Faslane and the Royal Navy Armament Depot at Coulport. It is home to the UK’s strategic nuclear deterrent and attack submarines, Mine Countermeasures Vessels and Patrol Boats. By 2020 it is due to become home to all the UK’s submarines. The Royal Marines’ 43 Commando (Fleet Protection Group) and Northern Diving Group are also based at Faslane. NATO (The North Atlantic Treaty Organization) is an intergovernmental military alliance between 30 North American and European countries.
Scotland also hosts Joint Warrior, the UK-led multinational war exercise that takes place in spring and autumn each year. It involves warships, aircraft, marines and troops from UK, NATO and allied forces.
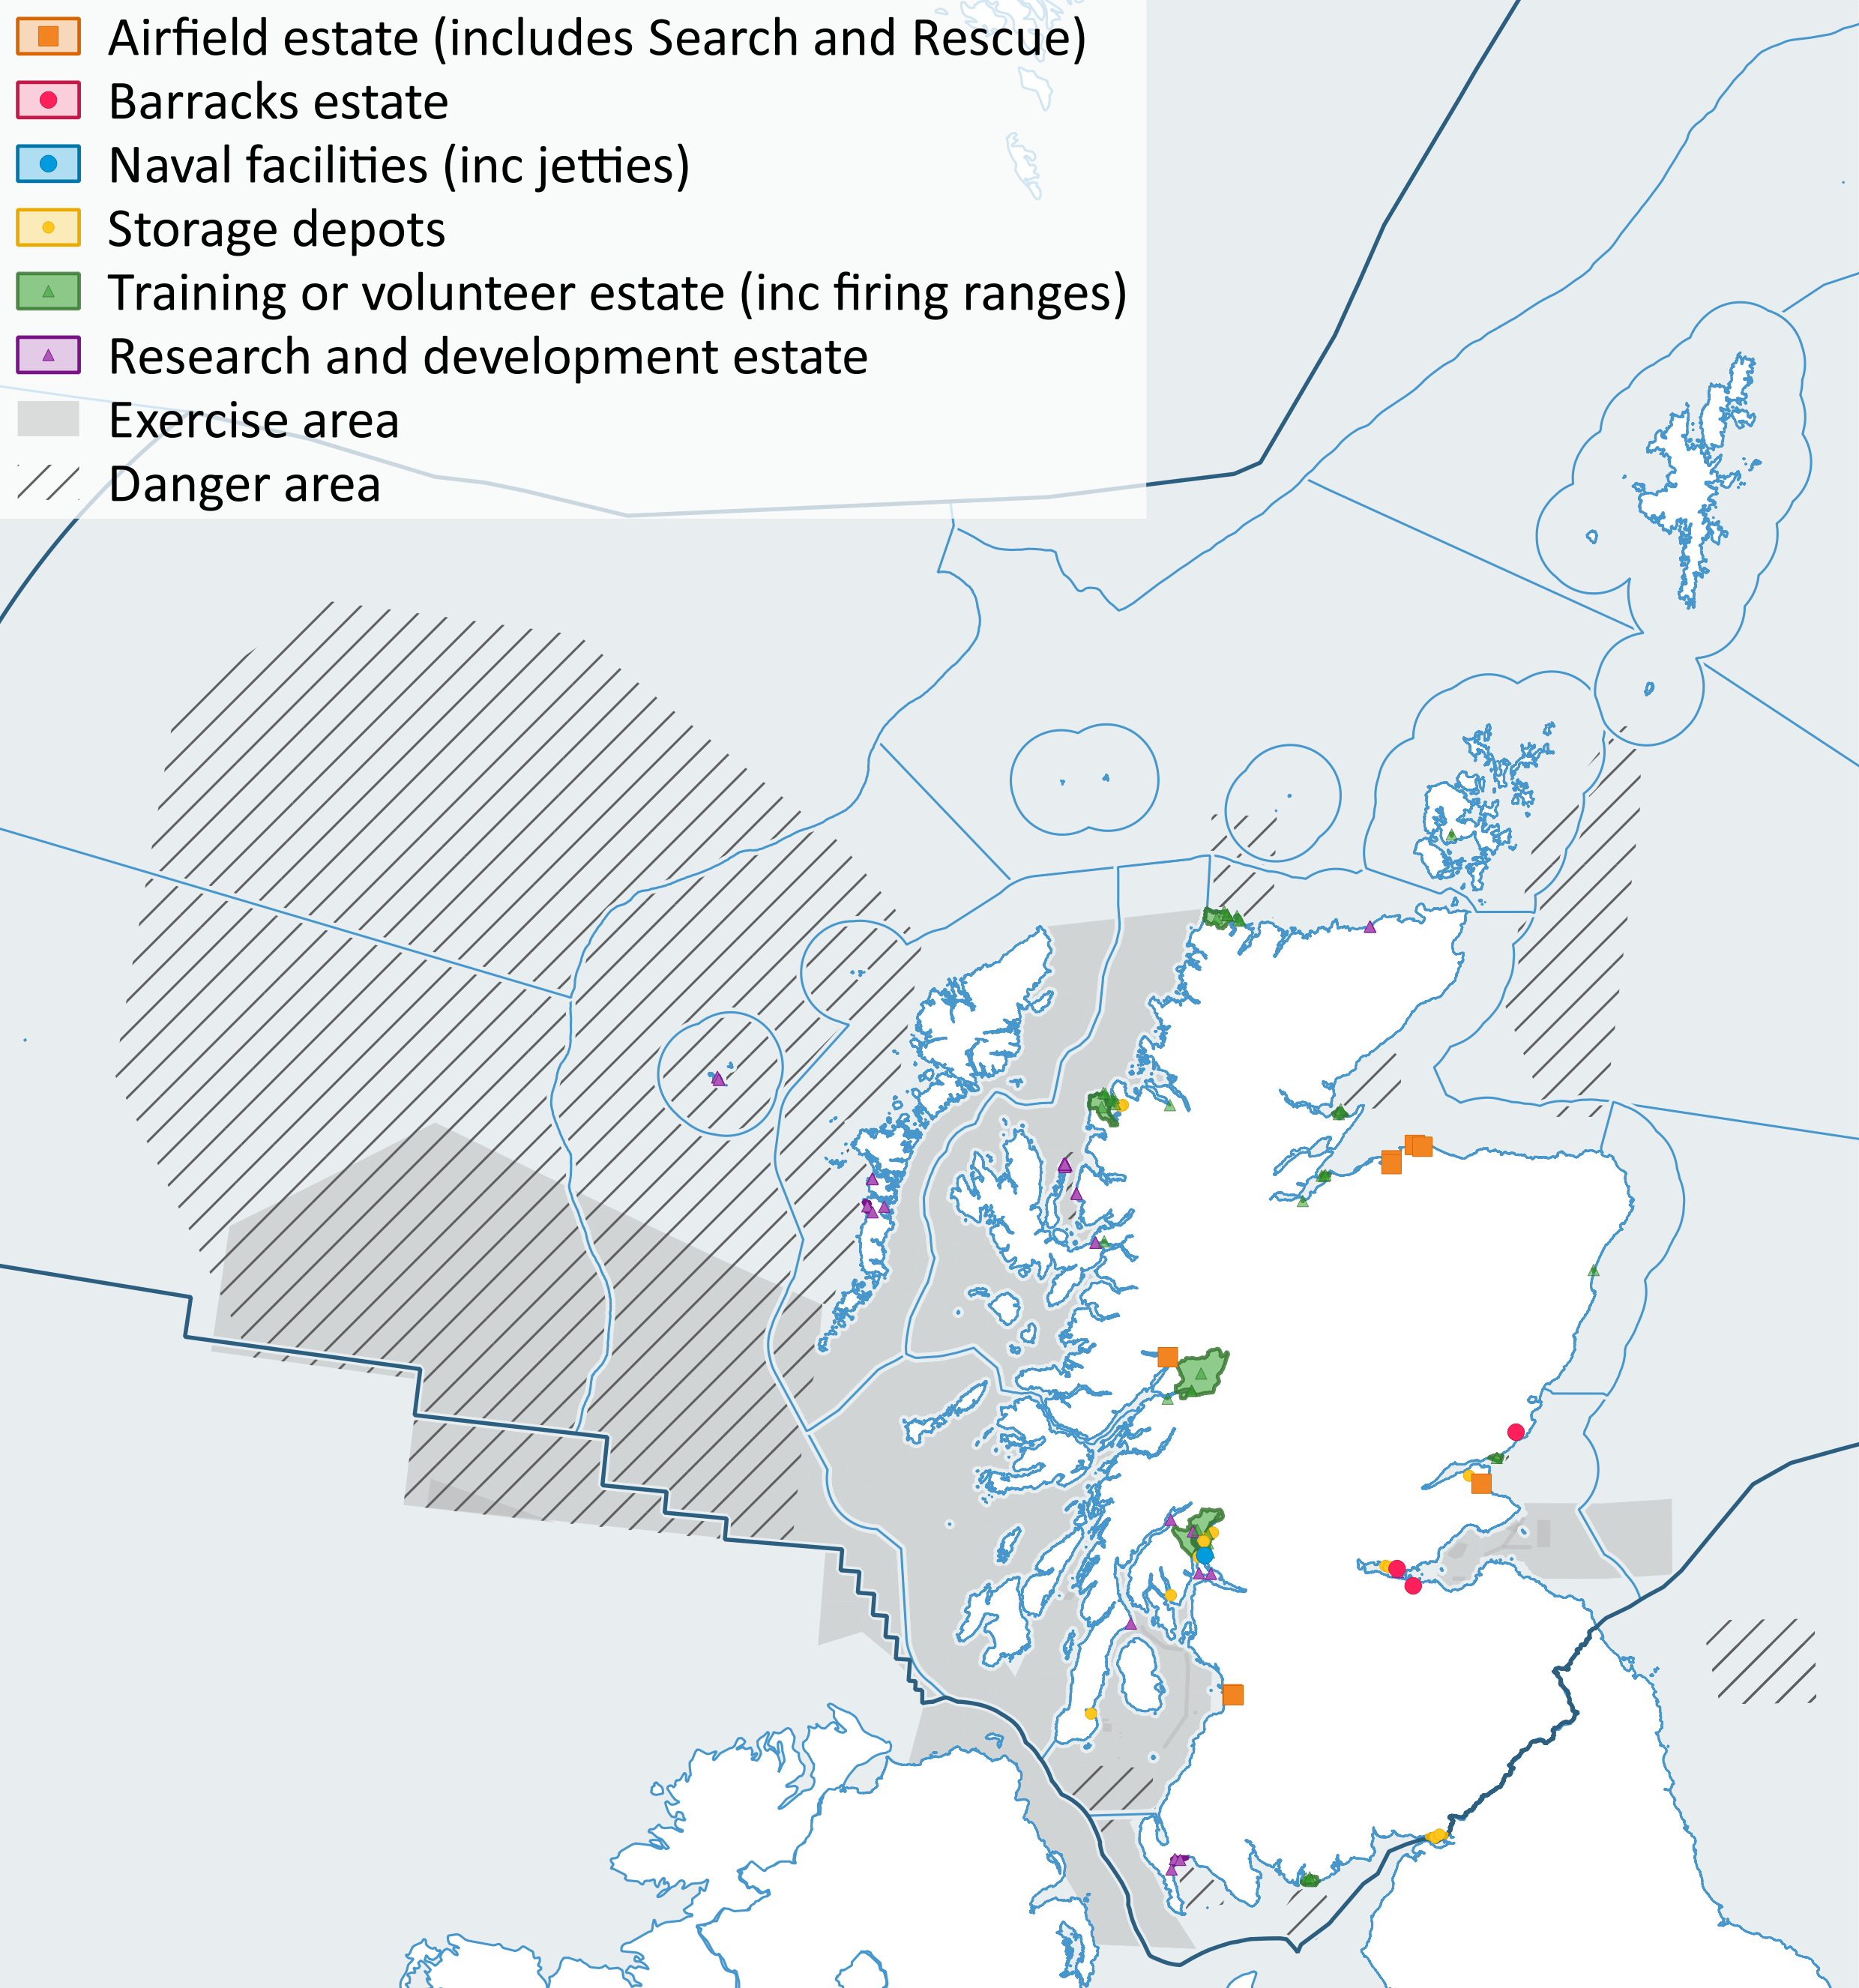
Figure 1: Military activity areas around Scotland’s coast with Scottish Marine Regions and Offshore Marine Regions.
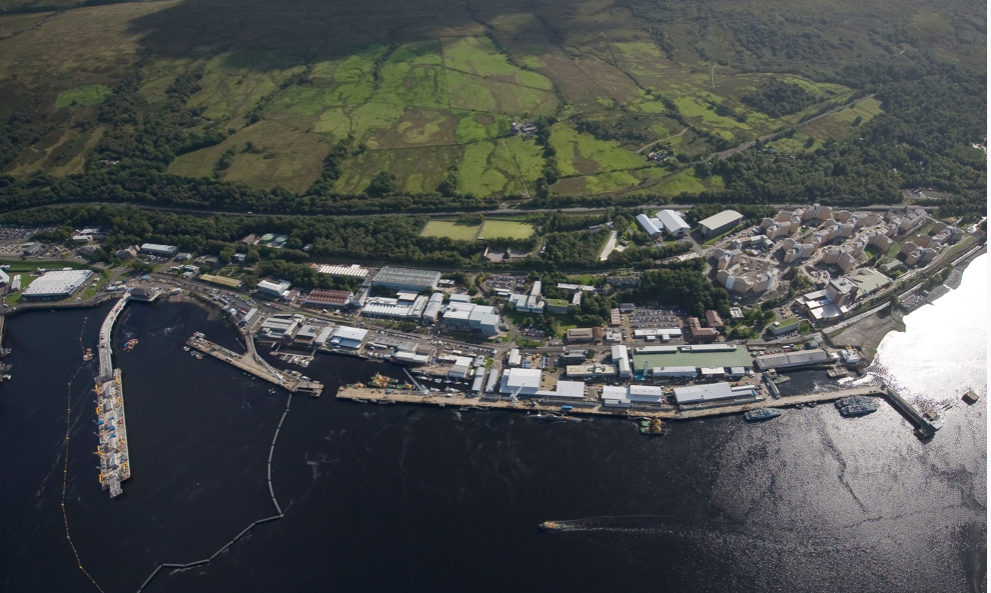
Figure 2: HMNB Clyde.
HMNB Clyde has developed from a military port established in World War II to becoming the Single Integrated Operating Base for all UK submarines (by 2020). It is one of the largest single-site employers in Scotland.
The largest exercise in Scotland is the biannual ‘Joint Warrior’, which is primarily conducted off the west coast. In recent years these exercises have typically involved around 10,000 military personnel, 35 warships, 5 submarines (Figure a shows example of such) and 59 aircraft and helicopters. Countries including Belgium, Canada, Denmark, Estonia, France, Germany, Italy, Latvia, Lithuania, the Netherlands, Norway, Spain and the US have participated with many of the ships making port visits at Leith, Glasgow and Faslane. Ahead of the Joint Warrior exercises the Ministry of Defence alerts appropriate stakeholders to details of their intended operations and publishes details on their web site.


See also text in Historic Environment And Cultural Heritage section.
Contribution to the economy
At 1 April 2019, 13,690 military and civilian Ministry of Defence personnel were based in Scotland. Of these, 4,010 were civilian and 9,680 were military (Figure 3). 36% of all MOD personnel were based in Argyll & Bute and 19% in Moray. As no specific defence related gross value added information is available, employment can be used as a proxy measure of economic contribution. Between 2014 and 2019, the number of personnel based in Scotland decreased by 6%, from 14,510 on 1 April 2014.
The MOD spent nearly £1.65 billion with Scottish businesses in 2017/18, supporting an additional 10,000 private sector jobs. This expenditure has shown steady growth for the fourth year running, averaging a yearly increase in total expenditure of 4.2% since 2013/14. This is due to a continued growth in contract payments across the board, rather than one particularly high value contract (UK Government, 2019).
A £1.3 billion of Defence investment in infrastructure, from 2017, (UK Government, 2017a) is already in train to improve facilities at HM Naval Base Clyde. Construction of an Escape and Rescue facility is well advanced, and the building of new naval schools and training facilities is underway.
The Type 26 Frigate manufacture Batch 1 contract was signed in June 2017 at a value of £3.7 billion and the first two ships, HMS Glasgow and HMS Cardiff, are under construction at Clyde. The orders for five Royal Navy Offshore Patrol Vessels and this first batch of three Type 26 Frigates have secured the long-term future of shipbuilding at Govan and Scotstoun (Clyde).
The Queen Elizabeth class aircraft carriers are the biggest and most advanced warships ever built for the Royal Navy. The second of the Royal Navy’s new Queen Elizabeth Carriers, HMS Prince of Wales, is now complete and was fitted out in the Babcock shipyard in Rosyth by the Aircraft Carrier Alliance. Although both of the Royal Navy’s new aircraft carriers have been assembled at Rosyth (where 1,700 people were employed in completing HMS Prince of Wales), the scale of the project means that construction has involved five shipyards in addition to Rosyth (Glasgow, Appledore in Devon, Hebburn in Tyneside, Birkenhead in Merseyside, Portsmouth).
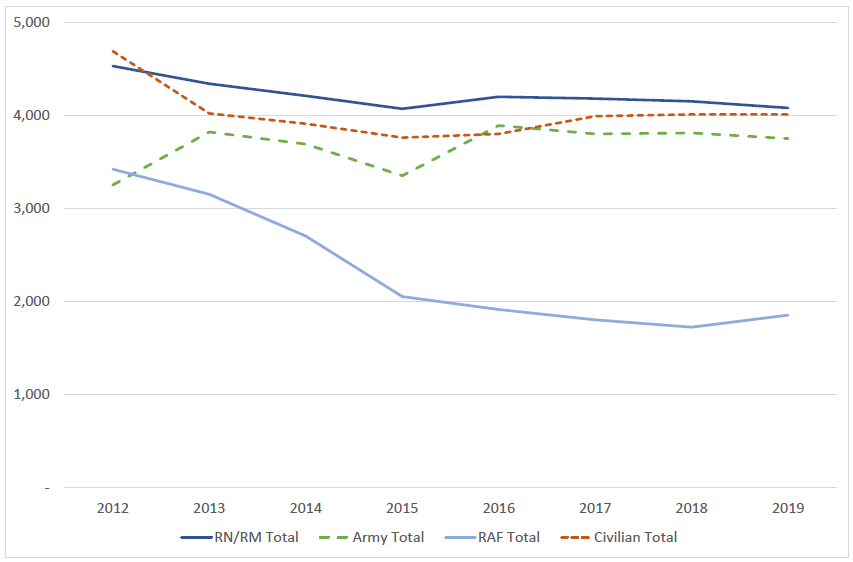
Figure 3: MOD civilian and military personnel numbers in Scotland, by service, 2012 to 2019. Source: Ministry of Defence statistics: Location of UK Regular Service and Civilian Personnel Statistics. RN = Royal Navy. RM = Royal Marines. RAF = Royal Air Force.
The trend assessment is based on the change in the number of personnel (military and civilian) in each local authority between 2014 and 2018. This value is used as a proxy for defence economic activity in the absence of being able to determine specific defence related Gross Value Added (GVA).
|
|
|
Change 2014 to 2018
|
||
|
Local authority
|
Total number in 2018
|
Number
|
%
|
Arrow
|
|
Aberdeen City
|
70
|
-
|
0%
|
↔
|
|
Aberdeenshire
|
70
|
10
|
17%
|
↑
|
|
Angus
|
690
|
-110
|
-14%
|
↓
|
|
Argyll and Bute
|
4,840
|
270
|
6%
|
↑
|
|
Dumfries and Galloway
|
10
|
-
|
0%
|
↔
|
|
Dundee City
|
40
|
-
|
0%
|
↔
|
|
Edinburgh - City of
|
1,190
|
-350
|
-23%
|
↓
|
|
Falkirk
|
-
|
-10
|
-100%
|
↓
|
|
Fife
|
1,260
|
-530
|
-30%
|
↓
|
|
Glasgow City
|
1,170
|
50
|
4%
|
↔
|
|
Highland
|
650
|
-40
|
-6%
|
↓
|
|
Inverclyde
|
-
|
|
|
|
|
Midlothian
|
530
|
-90
|
-15%
|
↓
|
|
Moray
|
2,530
|
160
|
7%
|
↑
|
|
Na h-Eileanan Siar
|
10
|
-
|
0%
|
↔
|
|
North Ayrshire
|
280
|
10
|
4%
|
↔
|
|
North Lanarkshire
|
-
|
|
|
|
|
Orkney Islands
|
-
|
|
|
|
|
Perth & Kinross
|
20
|
-
|
0%
|
↔
|
|
Renfrewshire
|
10
|
-
|
0%
|
↔
|
|
Scottish Borders
|
-
|
|
|
|
|
South Ayrshire
|
20
|
-40
|
-67%
|
↓
|
|
South Lanarkshire
|
10
|
-
|
0%
|
↔
|
|
Stirling
|
180
|
-120
|
-40%
|
↓
|
|
West Dunbartonshire
|
100
|
-10
|
-9%
|
↓
|
|
West Lothian
|
10
|
10
|
|
↑
|
|
Unallocated
|
10
|
-
|
0%
|
↔
|
|
SCOTLAND
|
13,700
|
-810
|
-6%
|
↓
|
Examples of socio-economic effects
- Full and part time employment.
- Economic impact near bases with personnel active in their local community.
- Law enforcement and protection of offshore activities.
- Provision of Search and Rescue services.
- Exercise areas and live firing ranges may restrict other uses.
- Historic munition dump sites can restrict other seabed users.
Pressures on the environment
An OSPAR agreed list of marine pressures is used to help assessments of human activities in the marine environment. The marine pressure list has been adapted for use in Scotland via work on the Feature Activity Sensitivity Tool (FeAST). Military activities can be associated with 20 marine pressures – please read the pressure descriptions and benchmarks for further detail.
The list of marine pressures is used to help standardise assessments of activities on the marine environment, and is adapted from an agreed list prepared by OSPAR Intercessional Correspondence Group on Cumulative Effects (ICG-C) (see OSPAR 2014-02 ‘OSPAR Joint Assessment and Monitoring Programme (JAMP) 2014-2021’ Update 2018’ (Table II).
The Feature Activity Sensitivity Tool (FeAST) uses the marine pressure list to allow users to investigate the sensitivity of Scottish marine features. It also associates all pressures that might be exerted by a defined list of activities at a particular benchmark. The extent and impact of each pressure from a given activity will vary according to its intensity or frequency. The extent and impact of the pressure will also vary depending on the sensitivity of the habitat or species on which it is acting. The existence of multiple activities, and potentially multiple pressures, at specific locations will result in a cumulative impact on the environment.
FeAST is a developing tool. A snap shot from 2019 was used for the development of SMA2020. Please consult the FeAST webpage for further information and up to date information.
The list of pressures below associated with this activity is given in alphabetical order. Clicking the pressure will give you more information on the pressure and examples of how it may be associated with the activity.
Forward look
The Joint Warrior exercises are expected to continue as will everyday use of the coasts and seas by the various elements of the Ministry of Defence.
As part of the £1.7 billion of investment in infrastructure, from 2017, in Scottish military bases (UK Government, 2017b), £1.3 billion is being invested in facilities to improve HMNB Clyde. Improvements include the construction of a Submarine Escape and Rescue facility and the building of new naval schools and training facilities. The number of people employed at HMNB Clyde (military and civilian) will increase from the current 6,800 to 8,200 by 2022 (Royal Navy press release, February 2017).
Shipbuilding work has commenced on the first batch of three (of eight) Type 26 Frigates at Govan and Scotstoun (Clyde). A contract for the second batch of five ships will be placed in the early 2020s. Work is expected to be complete in the mid-2030s. These contracts along with the orders for five Royal Navy Offshore Patrol Vessels will sustain some 1,700 jobs in the Scottish shipyards and a further 2,300 jobs throughout the wider UK supply chain until the 2030s.
In November 2019, Babcock was awarded the £1.25 billion contract for five new Type 31 frigates, to be assembled at Rosyth.

Economic trend assessment
Source is published statistics from MOD. While the Gross Value Added (GVA) is not available, the staff employed (MOD personnel number) is a good proxy for defence economic activity and is attributed to local authorities.
Change in the total number of military and civilian staff, by local authority, 2014 to 2018.
|
Local authority |
Change 2014 to 2018 |
|
Aberdeen City |
|
|
Aberdeenshire |
|
|
Angus |
|
|
Argyll and Bute |
|
|
Dumfries and Galloway |
|
|
Dundee City |
|
|
Edinburgh - City of |
|
|
Falkirk |
|
|
Fife |
|
|
Glasgow City |
|
|
Highland |
|
|
Inverclyde |
|
|
Midlothian |
|
|
Moray |
|
|
Na h-Eileanan Siar |
|
|
North Ayrshire |
|
|
North Lanarkshire |
|
|
Orkney Islands |
|
|
Perth & Kinross |
|
|
Renfrewshire |
|
|
Scottish Borders |
|
|
South Ayrshire |
|
|
South Lanarkshire |
|
|
Stirling |
|
|
West Dunbartonshire |
|
|
West Lothian |
|
|
Unallocated |
|
|
SCOTLAND |
|
Grey cells where no MOD personnel were employed in 2018.
'No change' arrows used where change is less than 5%.
This Legend block contains the key for the status and trend assessment, the confidence assessment and the assessment regions (SMRs and OMRs or other regions used). More information on the various regions used in SMA2020 is available on the Assessment processes and methods page.
Status and trend assessment
|
Status assessment
(for Clean and safe, Healthy and biologically diverse assessments)
|
Trend assessment
(for Clean and safe, Healthy and biologically diverse and Productive assessments)
|
||
|---|---|---|---|
 |
Many concerns |
No / little change |
|
 |
Some concerns |
Increasing |
|
 |
Few or no concerns |
Decreasing |
|
 |
Few or no concerns, but some local concerns |
No trend discernible |
|
 |
Few or no concerns, but many local concerns |
All trends | |
 |
Some concerns, but many local concerns |
||
 |
Lack of evidence / robust assessment criteria |
||
| Lack of regional evidence / robust assessment criteria, but no or few concerns for some local areas | |||
 |
Lack of regional evidence / robust assessment criteria, but some concerns for some local areas | ||
| Lack of regional evidence / robust assessment criteria, but many concerns for some local areas | |||
Confidence assessment
|
Symbol |
Confidence rating |
|---|---|
|
Low |
|
|
Medium |
|
|
High |

Assessment regions
 and the Scottish Offshore Marine Regions (OMRs, O1 – O10)")
Key: S1, Forth and Tay; S2, North East; S3, Moray Firth; S4 Orkney Islands, S5, Shetland Isles; S6, North Coast; S7, West Highlands; S8, Outer Hebrides; S9, Argyll; S10, Clyde; S11, Solway; O1, Long Forties, O2, Fladen and Moray Firth Offshore; O3, East Shetland Shelf; O4, North and West Shetland Shelf; O5, Faroe-Shetland Channel; O6, North Scotland Shelf; O7, Hebrides Shelf; O8, Bailey; O9, Rockall; O10, Hatton.
 Regions. These have been used as the assessment areas for hazardous substances.")
, Regions.")