Sections
Key message
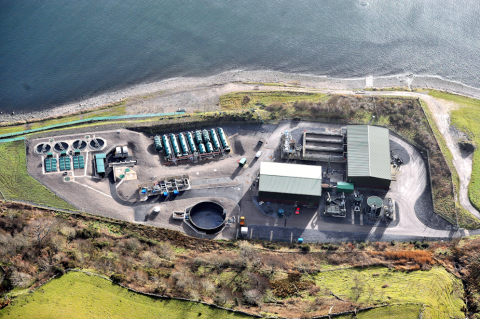
What, why and where?
Outfalls to the marine environment fall into three categories:
- outfalls from waste water treatment (WWT) plants which process waste water from the mains sewerage system;
- industrial sites which take waste from manufacturing plants; and
- some private WWT systems such as septic tanks.
These categories of outfall also discharge to the riverine freshwater environment which eventually reach the sea. WWT is designed to process waste water whilst protecting the environment and maintaining public health.
All sewerage systems that also collect rainwater (combined sewers) need overflow outlets (combined sewer overflows) that deal with the extra water collected during some rainstorms. Without these safety valves there would be a flooding risk at both the sewerage works and in other properties. Sewage in these overflow discharges is diluted with significant amounts of rainwater.
The Urban Waste Water Treatment Directive 1991 sets out treatment levels for waste water, with discharges into sensitive areas subject to more stringent treatment. Scottish Water has objectives for improving the quality of wastewater treatment works discharges to ensure compliance with environmental directives.
Information on emissions is also reported to the Scottish Environment Protection Agency (SEPA) as a requirement of the Scottish Pollutant Release Inventory (SPRI).
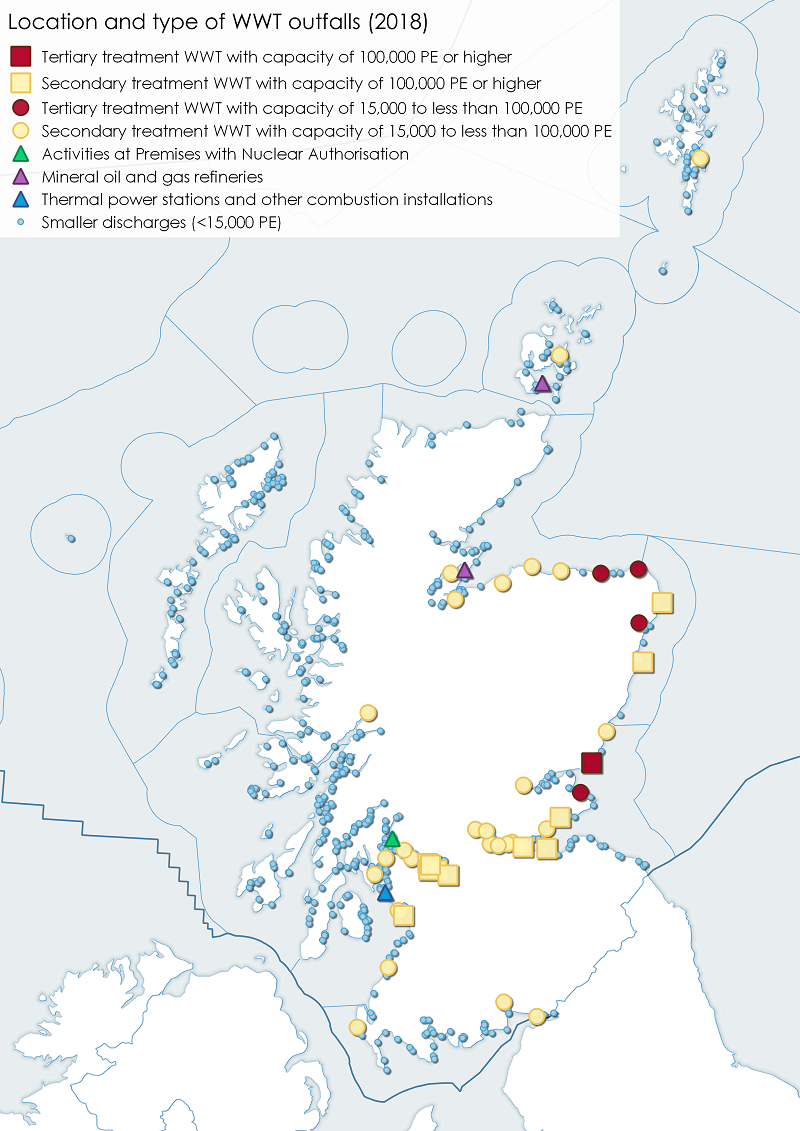
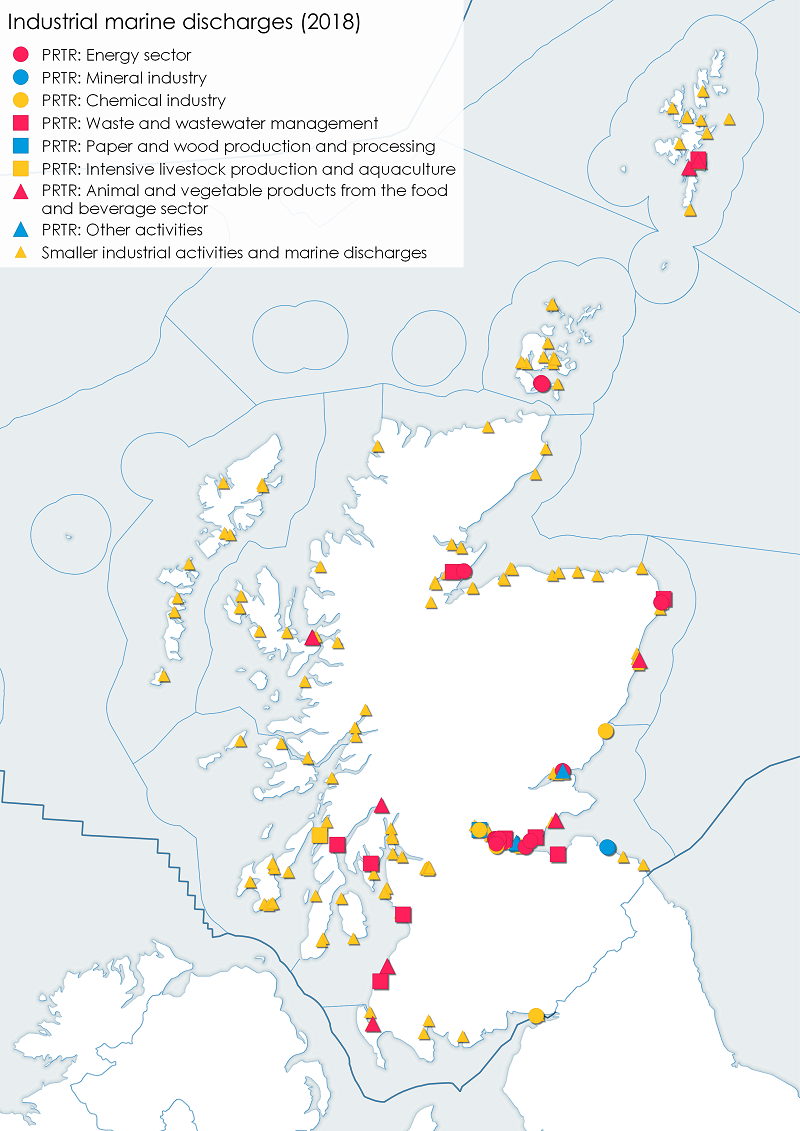
There are more outfalls reported in 2018 than in 2011 (Baxter et al., 2011) for both WWT (826>384) and industrial sites (290 >112) (tables 1-3, Figures 1 and 2) due to improvements in data reporting.
Details of the chemicals monitored in the seas, which can be released from both waste water and industrial outfalls, are in the Clean and safe section.
|
Type of WWT outfall
|
Number of outfalls
|
|
Activities at Premises with Nuclear Authorisation under the Radioactive Substances Act 1993 Fees and Charging (Scotland) Scheme 2004
|
1
|
|
Mineral oil and gas refineries
|
6
|
|
Smaller discharges (<15,000 PE)
|
749
|
|
Thermal power stations and other combustion installations
|
1
|
|
WWT with capacity of greater than or equal to 100,000 PE - Secondary treatment
|
18
|
|
WWT with capacity of greater than or equal to 100,000 PE - Tertiary treatment
|
1
|
|
WWT with capacity of 15,000 to less than 100,000 PE - Secondary treatment
|
46
|
|
WWT with capacity of 15,000 to less than 100,000 PE - Tertiary treatment
|
4
|
|
TOTAL
|
826
|
|
Regulated activity
|
Number of outfalls
|
|
Abstraction Fish Production
|
4
|
|
Industrial or Commercial: Non-Evaporative Cooling
|
2
|
|
Other Effluent
|
71
|
|
Other Effluent Cooling Water
|
14
|
|
Other Effluent Dewatering of Dry Docks
|
4
|
|
Other Effluent Distilling Effluent
|
28
|
|
Other Effluent Food Processing
|
19
|
|
Other Effluent Landfill Leachate
|
7
|
|
Other Effluent Mine Water
|
1
|
|
Other Effluent Potable Water Treatment and Supply
|
3
|
|
Surface Water (Other) Commercial, Ind & Other
|
31
|
|
Surface Water (Other) Housing
|
2
|
|
Surface Water (Other) Motorways & Major Roads
|
3
|
|
Surface Water (Scottish Water) Commercial, Ind & Other
|
25
|
|
Total
|
214
|
|
Pollutant Release and Transfer Register category
|
Number of outfalls
|
|
Energy sector
|
26
|
|
Animal and vegetable products from the food and beverage sector
|
16
|
|
Waste and wastewater management
|
13
|
|
Other activities
|
12
|
|
Chemical industry
|
4
|
|
Paper and wood production and processing
|
2
|
|
Mineral industry
|
2
|
|
Intensive livestock production and aquaculture
|
1
|
|
Total
|
76
|
Treatment
There are four types of treatment undertaken at waste water treatment plants:
- Preliminary treatment is the first stage of the process and involves the removal of coarse solids and large materials.
- Primary treatment is a physical and/or chemical process involving settlement of suspended solids.
- Secondary treatment is a process generally involving biological treatment either with secondary settlement or another process. Secondary treatment is designed to reduce the suspended solids and oxygen demand. It also reduces the bacterial content of sewage.
- Tertiary treatment is the final stage of the process and can include filtration, removal of nutrients such as phosphorous and nitrogen, and disinfection, for example by UV light.
WWT plants and outfalls (Table a (by type) and Table b (by volume) per Scottish Marine Region) are found all around the coastline near villages, towns and cities (Figure 1). Those with the larger capacity and higher treatment levels being concentrated in the major firths, near large cities or near sensitive receiving waters.
Scottish Water has objectives for 2015 - 2021. Relevant to the marine environment these include improving the quality of wastewater treatment works discharges to ensure compliance with the environmental standards set out in all appropriate directives. This improvement is monitored through the Government chaired Delivery Assurance Group which reports to Ministers. To date it shows that the investments are on track to deliver environmental protection and improvements in both river and bathing water quality. There is also a requirement to plan for the provision of new strategic capacity to meet the needs of all new housing development until 2021.
When parts of the sewerage network are overloaded by rainwater during storms, they are designed to overflow into the water environment to prevent worse damage elsewhere in the system. This can result in the temporary pollution of our watercourses, bathing waters and shellfish waters. It is now Scottish Water policy that no new surface water is allowed to enter combined sewers from housing developments. Efforts are being made to remove more surface water from sewers to reduce flows to outfalls.
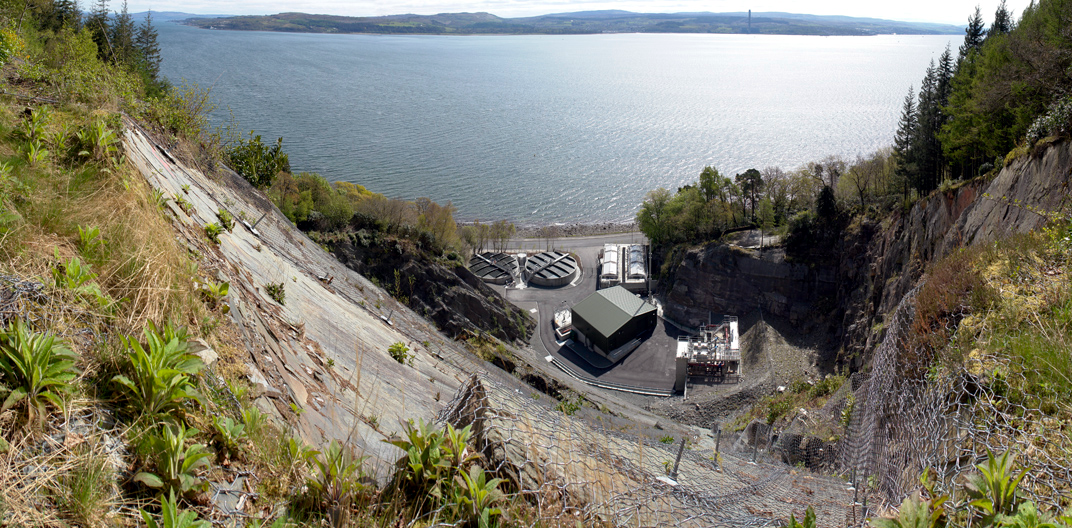
Scottish Water provides sewerage services to the majority of households in Scotland, although some households have private discharges. Most of the over 1,800 public waste water treatment works are operated by Scottish Water but 20 large works are run on behalf of the public by private companies under the Private Finance initiative. The majority of the estimated 250,000 private systems serve domestic properties but include some bigger systems serving caravan parks, hotels and other business premises. Data on domestic discharges from private systems such as septic tanks are not included here.
Industrial effluent discharges are licensed if the volume of effluent is >10m3/day and has a population equivalent >15 and are subject to control placed on the amount and nature of the discharge. SEPA regulates such outfall discharges through The Water Environment (Controlled Activities) (Scotland) Regulations 2011. The outfalls can be categorised into two by their relative size. Table 2 shows the number of industrial activities (small) and marine discharge outfalls (2018) by regulated activity and Table c shows these per SMR. The larger outfalls, by Pollutant Release and Transfer Register category are shown in Table 3 and per SMR in Table d.
Information on emissions is also reported by the site operator to the Scottish Environment Protection Agency (SEPA) as a requirement of the Scottish Pollutant Release Inventory (SPRI). This is a database of annual mass releases of specified pollutants to air, water and land from SEPA regulated industrial sites. It also provides information about off-site transfers of waste from these sites. Reporting thresholds are set to capture around 95% of all industrial pollutant releases.
The SPRI inventory is a statutory requirement and allows Scotland to comply with the European Community Pollutant Release and Transfer Regulation (E-PRTR). It also enables the public and government bodies to centrally search and analyse emissions from regulated sites in Scotland.
|
Scottish Marine Region (SMR)
|
Activities at Premises with Nuclear Authorisation under the Radioactive Substances Act 1993 Fees and Charging (Scotland) Scheme 2004
|
Mineral oil and gas refineries
|
Smaller discharges (<15,000 PE)
|
Thermal power stations and other combustion installations
|
Waste water treatment by capacity and type
|
||||
|
100,000 PE and over – Secondary treatment
|
100,000 PE and over - Tertiary treatment
|
15,000 to 100,000 PE - Secondary treatment
|
15,000 to 100,000 PE - Tertiary treatment
|
TOTAL
|
|||||
|
Argyll
|
|
|
106
|
|
|
|
|
|
106
|
|
Clyde
|
1
|
|
167
|
1
|
10
|
|
9
|
|
188
|
|
Forth and Tay
|
|
|
87
|
|
6
|
1
|
20
|
1
|
115
|
|
Moray Firth
|
|
2
|
56
|
|
|
|
8
|
2
|
68
|
|
North Coast
|
|
|
6
|
|
|
|
|
|
6
|
|
North East
|
|
|
10
|
|
2
|
|
|
1
|
13
|
|
Orkney Islands
|
|
4
|
33
|
|
|
|
2
|
|
39
|
|
Outer Hebrides
|
|
|
81
|
|
|
|
|
|
81
|
|
Shetland Isles
|
|
|
39
|
|
|
|
1
|
|
40
|
|
Solway
|
|
|
52
|
|
|
|
4
|
|
56
|
|
West Highlands
|
|
|
112
|
|
|
|
2
|
|
114
|
|
TOTAL
|
1
|
6
|
749
|
1
|
18
|
1
|
46
|
4
|
826
|
|
SMR
|
Volumes
|
Total
|
||||||||
|
0 to 5 m3/d
|
> 5 to 20 m3/d
|
> 20 to 100 m3/d
|
> 100 to 1000 m3/d
|
> 1,000 to 10,000 m3/d
|
> 10,000 to 50,000 m3/d
|
> 50,000 to 150,000 m3/d
|
> 150,000 m3/d
|
UNKNOWN
|
||
|
Argyll
|
|
|
2
|
1
|
1
|
|
|
|
102
|
106
|
|
Clyde
|
|
6
|
27
|
15
|
10
|
5
|
1
|
4
|
119
|
187
|
|
Forth and Tay
|
1
|
|
31
|
10
|
13
|
8
|
5
|
2
|
45
|
115
|
|
Moray Firth
|
2
|
1
|
7
|
7
|
12
|
|
1
|
|
35
|
65
|
|
North Coast
|
|
|
|
2
|
1
|
|
|
|
3
|
6
|
|
North East
|
|
|
1
|
1
|
2
|
|
|
|
9
|
13
|
|
Orkney Islands
|
|
|
2
|
3
|
1
|
|
|
|
29
|
35
|
|
Outer Hebrides
|
|
2
|
29
|
23
|
3
|
1
|
|
|
23
|
81
|
|
Shetland Isles
|
6
|
|
4
|
2
|
|
|
|
|
28
|
40
|
|
Solway
|
|
2
|
9
|
11
|
5
|
2
|
|
|
27
|
56
|
|
West Highlands
|
1
|
|
4
|
7
|
4
|
|
|
|
97
|
113
|
|
Total
|
10
|
11
|
116
|
82
|
52
|
16
|
7
|
6
|
517
|
817
|
|
Regulated Activity per SMR
|
Number of outfalls
|
|
Argyll
|
21
|
|
Abstraction Fish Production
|
2
|
|
Other Effluent
|
1
|
|
Other Effluent Cooling Water
|
4
|
|
Other Effluent Distilling Effluent
|
12
|
|
Other Effluent Potable Water Treatment and Supply
|
2
|
|
Clyde
|
33
|
|
Other Effluent
|
13
|
|
Other Effluent Cooling Water
|
3
|
|
Other Effluent Distilling Effluent
|
1
|
|
Other Effluent Food Processing
|
2
|
|
Other Effluent Landfill Leachate
|
1
|
|
Surface Water (Other) Commercial, Ind & Other
|
11
|
|
Surface Water (Other) Housing
|
2
|
|
Forth and Tay
|
25
|
|
Other Effluent
|
12
|
|
Other Effluent Food Processing
|
4
|
|
Other Effluent Landfill Leachate
|
4
|
|
Other Effluent Mine Water
|
1
|
|
Surface Water (Other) Commercial, Ind & Other
|
1
|
|
Surface Water (Other) Motorways & Major Roads
|
2
|
|
Surface Water (SW) Commercial, Ind & Other
|
1
|
|
Moray Firth
|
40
|
|
Industrial or Commercial: Non-Evaporative Cooling
|
2
|
|
Other Effluent
|
5
|
|
Other Effluent Cooling Water
|
4
|
|
Other Effluent Dewatering of Dry Docks
|
1
|
|
Other Effluent Distilling Effluent
|
13
|
|
Other Effluent Landfill Leachate
|
1
|
|
Surface Water (Other) Commercial, Ind & Other
|
8
|
|
Surface Water (SW) Commercial, Ind & Other
|
6
|
|
North Coast
|
1
|
|
Other Effluent
|
1
|
|
North East
|
32
|
|
Other Effluent
|
2
|
|
Other Effluent Dewatering of Dry Docks
|
3
|
|
Other Effluent Food Processing
|
4
|
|
Surface Water (Other) Commercial, Ind & Other
|
8
|
|
Surface Water (Other) Motorways & Major Roads
|
1
|
|
Surface Water (SW) Commercial, Ind & Other
|
14
|
|
Orkney Islands
|
17
|
|
Other Effluent
|
9
|
|
Other Effluent Cooling Water
|
3
|
|
Other Effluent Food Processing
|
2
|
|
Surface Water (SW) Commercial, Ind & Other
|
3
|
|
Outer Hebrides
|
9
|
|
Other Effluent
|
3
|
|
Other Effluent Distilling Effluent
|
1
|
|
Other Effluent Food Processing
|
2
|
|
Other Effluent Potable Water Treatment and Supply
|
1
|
|
Surface Water (Other) Commercial, Ind & Other
|
1
|
|
Surface Water (SW) Commercial, Ind & Other
|
1
|
|
Shetland Isles
|
17
|
|
Other Effluent
|
12
|
|
Other Effluent Food Processing
|
3
|
|
Other Effluent Landfill Leachate
|
1
|
|
Surface Water (Other) Commercial, Ind & Other
|
1
|
|
Solway
|
6
|
|
Other Effluent
|
4
|
|
Other Effluent Food Processing
|
2
|
|
West Highlands
|
13
|
|
Abstraction Fish Production
|
2
|
|
Other Effluent
|
9
|
|
Other Effluent Distilling Effluent
|
1
|
|
Surface Water (Other) Commercial, Ind & Other
|
1
|
|
Total
|
214
|
|
Pollutant Release and Transfer Register category
|
Number of outfalls
|
|
Argyll
|
|
|
Intensive livestock production and aquaculture
|
1
|
|
Clyde
|
|
|
Waste and wastewater management
|
5
|
|
Animal and vegetable products from the food and beverage sector
|
5
|
|
Forth and Tay
|
|
|
Energy sector
|
17
|
|
Other activities
|
12
|
|
Waste and wastewater management
|
5
|
|
Chemical industry
|
3
|
|
Paper and wood production and processing
|
2
|
|
Animal and vegetable products from the food and beverage sector
|
2
|
|
Mineral industry
|
2
|
|
Moray Firth
|
|
|
Waste and wastewater management
|
1
|
|
Energy sector
|
1
|
|
North East
|
|
|
Energy sector
|
4
|
|
Waste and wastewater management
|
1
|
|
Animal and vegetable products from the food and beverage sector
|
1
|
|
Orkney Islands
|
|
|
Energy sector
|
4
|
|
Shetland Isles
|
|
|
Animal and vegetable products from the food and beverage sector
|
4
|
|
Waste and wastewater management
|
1
|
|
Solway
|
|
|
Chemical industry
|
1
|
|
Animal and vegetable products from the food and beverage sector
|
1
|
|
West Highlands
|
|
|
Animal and vegetable products from the food and beverage sector
|
3
|
|
Total
|
76
|
Contribution to the economy
In economic terms, waste water treatment and industrial outfalls do not generate economic value in their own right and their contribution, in terms of GVA or employment, is therefore not included in the Scottish Annual Business Survey. There is no direct information on employment in waste water treatment as Scottish Water, who run the vast majority of public waste water treatment works, only publish total employment numbers. At the end of March 2019 Scottish Water directly employed 4,276 people and a further 404 temporary agency workers.
In 2019 £7.1M of SEPA’s income was generated by licences issued for disposal in coastal waters. This is across about 738 discharge licences to coastal and transitional waters. There may be multiple outfalls per license and some of the outfalls are not operational.
|
|
Total Charge
|
Number of discharge licences
|
|
Coastal waters
|
£5.9 million
|
694
|
|
Transitional waters
|
£1.2 million
|
44
|
|
Total
|
£7.1 million
|
738
|
Between 2010/11 and 2018/19, Scottish Water invested £197M in activity, including new and improved waste water treatment plants and collection systems, to comply with the Urban Waste Water Treatment Directive requirement. During the same period a further £38M was invested in activity, including improved treatment facilities and collection systems to meet Bathing Waters Directive requirements.
Examples of socio-economic effects
- Allows industries to function by providing a service.
- Employment.
- Provides clean seas for other activities e.g. bathing, aquaculture, public health.
- Mitigates risk of flooding.
- Provision of infrastructure.
- Potential pollution especially if systems fail.
- Possible obstruction on seabed.
- Release of pathogens including some that can have adverse health consequences for marine wildlife and for human health.
Pressures on the environment
An OSPAR agreed list of marine pressures is used to help assessments of human activities in the marine environment. The marine pressure list has been adapted for use in Scotland via work on the Feature Activity Sensitivity Tool (FeAST). Waste water treatment and industrial outfall activities can be associated with 19 marine pressures – please read the pressure descriptions and benchmarks for further detail.
The list of marine pressures is used to help standardise assessments of activities on the marine environment, and is adapted from an agreed list prepared by OSPAR Intercessional Correspondence Group on Cumulative Effects (ICG-C) (see OSPAR 2014-02 ‘OSPAR Joint Assessment and Monitoring Programme (JAMP) 2014-2021’ Update 2018’ (Table II).
The Feature Activity Sensitivity Tool (FeAST) uses the marine pressure list to allow users to investigate the sensitivity of Scottish marine features. It also associates all pressures that might be exerted by a defined list of activities at a particular benchmark. The extent and impact of each pressure from a given activity will vary according to its intensity or frequency. The extent and impact of the pressure will also vary depending on the sensitivity of the habitat or species on which it is acting. The existence of multiple activities, and potentially multiple pressures, at specific locations will result in a cumulative impact on the environment.
FeAST is a developing tool. A snap shot from 2019 was used for the development of SMA2020. Please consult the FeAST webpage for further information and up to date information.
The list of pressures below associated with this activity is given in alphabetical order. Clicking the pressure will give you more information on the pressure and examples of how it may be associated with the activity.
Forward look
Planning for the 2021-2027 period is underway with more investment needs being identified, which will lead to upgraded treatment works and improved overflows which will benefit coastal waters. There are also requirements in various directives, for example urban waste water treatment directive, bathing waters directive and shellfish directives, to ensure minimal impact and a sustainable co-existence with other existing marine activities such as aquaculture, fishing and bathing.
SEPA is currently preparing for the publication of the third River Basin Management Plans, due at the end of 2021, that will set out the aims and objectives to protect and improve the water environment from 2021 to 2027. Scottish Water is working with SEPA to plan and phase investments so that they can manage their resources to ensure they can fulfil their obligations by 2027.
Economic trend assessment
Trend assessments are not applicable to waste water treatment and industrial outfalls. While information on outfalls is available by type and location they do not generate economic value in their own right.
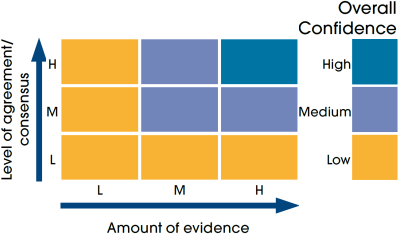
This Legend block contains the key for the status and trend assessment, the confidence assessment and the assessment regions (SMRs and OMRs or other regions used). More information on the various regions used in SMA2020 is available on the Assessment processes and methods page.
Status and trend assessment
|
Status assessment
(for Clean and safe, Healthy and biologically diverse assessments)
|
Trend assessment
(for Clean and safe, Healthy and biologically diverse and Productive assessments)
|
||
|---|---|---|---|
 |
Many concerns |
No / little change |
|
 |
Some concerns |
Increasing |
|
 |
Few or no concerns |
Decreasing |
|
 |
Few or no concerns, but some local concerns |
No trend discernible |
|
 |
Few or no concerns, but many local concerns |
All trends | |
 |
Some concerns, but many local concerns |
||
 |
Lack of evidence / robust assessment criteria |
||
| Lack of regional evidence / robust assessment criteria, but no or few concerns for some local areas | |||
 |
Lack of regional evidence / robust assessment criteria, but some concerns for some local areas | ||
| Lack of regional evidence / robust assessment criteria, but many concerns for some local areas | |||
Confidence assessment
|
Symbol |
Confidence rating |
|---|---|
|
Low |
|
|
Medium |
|
|
High |
Assessment regions
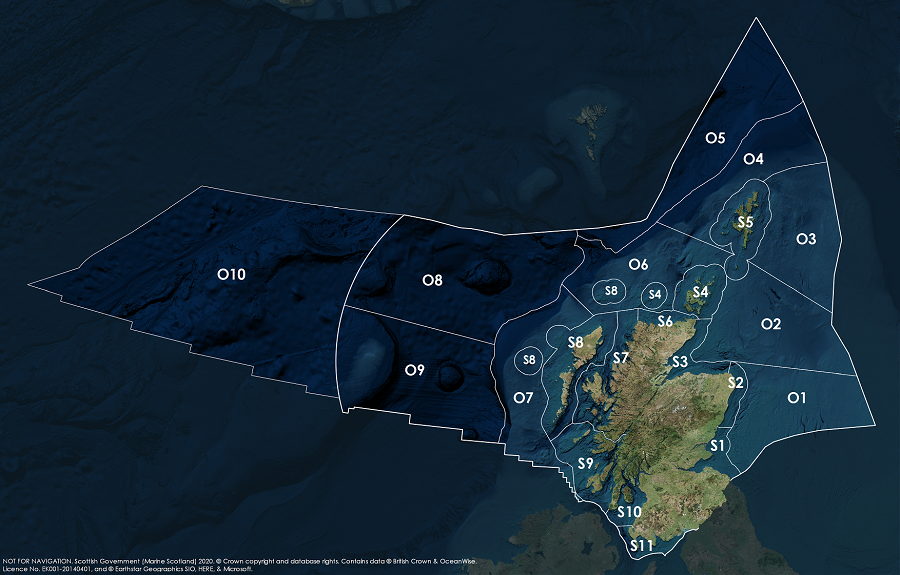
Key: S1, Forth and Tay; S2, North East; S3, Moray Firth; S4 Orkney Islands, S5, Shetland Isles; S6, North Coast; S7, West Highlands; S8, Outer Hebrides; S9, Argyll; S10, Clyde; S11, Solway; O1, Long Forties, O2, Fladen and Moray Firth Offshore; O3, East Shetland Shelf; O4, North and West Shetland Shelf; O5, Faroe-Shetland Channel; O6, North Scotland Shelf; O7, Hebrides Shelf; O8, Bailey; O9, Rockall; O10, Hatton.
