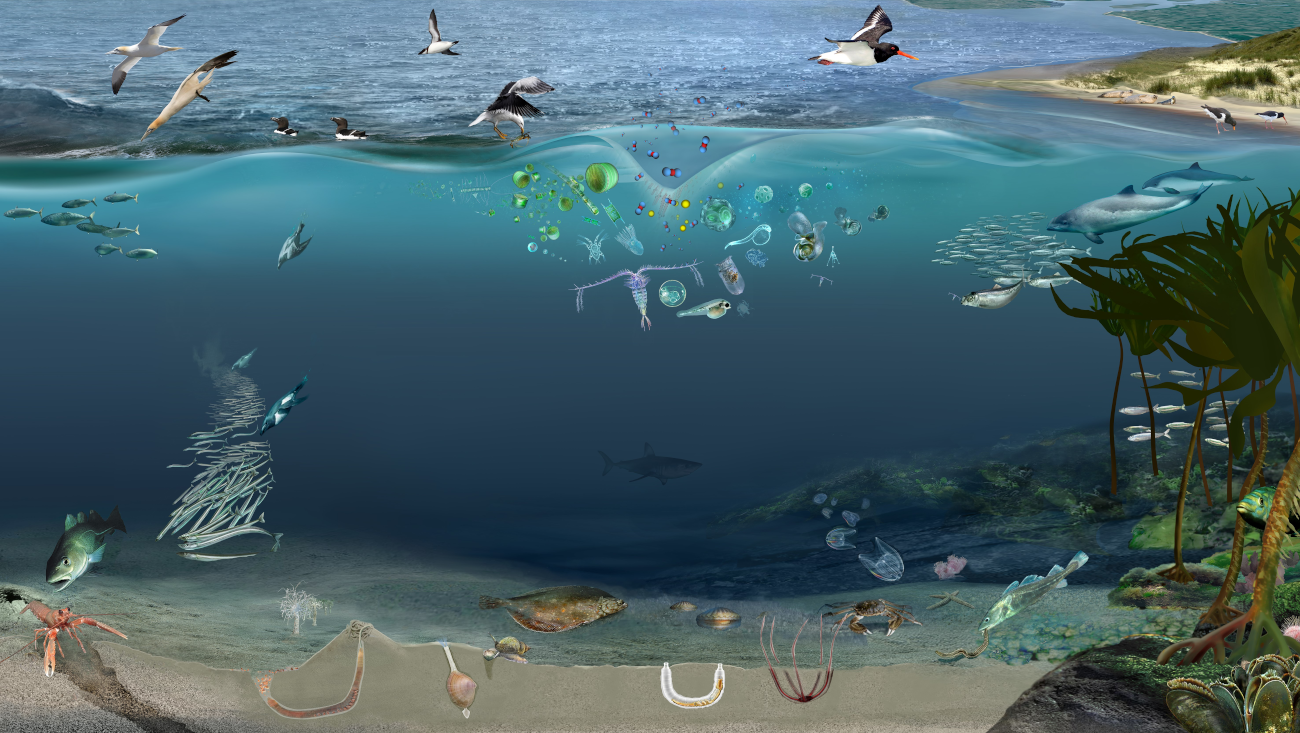
Marine food webs describe the interconnectedness between different species and habitats. They can be used to illustrate and understand the relationships between predators and prey, the way in which energy flows through marine ecosystems and the way in which ecosystems function. An understanding of food webs can also help inform management relating to ecosystem services and the benefits that society gains from Scotland’s seas (see Natural capital, ecosystem services and the Blue Economy section). Figure 1 illustrates the relationships between different marine species in nearshore waters around Scotland.

This case study brings together the results of the relevant species assessments in Scotland’s Marine Assessment 2020 (SMA2020) to provide a descriptive summary of marine food webs in Scotland’s seas in terms of how productive they are, how diverse they are and the abundance/distribution of selected species. This reveals a mixed picture. Taken as a whole, there is a clear message of change in marine food webs, some of which is likely to be caused by climate change, some the result of broader environmental changes (e.g. that caused by non-native species), and some likely to be a response to the direct use of Scotland’s marine environment and the way in which human activities associated with it are managed (e.g. changes in fisheries management).
How food webs have been described
A good understanding of populations of species, and how they are changing, is needed to enable assessments to be undertaken of whether these populations are sustainable, and whether they are likely to be contributing to the overall long-term sustainability of the marine food webs of which they form part. The results have been grouped to reflect different elements of marine food webs: productivity, diversity and abundance/distribution. Table 1 provides further details, including a summary of the key messages from the assessments for each species/species group and a link to each assessment.
In terms of productivity, grey seal pup production continues to increase, whilst breeding success of seabirds is considered to be stable, albeit at a lower level than previously. Diversity has been described through the three fish assessments, revealing no evident trend in deep-sea fish or fish in transitional waters (although limited data lead to low confidence in these results), and a mixed picture from groundfish surveys on the continental shelf with different indicators revealing increases and decreases in certain species offshore. For abundance, where sufficient data are available (birds, plankton, seals, coastal bottlenose dolphins) there is an overall picture of change. Even though the abundance of breeding seabirds is considered stable overall, this masks significant variation between species.
|
Component
|
Species group
|
Summary
|
Assessment (1)
|
|
Productivity of species
|
Seals
|
There has been an increase in total grey seal pup production in Scotland since surveys began in the 1960s. The number of pups born on the east coast has increased exponentially, and this is what has driven most of the increase in pup production across Scotland. In the north and west increases have also been seen, although pup production has, for the most part, been stable since around 2000.
|
Seals (grey seal pup production only)
|
|
Birds
|
During 1986-2018 overall breeding success of seabird species in Scotland has been variable and, on average, 20% below that recorded in 1986. Average breeding success was at its highest during the 1990s, at its lowest during 2004 - 2008 and has subsequently shown some improvement. This assessment is based on the mean breeding success of 12 seabird species.
|
Seabirds (breeding success only)
|
|
|
Diversity of communities
|
Fish
|
There are no evident trends in the diversity of demersal fish assemblages across the Bailey, Faroe-Shetland Channel, Hatton or Rockall offshore marine regions when assessed across three time periods of seven years each (1998 – 2004, 2005 – 2011, 2012 – 2018) and in applying three measures of diversity. The results of this assessment should be taken with some caution as it extrapolates over a large area, based on localised sampling.
|
|
|
Inshore fish communities in estuaries and reduced salinity sea lochs are considered to be in good health in assessed transitional waters but the extent of monitoring is very limited. The assessment is based on only six transitional water bodies (out of 50) monitored since 2013. For most locations only two assessments have been undertaken since 2010, hence no resulting trends are detectable.
|
|||
|
The two indicators reflecting species richness and species diversity across the wider fish community varied spatially, however, offshore areas showed a consistent decrease in status. An indicator relating to fish size (the proportion of large fish by weight) showed an increase over the assessed area (waters less than 200 m depth) that was most pronounced in offshore waters west of Scotland and north of Shetland.
|
|||
|
Abundance/distribution of species
|
Plankton
|
Analysis of plankton data gathered across Scottish waters shows significant changes in ecologically relevant life forms in some regions over the last three decades. These are consistent with trends reported in the greater North Sea and North Atlantic. Some of these trends, but not all, are correlated with Sea Surface Temperature. The precise effects of these changes in the plankton community are not known but as the plankton is at the bottom of the food web they could be significant.
|
|
|
Cetaceans
|
There is no evidence that the abundance of harbour porpoise, white-beaked dolphin and minke whale in the North Sea has changed. The time series do not provide information about historical levels and are currently short, relative to the life span of the species, apart from harbour porpoise. An earlier (pre-2005) shift south in the distribution of harbour porpoise has been maintained. The abundance of coastal bottlenose dolphin on the east coast of Scotland has increased and their distributional range has expanded southwards, as shown by increased sightings in the Firth of Tay and Firth of Forth.
|
||
|
Seals
|
The Scottish grey seal population has increased, driven by increases in the east coast populations. The harbour seal populations on the west coast are stable (although the most recent surveys show an increase), whereas most Northern Isles, north and east coast areas are declining, the reasons for which are unclear.
|
||
|
Birds
|
On average, the abundance of breeding seabirds has been relatively stable since 2011; the 2018 abundance of seabird species had declined on average by 38% from the 1986 baseline value with the steepest decline during the period 2000 to 2011. The largest declines have been for sandeel specialists such as black-legged kittiwake, and Artic skua which parasitise sandeel specialists. There have been notable increases over the 2011 - 2018 period for common and Arctic terns, black guillemot and gannet. The latter has been increasing for some time.
|
Seabirds (abundance only)
|
|
|
The wintering waterbird indicator has increased 15% since 2011. It reached peak values in early 2000s, has since declined, but levelled off and even shown a slight increase in recent years. Since 2011 the increasing trend has been strongest for the wading bird species, which are mostly associated with estuarine environments. Some species are shifting their distributions in response to environmental change.
|
Discussion of results
Interpreting what this mixed picture means for the status of marine food webs is challenging. For most of these species it has been possible to say whether the populations are increasing, decreasing or stable, however, understanding of the drivers of these changes is variable. What is less certain is what the impacts of these changes in species populations are likely to mean for other species and for the wider marine food web of which they form part. Below are three examples that illustrate current understanding of the complexity of the interrelationships.
- The abundance of breeding seabirds has been relatively stable since 2011, however, numbers are now considerably lower than they were in the mid-1980s. As noted above, surface-feeding seabirds have shown the most significant declines, linked to the lack of availability of sandeels. Other species such as gannets, have increased, and again this is thought to be linked to their feeding behaviour, being deeper diving and able to feed on a wider range of prey species. Foster et al. (2017) showed a link between fishery landings and gull numbers on the Isle of Canna. The lower number of gulls recorded more recently appears to be more typical of numbers recorded on Canna in the 1930s than the peaks recorded in the mid-1980s. It appears likely therefore that a combination of environmental change, climate change, fish population changes and fisheries management practices may all be contributing to the changes currently seen in Scotland’s seabirds.


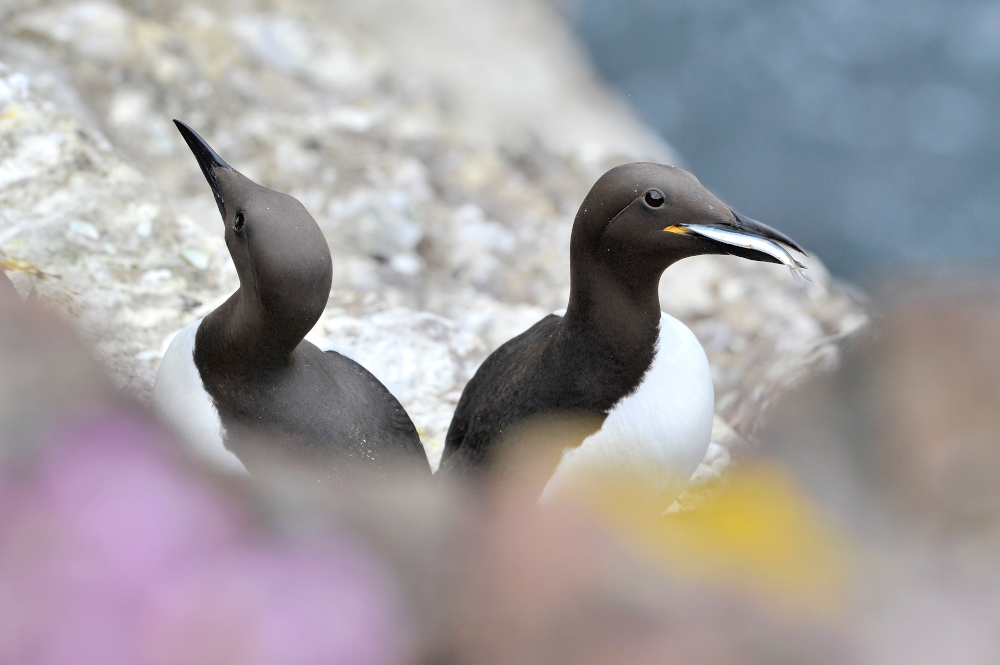
Figure 2: Gannets diving for fish near the Bass Rock (left) and Guillemots with fish, Fowlsheugh, Grampian Area (right). © Lorne Gill , NatureScot.
- The assessment of plankton has shown that the abundance of some types of plankton is changing. Some of this change correlates with changes in sea surface temperature, which is used in this assessment as a proxy for climate change. The precise implications of these changes in plankton are not known however it is likely that higher trophic levels will be impacted by this change in food resource. The assessment highlights that ‘some of the changes observed include increasing trends in diatoms and meroplankton and declining trends in large and small copepods, crustacean and holoplankton lifeforms’. Copepods are an important source of food for many marine species in Scottish waters including larval and adult stages of commercial fish (cod, herring) as well as larger marine animals such as basking sharks. The decline in small copepods has been reported for the wider North Sea (Bedford et al., 2020) and distribution shifts of large copepods, Calanus helgolandicus (a warm-water species expanding north) and Calanus finmarchicus (an arctic-boreal species retracting north), have been observed in the last decades (Edwards et al., 2020). Changes in climate could be driving changes in some of the species that form the base of marine food webs and in turn affecting some of the largest fish in Scotland’s seas. Furthermore there is an indication that seasonal temperature changes are influencing biological processes which in turn is defining the degree of trophic mismatch. An example is the relationship between the lesser sandeel and its copepod prey (Régnier et al., 2019).

- The assessment of the wider fish community, includes the results of the Large Fish Indicator (LFI). The proportion of large fish in a population is important because they are top predators, are a main target for commercial fisheries and contribute disproportionately to spawning. The LFI shows widespread increases in this indicator (i.e. a greater proportion of larger fish in sample trawls) across the Scottish continental shelf. The increases were ‘most pronounced around the Outer Hebrides and around Shetland and north of Shetland’. This reflects recovery of these populations, related at least in part to changes that have been made to fisheries management for demersal fish. Although the indicator shows increases across most of Scotland, some areas are still showing decreases, as are indicators of species richness or diversity in offshore areas. Overall these fish populations are not considered to be meeting good environmental status. Additional measures may be required where assessment thresholds are not met and evidence of recovery trends is either absent or weak, although it should be noted that the LFI is expected to have a time-lagged response to changes in fishing pressure. However, since assessment thresholds have generally yet to be achieved over most of the area assessed, any relaxation of management would be premature.
Next steps
This is a descriptive case study, intended to highlight the complexity of the situation as well as stimulate discussion and development of a full marine food web assessment for the next SMA. The intention is to move beyond simply describing what is known about the populations of species, to a more quantitative assessment that incorporates elements relating to function, dynamism and the relationships between different species and habitats. Over the next assessment period it is expected that there will be significant scientific developments that will support development of this indicator, for example, relating to energy flows. There are also ongoing discussions through OSPAR and the UK Marine Strategy relating to how to assess the status of marine food webs at these different scales. It is likely that development of a Scottish marine food web indicator will be based on collaborations through these wider fora.
The pelagic environment comprises the entire water column. Of all the inhabited environments on Earth it is by far the largest and most diverse, ranging from the surface photic zone to the abyssal depths where life exists in total darkness and at huge pressure. The pelagic environment is populated by a range species for which assessments have been made, namely the Plankton (made up of phytoplankton (microscopic plants) and zooplankton (tiny animals and larvae)) and the nekton comprising Fish, Reptiles, and Mammals together with some free-swimming molluscs (e.g. squid and octopus) and crustacean (e.g. shrimps).
The complexity and interconnectedness of the pelagic environment with the benthic environment (the life found living in and on the sea bed) in the Deep sea and Intertidal and continental shelf is illustrated through the Case study: Marine food webs. This highlights the delicate balance that must be maintained between all the various component parts and the challenges faced from the exploitation of Living resources and the effect of Climate change.

Links and resources
|
, 2019. Understanding temperature effects on recruitment in the context of trophic mismatch. , 9(1), p.15179. Available at: https://www.nature.com/articles/s41598-019-51296-5. |

